Ryota Kobayashi1, Kaori Sato2, Miki Sakazaki3, Yukie Nagai3, Toshihiko Takahashi4, Kenji Asaki5, Soichiro Iwanuma6, Nobuyuki Ohashi7, Takeo Hashiguchi6
1Center for Fundamental Education, Teikyo University of Science: 2-2-1 Senju, Sakuragi, Adachi-ku, Tokyo 120-0045, Japan
2College of Liberal Arts, International Christian University: 3-10-2, Osawa, Mitaka Shi, Tokyo To, 181-0015, Japan
3Research & Development Division, Mitsui Sugar Co., Ltd: 36-2 Nihonbashihakozakicho, Chuo City, Tokyo 103-8423, Japan
4Adachi-ku Track and Field Association: 1-33-22 Yanaka, Adachi-ku, Tokyo 120-0006, Japan
5Department of Tokyo Judo Therapy, Teikyo University of Science: 2-2-1 Senju, Sakuragi, Adachi-ku, Tokyo 120-0045, Japan
6Department of School Education, Teikyo University of Science: 2-2-1 Senju, Sakuragi, Adachi-ku, Tokyo 120-0045, Japan
7Department of Faculty of Medical Technology, Teikyo University: 359 Otsuka, Hachioji, Tokyo 192-0395, Japan
*Corresponding author: Ryota Kobayashi, Center for Fundamental Education, Teikyo University of Science: 2-2-1 Senju, Sakuragi, Adachi-ku, Tokyo 120-0045, Japan
Received: 08 March 2020; Accepted: 16 March 2020; Published: 20 March 2020
Background: We assessed acute effects of palatinose (isomaltulose) consumption on arterial stiffness. Increased arterial stiffness due to elevated postprandial blood glucose levels increases the risk of cardiovascular disease. Palatinose appears to suppress an increase in BG levels while securing energy, and might decrease acute increases in arterial stiffness during hyperglycemia. However, the acute effects of palatinose consumption on arterial stiffness are unknown.
Methods: Ten older adults had two interventions in the following cross-over design: (i) ingestion of 25 g of glucose solution (GSI trial) and (ii) ingestion of 25 g of palatinose solution (PSI trial). Participants fasted for 12 h and then visited the laboratory. We assessed brachialankle (ba) and heartbrachial (hb) pulse wave velocity (PWV), the cardio-ankle vascular index (CAVI), brachial and ankle blood pressure, heart rate, and blood glucose levels at baseline (before ingestion) and 30, 60, and 90 min after ingestion.
Results: Changes in baPWV, hbPWV, the CAVI, and ankle systolic blood pressure were significantly increased from baseline at 30, 60, and 90 min after ingestion in the GSI trial (p < 0.05), but not in the PSI trial. The changes in baPWV, hbPWV, and CAVI were significantly lower after ingestion in the PSI trial compared with the GSI trial. Blood glucose levels were significantly lower at 30 and 60 min after ingestion in the PSI trial compared with the GSI trial (p < 0.01).
Conclusions: We conclude that arterial stiffness may increase after glucose ingestion, but it is not elevated after palatinose ingestion.
Palatinose ingestion; Arterial stiffness; Blood pressure; Blood glucose
Palatinose ingestion articles, Arterial stiffness articles, Blood pressure articles, Blood glucose articles
Introduction
Increased arterial stiffness is an independent risk factor for development of cardiovascular disease [1, 2]. Arterial stiffness increases with age [3]. Therefore, suppressing arterial stiffness in older people is important for preventing cardiovascular disease.
Over the years, carbohydrates have obtained a bad reputation. Elevated postprandial blood glucose (BG) levels increases arterial stiffness [4]. Arterial stiffness increases after glucose ingestion in older people [5]. BG levels increase after meal with age [6]. Increased arterial wall stiffness due to a postprandial increase in BG levels is an independent risk factor for cardiovascular disease [7] [8]. Thus, acute increases in postprandial arterial stiffness in older people should be inhibited. However, moderate carbohydrate intake has been reported as necessary for health (mortality risk) [9]. Moreover, sugar is not only a basic nutrient that supports life, but also has an important role in contributing to taste, such as sweetness and texture, and to impart satisfaction to food [10]. Therefore, it is necessary to clarify a method for suppressing an increase in arterial stiffness while taking carbohydrates in the elderly.
Isomaltulose (palatinose: a registered trademark of Mitsui Sugar Co., Ltd.) is a carbohydrate that takes into account the quality of nutrition. Palatinose is a natural carbohydrate found in honey [11]. Palatinose has similar sweetness, taste, and energy as other sugars. However, the rate of degradation of palatinose in the small intestine is slow, and it can be absorbed slowly to suppress a rise in BG levels [12]. A study of 10 healthy individuals showed a slow increase in BG levels after palatinose intake, showing that peak values were lower than other sugars [13]. Therefore, palatinose appears to suppress an increase in BG levels while securing energy, and might decrease acute increases in arterial stiffness during hyperglycemia. However, the acute effects of palatinose ingestion on arterial stiffness are unknown.
The purpose of this study was to examine changes in arterial stiffness after palatinose intake in the elderly. The present study hypothesized that ingesting glucose, which causes a rapid rise in blood glucose, would increase arterial stiffness, but that arterial stiffness would not increase after ingestion of palatinose.
Materials and methods
Participants
We enrolled 10 older adults (8 women; age, 74.3 ± 3.4 years; height, 154.0 ± 3.4 cm; weight, 55.9 ± 4.3 kg) in this study. Study participants had blood pressure (BP) (<135/85 mm Hg) and fasting BG (<109 mg/dl). The participants had no history, taking, or exercise habits. All of the women who were enrolled were post-menopausal, which is important because estrogen improves arterial stiffness [14]. None of the women had received estrogen replacement therapy. Therefore, post-menopausal women were chosen to avoid the cyclical effects of hormones on arterial stiffness (Table 1). The experimental procedures and study purpose were explained to all volunteers who then provided written informed consent to participate. The study was approved by the Ethics Committee at Teikyo University of Science (18096). The study was performed in accordance with the guidelines for human experimentation published by our Institutional Review Board and the principles of the Declaration of Helsinki.
|
Value |
|
|
Age (years) |
74.3 ± 3.4 |
|
Height (cm) |
154.0 ± 3.4 |
|
Weight (kg) |
55.9 ± 4.3 |
|
Body fat (%) |
30.4 ± 2.0 |
|
BMI (kg/m2) |
23.4 ± 1.1 |
|
Brachial SBP (mmHg) |
127.1 ± 5.5 |
|
Ankle SBP (mmHg) |
148.1 ± 7.7 |
|
Heart rate (bpm) |
63.4 ± 2.1 |
|
Fasting blood glucose (mg/dl) |
90.3 ± 3.7 |
|
Muscle mass of the right upper arm (kg) |
1.8 ± 0.2 |
|
Muscle mass of left upper arm (kg) |
1.6 ± 0.2 |
|
Muscle mass of right leg (kg) |
7.0 ± 0.6 |
|
Muscle mass of left leg (kg) |
6.9 ± 0.6 |
Table 1: Subject characteristics
Values are mean ± SD.
BMI, body mass index; SBP, systolic blood pressure.
Study design
Each subject participated in two trials in a cross-over fashion as follows: (i) ingestion of 25 g of glucose solution (GSI trial) and (ii) ingestion of 25 g of palatinose solution (PSI trial). Each subject waited approximately 3 days after completion of one trial before crossing over to the next trial. After fasting for 12 h, subjects visited the laboratory. After resting in the supine position for 10 min, we measured arterial stiffness, brachial and ankle BP, heart rate (HR), and BG levels at baseline (before ingestion) and 30, 60, and 90 min after ingestion (Figure 1). The subjects refrained from consuming alcohol and caffeine and performing exercise for 24 h before testing. They were also asked to keep a log of all consumed foods and to repeat this diet during the second intervention. All measurements were performed at a constant room temperature of 25°C in a quiet room. Changes in lifestyle habits (eating habits, exercise, etc.) were prohibited during the intervention period.
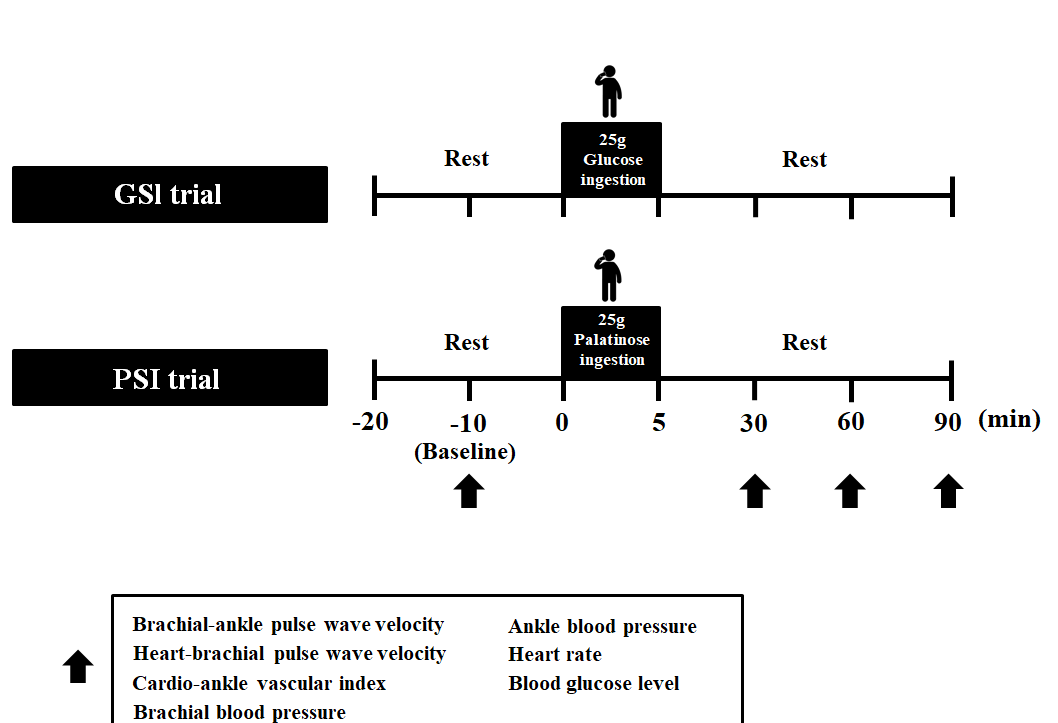
Figure 1: Study design.
We performed two interventions with a cross-over design as follows: (i) ingestion of 25 g of glucose solution (GSI trial) and (ii) ingestion of 25 g of palatinose solution (PSI trial). Each volunteer waited approximately 3 days after completing one trial before crossing over to the next trial. After fasting for 12 h, volunteers visited the laboratory. After resting in the supine position for 10 min, we measured proximal aortic and systemic arterial stiffness, brachial and ankle blood pressure, heart rate (HR), and blood glucose levels at baseline (before ingestion) and 30, 60, and 90 min after ingestion.
Sample size
On the basis of our previous study [5], we performed a power analysis with G*Power 3 to determine the appropriate sample size. As in our previous study, we assumed an effect size for arterial stiffness of 0.5. To detect differences with 80% power and a one-tailed α of 5% using analysis of variance, we calculated that each intervention would require eight individuals. We enrolled 10 participants in the current study.
Body composition
We measured height in units of 0.1 cm using a height gauge and body weight and muscle mass in units of 0.1 kg using a body weight/body composition meter (WB-150 PMA, Tanita, Tokyo, Japan).
Blood pressure and heart rate
Brachial BP and ankle systolic blood pressure (SBP), mean BP (MBP), diastolic BP (DBP), pulse pressure (PP), and HR at rest in the supine position were measured using an automatic oscillometric pulse wave velocity (PWV)/ankle-brachial index device (Omron-Colin, Tokyo, Japan) over the brachial and ankle arteries [15].
Arterial stiffness
In the supine posture, arterial pulse wave velocity (PWV) was measured using a vascular function test device (form PWV/ABI; Colin Medical Technology, Komaki, Japan and VaSera VS-1500AE; Fukuda-Denshi, Tokyo, Japan). In this study, brachial-ankle (ba) PWV and heart-brachial (hb) PWV were measured (Figure 1). For baPWV, we used a blood pressure measurement cuff with a built-in volumetric pressure pulse wave sensor. This cuff was placed around the upper arm and ankle to measure the difference in pulse wave propagation time [15]. For hbPWV, the pulse wave propagation time from the heart to the upper arm was defined as the time difference between the second heart sound and the notch of the brachial artery wave caused by aortic valve closure [16]. baPWV is an index that reflects systemic arterial stiffness and hbPWV reflects aortic arterial stiffness. The cardio-ankle vascular index (CAVI) was automatically calculated from five pulse wave signals using the following formula: CAVI = a [(2ρ/PP) × ln (SBP/DBP) × PWV2] + b, where DBP is diastolic blood pressure, PP is SBP–DBP, ρ is the blood density, and a and b are constants. The CAVI reflects systemic arterial stiffness and is index theoretically adjusted by BP [17].
All measurements were performed while the participants were supine in a quiet room. The daily coefficients of variation were 3 ± 1%, 3 ± 2%, and 3 ± 1% for baPWV, hbPWV, and CAVI, respectively.
Blood glucose
Venous blood was drawn from the subjects’ left fingertip before (baseline) and 30, 60, and 90 min after ingestion of 25 g of glucose or palatinose. BG was measured using the flavin-adenine dinucleotide glucose dehydrogenase method and a Glutest Neo Alpha glucometer (Sanwa Kagaku Kenkyusho, Tokyo, Japan) [18]. The daily coefficient of variation for BG in the laboratory was 3 ± 1%.
Palatinose and glucose ingestion
Each participant orally consumed 25 g of palatinose or 25 g of glucose in 200 ml water within 5 min. The new World Health Organization guideline recommends that adults reduce the daily intake of free sugars to < 25 g [19].
Statistical analysis
All data are shown as mean ± standard deviation (SD). Normality of distribution was assessed with the Shapiro–Wilk test. Data were analyzed using repeated measures two-way analysis of variance (trial × time). Significant differences among means were determined with the Bonferroni post-hoc test. Data were statistically analyzed with IBM SPSS Statistics for Windows v. 25 (IBM, Armonk, NY, USA). P < 0.05 was considered statistically significant.
Results
Figure 2A shows the change (Δ) baPWV before and after ingestion of palatinose and glucose. The ΔbaPWV was signi?cantly increased from baseline at 30, 60, and 90 min (p < 0.01) after ingestion in GSI trial, but not in the PSI trial. The ΔbaPWV was significantly lower at 60 and 90 min (p < 0.05) after ingestion in the PSI trial compared with the GSI trial.
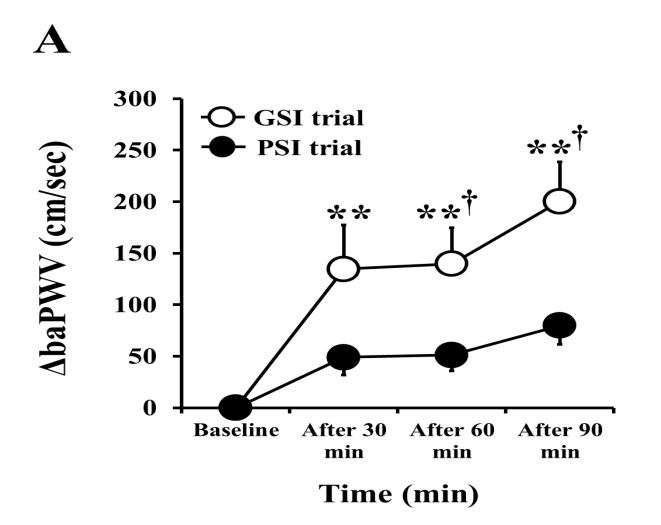
Figure A:
Figure 2B shows the ΔhbPWV before and after ingestion of palatinose and glucose. The ΔhbPWV was signi?cantly increased from baseline at 30, 60, and 90 min (p < 0.01) after ingestion in GSI trial, but not in the PSI trial. The ΔhbPWV was significantly lower at 30, 60, and 90 min (p < 0.01) after ingestion in the PSI trial compared with the GSI trial.
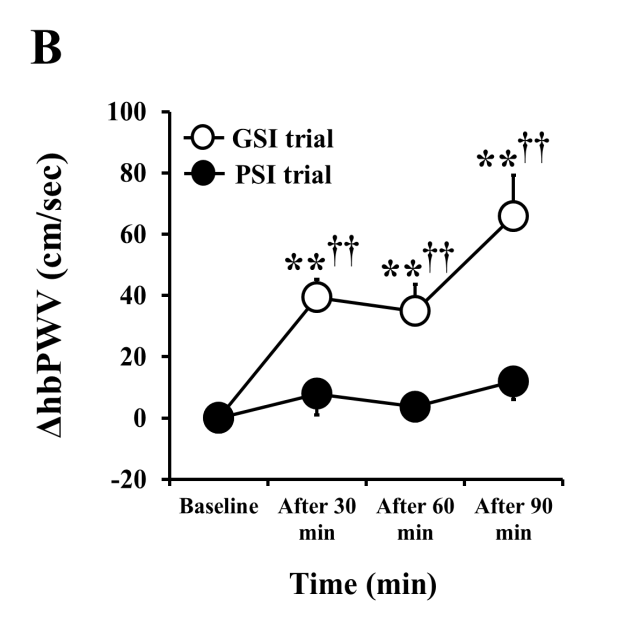
Figure B:
Figure 2C shows the ΔCAVI before and after ingestion of palatinose and glucose. The ΔCAVI was signi?cantly increased from baseline at 30, 60, and 90 min (p < 0.01) after ingestion in the GSI trial, but not in the PSI trial. The ΔCAVI was significantly lower at 30, 60, and 90 min (p < 0.05) after ingestion in the PSI trial compared with the GSI trial.
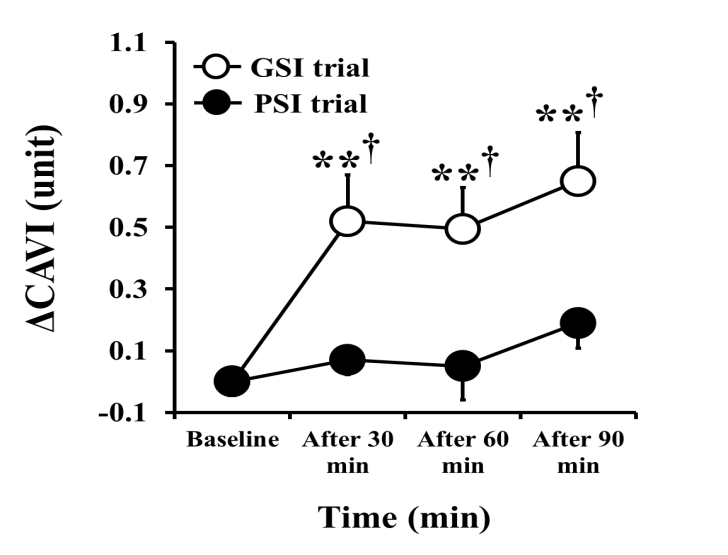
Figure 2: Changes in arterial stiffness after palatinose or glucose ingestion.
baPWV, brachialankle pulse wave velocity; hbPWV, heartbrachial pulse wave velocity; CAVI, cardio-ankle vascular index; GSI, intake of 25 g of glucose solution; ISI, intake of 25 g of palatinose solution.
Values are mean ± SD. **P < 0.01 and *P < 0.05 vs. baseline; ††P < 0.01 and †P < 0.05 vs. the PSI trial.
Table 2 shows baPWV, hbPWV, and the CAVI before and after ingestion of palatinose and glucose. baPWV, hbPWV, and the CAVI were signi?cantly increased from baseline at 30, 60, and 90 min (p < 0.01) after ingestion in the GSI trial, but not in the PSI trial. baPWV and CAVI were not significantly different between trials. hbPWV was significantly lower at 90 min (p < 0.05) after ingestion in the PSI trial compared with the GSI trial.
|
Baseline |
After 30 min |
After 60 min |
After 90 min |
||
|
baPWV (cm/sec) |
GSI trial |
1702.3 ± 149.4 |
1836.9 ± 171.5** |
1841.9 ± 165.3** |
1902.5 ± 168.8** |
|
PSI trial |
1761.1 ± 165.7 |
1808.6 ± 181.3 |
1811.6 ± 177.7 |
1836.0 ± 178.5 |
|
|
hbPWV (cm/sec) |
GSI trial |
551.5 ± 53.7 |
590.9 ± 57.1** |
586.4 ± 69.6** |
617.4 ± 54.1** † |
|
PSI trial |
554.6 ± 42.1 |
562.5 ± 47.3 |
558.2 ± 42.9 |
566.5 ± 48.9 |
|
|
CAVI (unit) |
GSI trial |
8.2 ± 1.0 |
8.7 ± 1.1** |
8.7 ± 1.0** |
8.9 ± 1.1** |
|
PSI trial |
8.3 ± 1.1 |
8.4 ± 1.0 |
8.4 ± 1.2 |
8.5 ± 1.1 |
Table 2: Changes in arterial stiffness after palatinose or glucose ingestion Values are mean ± SD.
baPWV, brachial-ankle pulse wave velocity; hbPWV, heart-brachial pulse wave velocity; CAVI, cardio-ankle vascular index; GSI, intake of 25 g of glucose solution; PSI, intake of 25 g of palatinose solution.
**, p<0.01 vs. baseline; †, p<0.05 vs. PSI trial.
Table 3 shows brachial and ankle BP, and HR before and after ingestion of palatinose and glucose. Brachial SBP and MBP were signi?cantly increased from baseline at 90 min (p < 0.05) after ingestion in the GSI trial, but not in the PSI trial. Ankle SBP was signi?cantly increased from baseline at 30, 60, and 90 min (p < 0.01) after ingestion in the GSI trial, but not in the PSI trial. Ankle MBP was signi?cantly increased from baseline at 60 and 90 min (p < 0.01) after ingestion in the GSI trial, but not in the PSI trial. Ankle PP was signi?cantly increased from baseline at 30 (p < 0.01), 60 (p < 0.05), and 90 min (p < 0.05) after ingestion in the GSI trial, but not in the PSI trial. Brachial DBP and PP, ankle DBP, and HR did not change from baseline at 30, 60, and 90 min after ingestion in both trials. Brachial and ankle SBP, MBP, DBP, and PP, and HR did not differ between trials.
|
Baseline |
After 30 min |
After 60 min |
After 90 min |
||
|
Brachial SBP (mmHg) |
GSI trial |
120.5 ± 3.6 |
125.2 ± 5.8 |
131.9 ± 5.4 |
131.6 ± 4.7* |
|
PSI trial |
125.6 ± 3.6 |
127.1 ± 5.0 |
126.2 ± 4.9 |
124.0 ± 4.2 |
|
|
Brachial MBP (mmHg) |
GSI trial |
91.2 ± 3.6 |
92.6 ± 5.7 |
97.0 ± 5.2 |
98.8 ± 5.5* |
|
PSI trial |
89.0 ± 3.1 |
90.8 ± 4.7 |
95.5 ± 4.4 |
96.2 ± 4.3 |
|
|
Brachial DBP (mmHg) |
GSI trial |
73.3 ± 3.2 |
73.6 ± 4.3 |
77.3 ± 4.3 |
78.5 ± 4.6 |
|
PSI trial |
73.7 ± 3.2 |
74.3 ± 4.4 |
76.0 ± 4.5 |
77.9 ± 4.4 |
|
|
Brachial PP (mmHg) |
GSI trial |
47.2 ± 2.7 |
51.6 ± 4.3 |
54.6 ± 3.5 |
53.1 ± 3.4 |
|
PSI trial |
51.9 ± 3.6 |
52.8 ± 3.5 |
50.2 ± 4.3 |
46.1 ± 5.0 |
|
|
Ankle SBP (mmHg) |
GSI trial |
148.1 ± 7.7 |
161.0 ± 9.7** |
161.4 ± 7.8** |
164.4 ± 8.3** |
|
PSI trial |
154.4 ± 8.3 |
156.6 ± 8.8 |
156.6 ± 8.6 |
159.6 ± 8.9 |
|
|
Ankle MBP (mmHg) |
GSI trial |
97.6 ± 4.6 |
102.4 ± 6.1 |
104.6 ± 5.3** |
107.3 ± 5.0** |
|
PSI trial |
101.5 ± 5.4 |
102.7 ± 5.3 |
102.5 ± 5.2 |
104.2 ± 5.9 |
|
|
Ankle DBP (mmHg) |
GSI trial |
72.4 ± 3.4 |
73.8 ± 4.4 |
76.2 ± 4.2 |
78.7 ± 3.8* |
|
PSI trial |
75.0 ± 4.2 |
75.8 ± 3.7 |
75.5 ± 4.1 |
76.5 ± 4.8 |
|
|
Ankle PP (mmHg) |
GSI trial |
75.7 ± 5.5 |
87.2 ± 5.3** |
85.2 ± 4.6* |
85.7 ± 5.8* |
|
PSI trial |
79.4 ± 5.3 |
80.8 ± 5.6 |
81.1 ± 6.3 |
83.1 ± 5.4 |
|
|
Heart rate (beats/min) |
GSI trial |
63.4 ± 2.1 |
65.1 ± 2.6 |
63.5 ± 2.1 |
63.1 ± 2.2 |
|
PSI trial |
63.1 ± 2.3 |
62.3 ± 2.4 |
62.8 ± 2.0 |
62.7 ± 2.1 |
Table 3: Blood pressure and heart rate after palatinose or glucose ingestion
Values are mean ± SD.
SBP, systolic blood pressure; MBP, mean blood pressure; DBP, diastolic blood pressure; PP, pulse pressure; GSI, intake of 25 g of glucose solution; PSI, intake of 25 g of palatinose solution.
*, p<0.05 and **, p<0.01 vs. baseline.
Table 4 shows BG levels before and after ingestion of palatinose and glucose. BG levels signi?cantly increased from baseline at 30 (p < 0.01), 60 (p < 0.01), and 90 min (p < 0.05) after ingestion in the GSI trial. BG was signi?cantly increased from baseline at 30 (p < 0.01) and 60 min (p < 0.05) after ingestion in the PSI trial. BG levels were significantly lower at 30 and 60 min (p < 0.01) after ingestion in the PSI trial compared with the GSI trial.
|
Baseline |
After 30 min |
After 60 min |
After 90 min |
||
|
Blood glucose (mg/dl) |
GSI trial |
94.6 ± 4.3 |
168.0 ± 9.9** †† |
163.7 ± 8.8** †† |
122.5 ± 12.2* |
|
PSI trial |
92.0 ± 2.1 |
124.1 ± 5.0** |
117.4 ± 6.2* |
109.2 ± 4.9 |
Table 4: Blood glucose after palatinose or glucose ingestion
Values are mean ± SD.
GSI, intake of 25 g of glucose solution; PSI, intake of 25 g of isomaltulose solution.
*, p<0.05 and **, p<0.01 vs. baseline. ††, p<0.01 vs. PSI trial.
Discussion
The main novel finding of this study was that baPWV, hbPWV and CAVI were lower after ingestion in the PSI trial than in the GSI trial. These results suggest that transient palatinose intake in older people consumes calories, while suppressing an increase in arterial stiffness.
Postprandial hyperglycemia is a risk factor for cardiovascular disease [20]. Therefore, to prevent cardiovascular disease, the postprandial hyperglycemia needs to be suppressed. A previous study on 10 healthy individuals showed that BG levels after consumption of palatinose led to a slow increase in BG levels after consumption [12]. Our results are consistent with these findings. Therefore, BG levels might not rapidly rise after palatinose ingestion. Consequently, palatinose might be able to moderate the postprandial rise in BG levels compared with other carbohydrates.
Arterial stiffness increases after postprandial hyperglycemia. A previous study, showed that arterial stiffness was elevated after ingestion of sugary foods [21], which is consistent with our findings. We found that the arterial stiffness including the proximal aorta was signi?cantly increased from baseline at 30, 60, and 90 min after ingestion in the GSI trial, but not in the PSI trial. Therefore, palatinose ingestion might be preferable to glucose ingestion, presumably to suppress the increase in arterial stiffness. Diabetes induces peripheral artery disease in all extremities [22], and peripheral arterial stiffness is elevated after glucose ingestion [23]. Previous studies have reported that peripheral arterial stiffness may increase after postprandial hyperglycemia [24]. Therefore, in this situation, it may need to consider systemic arterial stiffness, including peripheral arterial stiffness as well as the aorta. SBP is associated with arterial stiffness [25]. In our study, peripheral SBP and systemic arterial stiffness was signi?cantly increased from baseline at 30, 60, and 90 min after ingestion in the GSI trial, but not in the PSI trial. Therefore, palatinose may be a sugar that suppresses the increase in arterial stiffness associated with elevated SBP after other sugar intakes.
Although the purpose of this study was not to examine the mechanism in which arterial stiffness did not increase after palatinose ingestion involved, we can suggest some hypotheses. We observed an increase in arterial stiffness after glucose ingestion. CAVI is not affected by SBP [26]. Increased CAVI may be due to a decrease in nitric oxide (NO) [27]. Jacome-Sosa et al. [8] stated that “postprandial hyperglycemia is likely to reduce NO bioavailability by limiting arginine availability and increasing asymmetric dimethyl arginine (ADMA) relative to arginine, which is expected to limit substrate availability for NO biosynthesis while competitively inhibiting endothelial NO synthase (eNOS)”. Mah et al. (22) found that after glucose ingestion, vascular endothelial function was decreased, and blood glucose and malondialdehyde levels were increased, but there was no change after ingestion of fructose. Endothelial function is correlated with CAVI [28, 29]. Therefore, the increase in arterial stiffness after glucose ingestion might be related to a decrease in NO production. Future studies to measure NO are required.
In the future, if palatinose is used as a sweetener for cooking, small amount of palatinose may ingest carbohydrates as an energy source and prevent and improve arterial stiffness due to hyperglycemia. Intervention studies are required to determine whether a diet containing small amount of palatinose reduces arterial stiffness.
Limitations of the study
Our study has some limitations. The sample size was small, which limits generalization of our findings. The results of this study cannot be generalized to healthy young people. Additionally, we did not measure changes in glucagon, insulin, growth hormone, and other vasoactive biomarkers, as well as endothelial function, which have important effects on arterial stiffness.
Conclusion
The ΔbaPWV, ΔhbPWV, and ΔCAVI are signi?cantly elevated at 30, 60, and 90 min compared with baseline after ingestion of glucose, but not palatinose. The ΔbaPWV, ΔhbPWV, and ΔCAVI are significantly lower after palatinose intake compared with after glucose intake. Our results suggest that arterial stiffness increases after glucose ingestion, but not after small amount of palatinose intake.
Acknowledgments
We thank all subjects of this study and their team staff. We thank Ellen Knapp, PhD, from Edanz Group (www.edanzediting.com/ac) for editing a draft of this manuscript.
Sources of funding
This work was supported by a research funding from Mitsui Sugar Co., Ltd.
Compliance with ethical standards
Conflict of interest
The authors declare that they have no confict of interest.
Statement of human and animal rights
The present study was in accordance with the declaration of Helsinki and approved by the institutional review board of the Teikyo University of Science (18096), Japan.
Informed consent
Written informed consents were obtained from all participants.
References
- Tsuchikura S, Shoji T, Kimoto E, et al. Central versus peripheral arterial stiffness in association with coronary, cerebral and peripheral arterial disease. Atherosclerosis 211 (2010): 480-485.
- Ninomiya T, Kojima I, Doi Y, et al. Brachial-ankle pulse wave velocity predicts the development of cardiovascular disease in a general Japanese population: the Hisayama Study. J Hypertens 31 (2013): 477-83.
- Vlachopoulos C, Aznaouridis K, O'Rourke MF, et al. Prediction of cardiovascular events and all-cause mortality with central haemodynamics: a systematic review and meta-analysis. Eur Heart J 31 (2010): 1865-1871.
- Jahn LA, Hartline L, Rao N, et al. Insulin Enhances Endothelial Function Throughout the Arterial Tree in Healthy But Not Metabolic Syndrome Subjects. J Clin Endocrinol Metab 101 (2016): 1198-1206.
- Kobayashi R, Sato K, Takahashi T, et al. Arterial stiffness during hyperglycemia in older adults with high physical activity versus low physical activity. J Clin Biochem Nutr 19 (2019): 1-7.
- Iozzo P, Beck-Nielsen H, Laakso M, et al. Independent influence of age on basal insulin secretion in nondiabetic humans. European Group for the Study of Insulin Resistance. J Clin Endocrinol Metab 84 (1999): 863-888.
- Fu S, Chen W, Luo L, Ye P. Roles of fasting and postprandial blood glucose in the effect of type 2 diabetes on central arterial stiffness: a 5-year prospective community-based analysis. Diabetol Metab Syndr 9 (2017): 33.
- Jacome-Sosa M, Parks EJ, Bruno RS, et al. Postprandial Metabolism of Macronutrients and Cardiometabolic Risk: Recent Developments, Emerging Concepts, and Future Directions. Adv Nutr 7 (2016): 364-374.
- Seidelmann SB, Claggett B, Cheng S, et al. Dietary carbohydrate intake and mortality: a prospective cohort study and meta-analysis. Lancet Public Health 3 (2018): e419-e28.
- Prinz P. The role of dietary sugars in health: molecular composition or just calories? Eur J Clin Nutr 73 (2019): 1216-1223.
- Low NH, Nelson DL, Sporns P. Carbohydrate Analysis of Western Canadian Honeys and their Nectar Sources to Determine the Origin of Honey Oligosaccharides. J Apic Res 27 (1988): 245-251.
- Kawai K, Yoshikawa H, Murayama Y, et al. Usefulness of palatinose as a caloric sweetener for diabetic patients. Horm Metab Res 21 (1989): 338-340.
- Kawai K, Okuda Y, Yamashita K. Changes in blood glucose and insulin after an oral palatinose administration in normal subjects. Endocrinol Jpn 32 (1985): 933-936.
- Hayashi K, Miyachi M, Seno N, et al. Variations in carotid arterial compliance during the menstrual cycle in young women. Exp Physiol 91 (2006): 465-472.
- Okamoto T, Masuhara M, Ikuta K. Combined aerobic and resistance training and vascular function: effect of aerobic exercise before and after resistance training. J Appl Physiol 103 (1985): 1655-1661.
- Sugawara J, Tomoto T, Tanaka H. Arterial path length estimation for heart-to-brachium pulse wave velocity. Hypertens Res 41 (2018): 444-450.
- Nishiwaki M, Takahara K, Matsumoto N. Arterial stiffness in young adult swimmers. Eur J Appl Physiol 117 (2017): 131-138.
- Algov I, Grushka J, Zarivach R, et al. Highly Efficient Flavin-Adenine Dinucleotide Glucose Dehydrogenase Fused to a Minimal Cytochrome C Domain. J Am Chem Soc 139 (2017): 17217-17220.
- World Health Organization (2015) Guideline: Sugars Intake for Adults and Children. Geneva: World Health Organization.
- Sorkin JD, Muller DC, Fleg JL, et al. The relation of fasting and 2-h postchallenge plasma glucose concentrations to mortality: data from the Baltimore Longitudinal Study of Aging with a critical review of the literature. Diabetes care 28 (2005): 2626-2632.
- Baynard T, Carhart RL, Jr., Weinstock RS, et al. Short-term exercise training improves aerobic capacity with no change in arterial function in obesity. Eur J Appl Physiol 107 (2009): 299-308.
- Yokoyama H, Shoji T, Kimoto E, et al. Pulse wave velocity in lower-limb arteries among diabetic patients with peripheral arterial disease. J Atheroscler Thromb 10 (2003): 253-258.
- Kobayashi R, Yoshida S, Okamoto T. Arterial stiffness after glucose ingestion in exercise-trained versus untrained men. Appl Physiol Nutr Metab 40 (2015): 1151-1156.
- Tucker WJ, Sawyer BJ, Jarrett CL, et al. High-intensity interval exercise attenuates but does not eliminate endothelial dysfunction after a fast food meal. Am J Physiol Heart Circ Physiol 314 (2018): H188-H194.
- Coutinho T, Bailey KR, Turner ST, et al. Arterial stiffness is associated with increase in blood pressure over time in treated hypertensives. J Am Soc Hypertens 8 (2014): 414-421.
- Miyoshi T, Ito H. Assessment of Arterial Stiffness Using the Cardio-Ankle Vascular Index. Pulse 4 (2016): 11-23.
- Sugawara J, Komine H, Hayashi K, et al. Effect of systemic nitric oxide synthase inhibition on arterial stiffness in humans. Hypertens Res 30 (2007): 411-415.
- Jadhav UM, Kadam NN. Non-invasive assessment of arterial stiffness by pulse-wave velocity correlates with endothelial dysfunction. Indian Heart J 57 (2005): 226-232.
- Inaba H, Takeshita K, Uchida Y, et al. Recovery of flow-mediated vasodilatation after repetitive measurements is involved in early vascular impairment: comparison with indices of vascular tone. PloS one 9 (2014): e83977.