Franziska Metge1#, Robert Sehlke1, 2, 3, #, Ayesha Iqbal1, Jorge Boucas1*
1Bioinformatics, Max Planck Institute for Biology of Ageing, Cologne, 50931, Germany
2Biological Mechanisms of Ageing, Max Planck Institute for Biology of Ageing, Cologne, 50931, Germany
3Cellular Networks and Systems Biology, CECAD, University of Cologne, 50931 Cologne, Germany
# - These authors have equally contributed to this work.
*Corresponding author: Jorge Boucas, Bioinformatics, Max Planck Institute for Biology of Ageing, Cologne, 50931, Germany.
Received: 03 February 2022; Accepted: 15 February 2022; Published: 04 March 2022
Summary: AGEpy is a Python package focused on the transformation of interpretable data into biological meaning. It is designed to support high-throughput analysis of pre-processed biological data using either local Python based processing or Python based API calls to local or remote servers. In this application note we describe its different Python modules as well as its command line accessible tools aDiff, abed, blasto, david, and obo2tsv.
Cytoscape; Diomart; Data interpretation; Data handling; Data visualization; David; Fasta; Gene ontology; Kegg; Gtf
1. Introduction
The generation of meaning from data has become a central topic in biological research. Many tools have therefore emerged for the transformation of raw data into interpretable values in the same way that others have emerged for the generation of biological meaning from such interpretable values. While the firsts are often based on a programmatic use - eg. RNAseq analysis tools like Cuffdiff [1] or DEseq2 [2] - the latests tend to be Graphical User Interface (GUI) based and have more recently evolved to provide access through an Application Programming Interface (API) - eg. KEGG [3] and DAVID [4]. API access has emerged as a reflection of the growing need to massively process data with tools initially designed for manual analysis through GUIs. APIs offer a way to democratize computational tools with a client side server-less solution. Here we introduce AGEpy, a Python package for the automation of data analysis at the data-to meaning interface. It uses standard data science dependencies like pandas [5], numpy [6], and matplotlib [7]; bionformatics tools like pybedtools [8]; and APIs requests to DAVID, blast [9, 10], cytoscape [11] and others. Defaults are set for research focused on the biology of ageing using Caenorhabditis elegans, Drosophila melanogaster, Mus musculus, and Homo sapiens. AGEpy provides command line executables for downstream analysis of differential gene expression results output by Cuffdiff [1] - aDiff - annotation of bed files - abed - online blast queries - blasto - DAVID queries - david - as well as parsing of gene ontology obo files into tsv - obo2tsv.
2. Approach
2.1. Modules
We have divided AGEpy functions across 13 different modules with most functions making use of standard Python structures as well as data science ones, eg.: numpy arrays and pandas dataframes: bed.py, blast.py, cytoscape.py, david.py, fasta.py, go.py, gtf.py, homology.py, kegg.py, meme.py, sam.py. Of note, biom.py (biomart), cytoscape.py, david.py, and kegg.py make use of the respective service’s APIs. homology.py collects homology information from NCBI’s homologene - https://www.ncbi.nlm.nih.gov/homologene - to generate homology tables. Plots. py introduces two visualization plots for enrichment analysis (Figure 1 and 2).
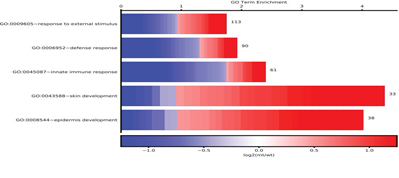
Figure 1: Cellplot. A representation of enriched go terms. Enrichment of top 5 significant terms is plotted on the x-axis. For each term the number of genes is shown as well as the log2(fold change) of each respective gene.
Figure 2: Symplot. A representation of changed genes within an enriched term. Top 20 enriched terms are shown. The size of the central bars is directly proportional to the number of genes in the query belonging to the respective term and the enrichment value is reflected by the color of the bar. Percentage of down and upregulated genes in each term is shown.
2.2 Executable
2.2.1 aDiff
aDiff is an annotation and mining tool for differential expression results generated with Cuffdiff [1] - differential gene expression, differential isoforms expression, differential promoter usage, differential splicing, and differential cds. It starts by mapping Cuffdiff’s self-generated artificial gene/transcript ids to gene/transcript ids in a provided ensembl reference genome annotation (as provided to Cuffmerge). Using ensembl gene ids, it collects biotype and gene ontology information from ensembl’s biomart [12] server as well as KEGG annotations through the KEGG API [3] for each respective gene. A report of these annotated tables can be obtained in both tsv or excel format. After discarding non-significant values (as defined in Cuffdiff) it generates one report sheet for each pair-wise comparison. Each respective list of significant genes/transcripts is used to query ”The Database for Annotation, Visualization and Integrated Discovery (DAVID)” [4] for enrichment in user defined categories (default: go term bp fat, go term cc fat, got term mf fat, kegg pathway, pfam, prosite, genetic association db disease, omim disease). Protein protein interaction networks are assembled through the STRING Cytoscape app [13] using cytoscape’s REST API running locally or remotely. An example of an aDiff output from the raw data provided by [1] can be downloaded from the project's wiki - https://github.com/mpg-age-bioinformatics/AGEpy/wiki.
2.2.2 abed
abed annotates bed files with overlapped gene names, gene ids, and other defined features (eg. promoter, exon, UTR).
2.2.3 blasto
blasto uses the blast.py module to query remote blast servers through their respective REST API’s. For complex queries with multifasta files where different arguments are required for the different fasta entries, arguments can be given in the respective sequence names. Tabular results as well as html can be saved locally.
2.2.4 david
david uses part of the david.py module to query DAVID through its REST API with user provided gene lists in a tabular format. Given a second column with log2 (fold change) it will use the CellPlot and SymPlot functions from the plots.py module to display the respective plots (Figure 1 and 2). As an option DAVID queries can be performed against a user provided list of background genes.
2.2.5 obo2tsv
obo2tsv takes annotation files (in obo format) from the gene ontology consortium [14, 15] as input and converts them into a tsv formatted file with parent and child term information included. Given a gene association file, for a selected organism, the generated tabular gene ontology annotation will be merged with the respective organism data. Input can either be local or URLs to the respective files.
3. Conclusion
AGEpy provides Python support for computational biology. Use cases for several of its functions have recently been published [16] and can be further experienced with its provided executables. With most default arguments set for research on the biology of ageing using worm, fly, mouse or human data it can be useful for the interpretation of ageing research data on both small and large scales. AGEpy modules come with extensive documentation (available under the package’s docs folder and at http://agepy.readthedocs.io). The open source AGEpy Python package is freely available at https://github.com/mpg-age-bioinformatics/AGEpy.
Acknowledgements
We acknowledge all the current and past members of the Bioinformatics Core Facility of the Max Planck Institute for Biology of Ageing.
Funding
This work has been supported by the Max Planck Institute for Biology of Ageing (F.M., A.I., J.B.) and the Cologne Graduate School of Ageing Research (R.S.).
References
- Trapnell C, Roberts A, Goff L, et al. Differential gene and transcript expression analysis of RNA-seq experiments with TopHat and Cufflinks. Nature protocols 7 (2012) 562-578.
- Love MI, Huber W, Anders S. Moderated estimation of fold change and dispersion for RNA-seq data with DESeq2. Genome biology, 15 (2014): 550.
- Kanehisa M, Furumichi M, Tanabe M, et al. KEGG: new perspectives on genomes, pathways, diseases and drugs. Nucleic acids research 45 (2017): 353-361.
- Jiao X, Sherman BT, Huang DW, et al. DAVID-WS: a stateful web service to facilitate gene/protein list analysis. Bioinformatics (Oxford, England) 28 (2012): 1805-1806.
- Data Structures for Statistical Computing in Python. In Proc. of the 9th Python in Science Conf., pages (2010): 51-56.
- van der Walt S, Colbert SC, Varoquaux G. The NumPy array: a structure for efficient numerical computation. Computing in Science & Engineering 13 (2011): 22–30.
- Hunter JD. Matplotlib: A 2D Graphics Environment. Computing in Science & Engineering, 9 (2007): 90-95.
- Dale RK, Pedersen BS, Quinlan AR. Pybedtools: a flexible Python library for manipulating genomic datasets and annotations. Bioinformatics (Oxford, England) 27 (2011): 3423-3424.
- Camacho C, Coulouris G, Avagyan V, et al. BLAST+: architecture and applications. BMC bioinformatics 10 (2009): 421.
- NCBI Resource Coordinators. Database resources of the National Center for Biotechnology Information. Nucleic acids research, 41 (2013): 8-20.
- Shannon P, Markiel A, Ozier O, et al. Cytoscape: a software environment for integrated models of biomolecular interaction networks. Genome research 13 (2003): 2498-2504.
- Smedley D, Haider S, Durinck S, et al. The BioMart community portal: an innovative alternative to large, centralized data repositories. Nucleic acids research 43 (2015): 589-598.
- Szklarczyk D, Morris JH, Cook H, et al. The STRING database in 2017: quality-controlled protein–protein association networks, made broadly accessible. Nucleic Acids Research, 45 (2017): 362-368.
- Ashburner M, Ball CA, Blake JA, et al. Gene Ontology: tool for the unification of biology. Nature Genetics 25 (2000) 25-29.
- The Gene Ontology Consortium (2017). Expansion of the Gene Ontology knowledgebase and resources. Nucleic acids research, 45(D1), gkw1108+.
- Boucas, J. Integration of ENCODE RNAseq and eCLIP Data Sets. Methods in molecular biology (Clifton, N.J.) 1720 (2018): 111-129.