Njehu JM1 *, Wabuyele Emily2, Mutune AN2
1Kenya Forestry Research Institute (KEFRI), Nairobi, Kenya
2Department of Plant Sciences, Kenyatta University, Nairobi, Kenya
*Corresponding Author: Jane Njehu, Kenya Forestry Research Institute (KEFRI), Nairobi, Kenya
Received: 30 August 2022; Accepted: 22 September 2022; Published: 26 September 2022
This study was conducted to evaluate the population status of Melia volkensii and the diversity of tree species in Kasaala Location in Kitui County. Subsequently assessing the natural regeneration of M. volkensii and thus promote its propagation and conservation in the dry lands of Kenya. Plant population was determined in situ across seven transect lines measuring 1050 meters in length. Sampling was carried out in five plots measuring 50 × 50 meters established at intervals of 1,000 meters. Transect 1 and 7 were laid in farmland while the transects between these two were laid in bushland. All tree species represented in each plot were counted. Height and diameter at breast height (DBH) were measured for all M. volkensii trees within the plots. Melia volkensii seedlings and coppices were counted in 5 × 5 meter nested plots within the larger plots. One-way analysis of variance (ANOVA) at 95% confidence interval was used to test for variance in parameters measured and means separated using Tukey’s HSD. There were significant differences in mean number of height and DBH of M. volkensii that were found in transect one and two. Transect 2 had the lowest mean height and DBH while the tallest trees were in the other transects. Tukey honestly significant difference (HSD test) was used to test separation of means (of mature trees and coppices of M. volkensii). There were no significant differences between the mean number of coppices and seedlings found in transect two and four. Moreover, relative abundance, species richness and diversity of plant species observed were analyzed using Simpson’s index of biodiversity and Shannon-Wiener species diversity index. Melia volkensii was the most frequently occurring species with 12.2% (n=67) followed by Acacia tortilis10.0% (n=55). Calotropis strophela, Commiphora capensis, Maerua crassifolia were the least represented relative abundance of 0.18%. Values of indice
Melia volkensii; Population status; Sampling; Tree species, Seedlings; Coppices and relative abundance
Melia volkensii articles; Population status articles; Sampling articles; Tree species articles, Seedlings articles; Coppices articles, relative abundance articles
1. Introduction
Melia volkensii Gürke is an indigenous tree species that grows naturally in the arid and semi-Arid lands (ASALs) of East Africa. There has been overexploitation of this tree and there are dangers of rapid decline in its population and genetic diversity. The genus Melia belongs to family Meliaceae (mahogany family) and has eight species, most of which are indigenous to Asia and Australia. Out of the eight species, only Melia volkensii is native to East Africa [1]. This species is known to shed leaves at a particular season; mostly it grows up to 6-20 meters tall. It is described as being open crowned and laxly branched with distribution extending from the dry lands of Ethiopia to Somalia, through Eastern Kenya down to Tanzania [2]. Melia volkensii is commonly found in areas which have dry and wooded grassland, that lie between 400 and 1600 meters above sea level. The tree develops lateral branches which are usually pruned to maintain a clean bole that is not crooked. The bark is grey and smooth. The bright green leaves are compound and have a length of 35 cm long; they have 3 to 7 deeply lobed leaflets. The flowers are white and small sized while the fruit is drupe-like about 4 cm long [3].
The economic importance of M. volkensii includes its use for timber, firewood, fodder, herbal medicine and pesticides. Overexploitation of the species for these products causes overall deterioration of the environment. In recent times, over-harvesting has led to depletion of valuable tree species which are known to have decreased rate of rising new off springs [4]. In the recent past, M. volkensii is known as an agroforestry tree, researchers, farmers, agricultural extension and education officers have found it to be a tree of high economic value, though it has difficulties in seed germination. Current dissemination programmes on M. volkensii have to utilize plants propagated from stem cuttings and roots, rather than seedlings [5]. The study on natural regeneration and assessment of the population of M. volkensii is vital in informing on how trees can survive in a site after range of events cause change in the structure and composition of a forest ecosystem. According to Nieuwenhuis and Egan [6], natural regeneration can be defined as establishment of a new forest from the seeds that have been sown, coppice shoots, or root suckers. Coppices arise sporadically on the stump of a tree that was cut previously Sprouting by seedlings can be termed as part of the regeneration niche. Majority of the ecosystems are dominated by woody plants that have re-sprouted and continue to exist in situ through disturbance events such as wind, fire, flooding, storms and anthropogenic activity. When leaves of trees fall and decompose, they produce a favorable habitat for seeds to sprout consequently increasing the number of seedlings [7].
Natural regeneration upgrades the sustainability of natural forest ecology as it entails the silvicultural practice of treating forests as an ecological system performing multiple functions [8]. Natural regeneration activates the establishment and growth of indigenous species. This leads to bringing stability, flexibility and diversification of forest ecosystems [9]. Natural regeneration is accelerated by disturbances because patterns of regeneration rely greatly on interactions between disturbance systems [10]. Elevated intensity of disturbances that are caused by humans adversely affects species abundance, diversification and regeneration in general [11].
In Eastern Africa, trees and shrubs, often growing inside or neighboring protected areas, provide many products and services to the local community. These high anthropogenic pressures affect the population dynamics of trees negatively by eliminating their natural regeneration and the removal of mature trees [12]. There is currently much interest in understanding how loss of biodiversity might alter ecological processes vital to the functioning of ecosystems [13,14]. The diversity and distribution of trees, shrubs and lianas in dry forest communities appear to be influenced by forest stature and site disturbance levels. In the light of the extent of the diversity of these plants, the need for forest conservation, involving local community, is emphasized [15]. The study of plant population structure and association will contribute to development of comprehensive and effective conservation strategies of M. volkensii in the ASALS of Kenya. It is therefore important to understand the population status of M. volkensii in order to inform whether there is high erosion of their population and genetic diversity. Findings from this study will help improve the production of M. volkensii and thus promote its propagation and conservation. Investigation on population status and plant species diversity of associated tree species will provide information about environmental heterogeneity, patterns of seed dispersal and population status of M. volkensii. This study will promote the propagation and conservation of M. volkensii and associated tree species in the dry lands of Kenya.
1.1 Objectives of the study
- To evaluate the population status of Melia volkensii in Kasaala Location in Kitui County
- To assess the diversity and the relative abundance of volkensii and associated species in the study area
- To assess natural regeneration of volkensii and thus promote its propagation and conservation in the dry lands of Kenya
1.2 Significance of the study
Rise in population, land cultivation, economics and urbanization are the conceivable determinants of deforestation in the countries in East Africa like Kenya, Uganda, Tanzania and Ethiopia [16]. Moreover, research on evenness of distribution and the population status of M. volkensii will inform on conservation of genes and the environmental diversification of M. volkensii. Improved propagation of M. volkensii for Kenya’s ASALs will place Kenya a notch higher in its efforts to increase its forest cover now standing at 7% compared to the recommended 10% [17]. Findings from this research will help improve the growth of Melia leading to the improvement of propagation of this tree species. Overall, the study will be a huge milestone in attaining environmental sustainability particularly in improving the conservation strategies of M. volkensii in the dry lands of Kenya.
2. Materials and Methods
2.1 Study area
Field studies were undertaken in Kasaala Location in Ikutha Sub-County of Kitui South constituency about 440 km from Kenya’s capital city Nairobi, and approximately 21 km from Tsavo East National Park (Figure 1). Kasaala is known for Melia volkensii trees that naturally occur unlike many other areas in Kitui County where the trees are planted. Natural regeneration of M. volkensii is likely to occur in Kasaala because most land area is undisturbed. The soils of the study area consist of metamorphic parent material and the dominant soil groups are alfisols, ultisols, oxisols, and lithic soils. These soils are highly erodible and are of low fertility. The ultisols and alfisols are also susceptible to capping, which increases runoff and makes the clay soils hard to cultivate by the end of the dry season [18]. Approximately, less than 20% of Kitui County has well-drained, deep, friable red and brown clays of good fertility. More than 60% of the region has relatively shallow, sticky, red, black, and brown clays of variable fertility [19].
The study area, Kitui County, shares a similar geographical and vegetation structure with the Tsavo East National park. This environment also favors the growth of naturally growing M. volkensii being adapted to the dry weather conditions [20]. Kitui County has a steep topography with unpredictable irregular rainfall and has an altitude between 400 m to 1830 m above sea level [19]. The average annual rainfall is between 500-900 mm which has a bi-modal pattern though poorly distributed and erratic. The County is mostly dry and hot with temperatures ranging between 14°C during the coldest months (July-August) and 34°C during the hottest months (January-March). The most widespread vegetation type in Kitui, is a thicket and bushland, especially Acacia-Commiphora associations [21].
2.1.1 Population and livelihood activities in Kitui County
Agriculture contributes more than 80% of the income generated by the remote population and directly hires more than 35% of the population in Kitui County. More than 80% of the population is engaged in farming activities especially in the production of crops such as cereals, horticultural and industrial crops [22]. The average production of horticultural crops is approximately 36,950 Mt; at a cost of nine hundred and ninety million [23]. Rearing livestock is also a major economic activity in Kitui County [24]. A household relies on livestock for food security and for economic production. The major components of livestock in Kitui County include indigenous goats, cows, fowl, and donkeys. The farmers prefer these animals because they are resilient to the hot and dry climatic conditions that occur during drought. Of the total farming households, more than 40% rear indigenous cattle and approximately 70% raise chicken and goats [25]. More than 40% of households raise donkeys which are used as a means of transport especially when fetching water across long distances during dry seasons. Donkeys are sometimes included in dowry negotiations [23]. Annual production of honey in the County is 960 tonnes with 14% of households engaged in the enterprise [26,27].
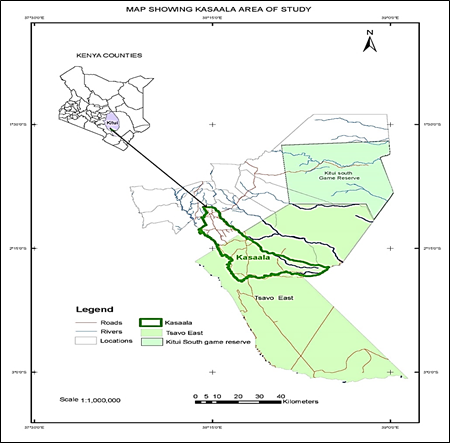
Figure 1: Map showing Kasaala Location of Kitui County.
2.2 Research design
2.2.1 Establishment of sampling plots for study of population status of M. volkensii and associated species in Kasaala location
Plant sampling was done using a stratified design; this is a sampling method which encompasses the population division into minor sub-groups called strata. The entire population of trees was distributed into two different sites namely bushland and farmland. A bushland can be defined as an area covered with shrubs and trees or any other natural vegetation while a farmland is a land used for farming [28]. The bushland in the study area consisted of a secondary vegetation of Acacia-Commiphora while the farmland was used for production of sorghum, cowpeas, maize and pigeon peas which were intercropped with M. volkensii. Broad vegetation formations of the study area consist of natural and manmade features. The natural features include seasonal rivers and valleys, while the man-made features include dams, urban settlements and roads. Seven transects were established to cover the whole forest using guidelines by Plumptre [29]. Transects 1 and 7 were laid on the disturbed sites where farming, grazing and cutting down of trees was rampant in search of timber and fuel. Transects 2,3,4,5 and 6 were laid on the bushland where natural regeneration was taking place. Along each transect, 5 plots were established by using a geographic coordinate system to locate latitude and longitude of the study area. The number of trees, coppices and seedlings that were found along the length of the line and inside the plots were counted and recorded in data sheets.
2.2.2 Sampling of M. volkensii and associated tree species
Fifty by fifty-meter plots were established across transects measuring 1050 meters. Five plots were put in each transect at a range of 1,000 meters space between each plot [30]. All the trees of M. volkensii and associated tree species were sampled within the plots. Diameter at breast height (DBH) and height of M. volkensii trees were determined in each plot. A diameter tape was used to determine DBH at 1.5 meters from the ground. Suunto clinometre was adopted in measuring the tree height from the base of the tree and a linear tape was used to measure 20 meters away from the tree. A nail was fixed on the tree’s bark where the linear tape was hooked and placed horizontally from the eye to the tree. The linear tape and the clinometre were held by both hands and the bottom measurement of the clinometre was subtracted from the top reading. Additionally, coppices and mature trees were sampled within a fifty by fifty meters plot, while survival counts of seedlings was done within a 5 by 5 sub-plot nested within and at the corners of the 50 by 50 meters plot.
Voucher specimens of M. volkensii and associated tree species were collected and identified in the field using identification guides (reference books, plant identification manuals and identification keys to plants). The voucher specimens were prepared by pressing the fresh materials on herbarium- press boards and later drying the specimens using a plant drier [31]. They were mounted on labeled herbarium sheets and deposited in the Kenya Forestry Research Institute local herbarium at Muguga. The specimens that could not be easily identified in the field were taken to the herbarium of the National Museums of Kenya for identification.
2.3 Statistical analysis
Data collected were entered into Microsoft Excel spreadsheets (2019) for subsequent statistical procedures. R software version 2.1.3 was used to analyze the population status of M. volkensii. One-way analysis of variance (ANOVA) at 95% confidence interval was used to test for variance in parameters measured and means separated using Tukey’s HSD. Moreover, relative abundance, species richness and diversity of plant species observed were analyzed using Simpson’s index of biodiversity and Shannon-Wiener species diversity index.
2.3.1 Population status of M. volkensii and diversity of associated species
One-way analysis of variance (ANOVA) at 5% significance level was used to test whether there were any statistically significant differences between the means of diameter at breast height (DBH) and height of the trees in the sampled plots. The statistical test was also used to determine if the means of mature trees, coppices and seedlings were different. Tukey Honestly Significant Difference (HSD test) was utilized to separate means for all the parameters. Data obtained from counting trees in Kasaala location were used to derive total density of plant species, species richness, relative abundance, and diversity of plants in the study area. Relative species abundance was used to compute the occurrence of each species in comparison with the other species recorded. Shannon wiener diversity index was used to estimate the tree species richness and evenness of individual distribution in the tree species. Additionally, Simpson’s diversity index was instrumental in estimating diversity of trees and estimating the probability of two individual trees that belonged to different species [32].
Formulae used for determining tree parameters were as follows:
- Simpson’s diversity index was computed as follows:
D=∑Ri=1(ni (ni−1)
N (N−1)
Where N = the total number of organisms of a particular species, while n = the total number of organisms of all species. While R symbolizes richness which is a measure of how many different types the dataset of interest contains.
- Shannon-Wiener was computed as follows:
H′=NlnN−∑ (nilnni)
N
- Where ni is the number of individuals in species i, and N is the total number of species in the sample.
- Species richness = number of species per specified number of individuals.
Since the datasets were small, the number of coppices, seedlings and mature trees were counted manually.
- Species density = number of species per unit area. Species density per m2 is usually used to measure species richness.
- Relative species abundance = Number of plant species from one group
Total number of species from all groups
- Plant diversity= (ni/N). N is total number of individuals in S species, while ni is the number of individuals in the ith species.
3. Results
In this study, a total of 20 families were represented in the sampled plots. These included Fabaceae (80 species), Malvaceae (52 species), Burseraceae (44 species) and Tiliaceae (70 species) amongst others. The relative abundance of M. volkensii represented 12.2% while that of Acacia tortilis accounted for 10.0%. Adansonia digitata represented a relative abundance of 9.5% while Commiphora baluensis accounted for 8.5%. Adansonia digitata 9.5%, Commiphora baluensis 8.5%, Grewia tephrodermis 5.3%, Acacia nilotica 5.3%, and Grewia villosa 3.3%. Cassia abbreviata, Combretum aculeatum and Commiphora edulis each accounted for 3.1% relative abundance; Acacia senegal, Lannea schimperi, Delonix alata and Bauhinia natalensis each accounted for 2.7% amongst others (Table 1 and Appendix 1).
From Table 2 the mean number of Melia volkensii trees in the study area/ Kasaala Location shows that there were significant differences in the number of M. volkensii trees that were found in the transects (P<0.05).The highest number of M. volkensii trees were recorded in transect 2 while the lowest values were obtained in transects 1, 5 and 6 (P<0.05). The differences were not however consistent with where transects were laid meaning that disturbance of land did not influence the number of trees regenerating.
From Figure 3, the number of M. volkensii trees observed varied among transects. Melia volkensii trees found in the bushland had the highest relative abundance (24%, 12% and 11%) in transects 2, 3 and 4 respectively. Melia volkensii tree was least represented in transects 5 and 6 at 3% and 4% respectively. The trees that were found on the farmland had a moderate representation of relative abundance (6% and 7%) in transects 1 and 7 respectively.
From Figure 4, the mean heights of M. volkensii trees at 5% level of significance varied among transect. In transects 1, 3, 4 and 6 the mean heights were significantly higher compared to transect 5 and 7 with mean height of 7.4 and 7.0 meters respectively. Transect 2 had mean height of 5.2 meters which was significantly different from all other transects (P≤0.05). There were significance difference in transects 2 and 3 and between transects 1 and 2. This was unlike the case of transects 1 and 3 and between 4 and 6 where there were no significance difference.
At P≤0.05, transects showed significant differences between their mean DBH. In transect 1 the mean DBH was large (40.8 cm) as compared to DBH in other transects. Transects 3, 4, 5, 6 and 7 had DBH of between 24.0 to 31.4 cm, while transect 2 had the lowest DBH (19.2 cm). There was a significantly higher mean DBH for M. volkensii trees in transect 1 compared to all other transects (P value < 0.01, at 95% confidence interval). In addition, in transects 3,4,5,6 and 7 were the intermediates. But between transect 1 and 2; there was a significant difference in the mean DBH.
From the information in Table 3, coppicing and growth of seedling were observed in the study area. The number of coppices found in the study area was significantly different amongst the transects at P≤0.05. Transect 2 had the highest coppicing, followed by transect 4; the lowest numbers were recorded in transects 1 and 6. Transects 2 and 4 were in the bushland hence higher coppicing was expected but transect 6 which was also in the bushland showed less coppicing. Mean seedling numbers recorded in the study area were different but their differences were not significant at P≤0.05. Higher numbers were observed in transect 2 and 3which were laid in bushland while the lowest were in transects 1 and 7 which were in the disturbed farmland. Intermediates mean numbers of seedlings were found in transects 3, 4, 5 and 6 which were laid in some part of the bushland. There was significant difference in the mean number of coppices between transect 1 and 2; but no significant difference amongst transect 3, 5, 6 and 7.
From Table 4, the highest Shannon diversity index of 2.23 was recorded in transect 7. The lowest Shannon diversity index was recorded in transect 3 (1.76). Shannon Wiener values as a measure of species evenness indicates that there was greater diversity in transect 7 compared to transect 3. Other (transects 1,2,4,5 and 6) had Shannon diversity indices ranging from 1.98 to 2.2. The highest Simpson’s index was recorded in transect 7 (0.74), while the lowest Simpson’s
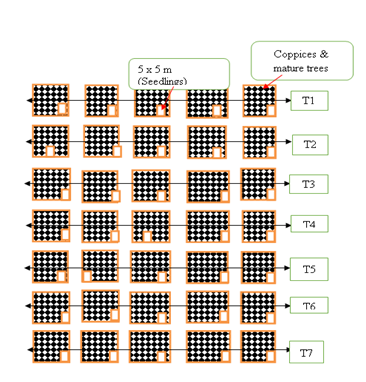
Figure 2: Diagram (not drawn to scale) showing line transects established in Kasaala Location.
|
No. |
Family |
No. of species |
Percent |
Cumulative percent |
|
1 2 3 4 5 |
Mimosaceae Fabaceae |
109 80 |
19.9 12.2 |
19.9 32.1 |
|
Tiliceae Meliceae Malvaceae |
70 67 52 |
12.7 12.2 9.47 |
44.8 57 66.5 |
|
|
6 7 |
Burseraceae Combretaceae |
44 26 |
8 4.7 |
53.9 74.5 |
|
8 |
Capparaceae |
25 |
4.5 |
79 |
|
Others (14) |
79 |
14.3 |
100 |
Table 1: Dominant plant families encountered in Kasaala Location.
|
Transect number |
Mean number of M. volkensii trees |
|
1 2 3 4 5 6 7 |
1.20 ± 0.84b 4.80 ± 1.40a |
|
2.40 ± 1.12ab 2.20 ± 0.86ab |
|
|
0.60 ± 0.25b 0.80 ± 0.37b |
|
|
1. 40 ± 0.51ab |
|
|
P value |
< 0.05 |
Table 2: Mean number of Melia volkensii trees in the study area/ Kasaala Location.
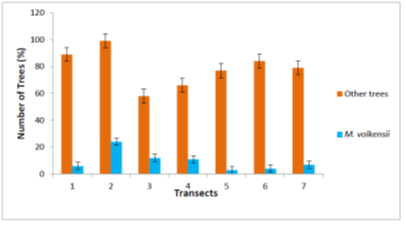
Figure 3: Relative abundance of M. volkensii and other tree species in Kasaala Location.
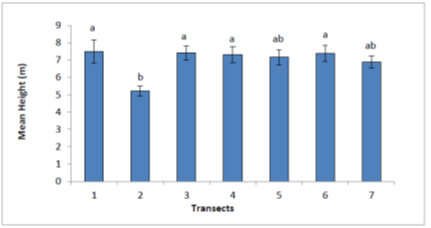
Figure 4: Mean height for M. volkensii trees in the study area.
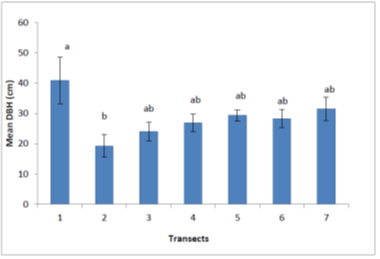
Figure 5: Mean DBH (cm) of M. volkensii in the study area.
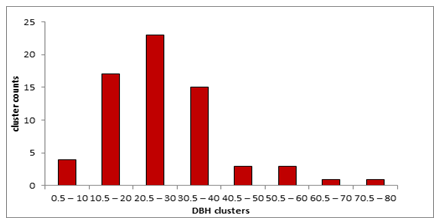
Figure 6: Melia volkensii DBH size-class distributions in the study area.
|
Transect No. |
Mean no. of coppices |
Mean no. of seedlings |
|
1 2 3 4 5 6 |
0.60 ± 0.4b 9.20 ± 1.3a 1.20 ± 0.5b 8.20 ± 1.0a 2.20 ± 0.9b 1.00 ± 0.5b 1.40 ± 0.7b |
0.40 ± 0.4 2.40 ± 0.9 1.80 ± 0.2 1.00 ± 0.6 1.60 ± 0.5 1.40 ± 0.7 0.60 ± 0.6 |
|
7 |
||
|
P value |
<.0001 |
0.27 |
Table 3: Mean no. of coppices and seedlings in the study area.
|
Transects |
Shannon-Wiener Index (H') |
Simpson's Index (λ) |
|
1 2 3 4 5 6 7 |
2.03 2.02 1.76 1.98 2.13 2.2 2.23 |
0.7 0.72 |
|
0.69 0.71 0.71 |
||
|
0.73 0.74 |
Table 4: Diversity indices of tree species in Kasaala Location. index was recorded in transect 3 (0.69), other transects (transects 1,2,4,5 and 6) had Simpson’s diversity indices ranging from 0.69 to 0.73. Simpson’s index calculates the species evenness and richness as a measure of diversity. In this study thus transect 7 recorded the highest diversity and transect 3 the lowest.
From the information in Figure 6, the highest DBH cluster of M. volkensii had 80 cm and the lowest had 0.5 cm. A scarcity of M. volkensii trees (n=1) was observed in DBH cluster that ranged between 60.5-70 cm and between 70.5-80 cm. The size class ranging between 40.5-50 cm and between 50.5-60.0 cm had the second lowest representation of 3 trees each. The lowest DBH class of 0.5-10 cm had only 4 trees. A moderate representation of M. volkensii trees was found in the class diameter of 30.5-40.0 cm with 15 trees of M. volkensii.
4. Discussion
4.1 Status and population structure of Melia Volkensii in the study area
In this study, M. volkensii was the most abundant species in the study area, followed by Acacia tortilis. These results are related to findings of Anjarwalla et al. [33] who observed that M. volkensii is found growing alongside the Acacia-Commiphora vegetation, along uncultivated land which is covered with natural vegetation. The study also agrees with Kamondo et al. [34], who reported that the tree species are drought tolerant and adaptable to the semi-arid weather conditions in Kitui County. Additionally, there were significant differences in the mean number of M. volkensii trees found in the study area, though the differences were not however consistent with where transects were established. It was expected that transects laid in the farmland would register lower mean number of M. volkensii trees than those in the bushland which wasn’t the case. This can be attributed to the fact that the ecological patterns of a plant population are characterized by its population dynamics, as well as the correlation between each individual plant and the external environments [35].
In the study area, there existed vast farmlands with tall well-groomed cultivated Melia volkensii trees which were found growing on both the farmlands and the natural bushland vegetation. The bushland possessed a high H1 index of tree species and supported a range of vegetation cover unlike the farmland that exhibited a lower H1 index of tree species and a limited range of vegetation cover. This is probably because of anthropogenic activities that were carried out in the farmland for instance cultivation, logging, overgrazing, and other habitat degradation activities thus causing impact on the trees and undercover biological species. These results are related to the observation of Caviedes and Ibarra [36] who stated that environmental changes caused by human beings have the ability to degenerate and simplify forest stands by accelerating the loss of trees, coppices and seedlings. These results also agree with the study carried out by Bruun et al. [37] that species richness increases at a lower elevation but decreases at a higher elevation. He also stated that the slope and aspect affect plant diversity in many ways, consequently affecting the formation of soils from parent rock. This is due to the soil physicochemical properties and microbial activities that are usually abundant at the topsoil leading to an abundance of tree species on flat bushland topography.
According to Borda-Nino et al. [38] fluctuations in the sloppiness influence the vegetation composition and structure, leading to a lower diversity. Melia volkensii trees had high DBH and height indicator of the high rate of trees' growth, which were probably controlled by combined effects of biotic and abiotic factors, particularly soil microorganisms, soil nutrients, water, weather patterns, sunlight, and competition among trees [39]. These results are also in agreement with Pang et al. who observed that the total tree height averages for assessment that was carried out on indicator species of a natural forest was between 0.2-0.5 meters.
From this study, it was evident that, the steep slope farmlands carried a few species adapted to a narrow range of prevailing conditions. This can be attributed to the fact that soil erosion was prevalent on the farmland, leading to soil structure loss, nutrient degradation, and soil compaction. Similar results were confirmed by Liu et al. [40], who observed that the topographical features were essential for soil formation. As well, they affect the soil condition and bacterial communities. Congruently, the steep soils may be eroded and thus lose their topsoil during the formation process. Therefore, they become thinner than the more nearly level grounds that receive deposits from areas upslope Flores et al. [41].
A considerable portion of the bushland had a big number of mature trees, coppices, and seedlings of Melia volkensii. Thus, the positive association between mature individuals and juveniles of this tree species in the bushland suggests that M.volkensii juveniles are successfully establishing under the canopy of other associating trees that were found growing in the study area. This shows the role of trees in generating vegetation cover that plays a vital role in the maintenance of plant diversity in the study area. These results are congruent with Xu et al. [42] who found evidence of positive association between tree over story-layer composition and the understory layer diversity in different forest types [43,44].
5. Conclusions and Recommendations
In this study, a total of 20 plant families were represented in the sampled plots and it was evident that the abundant tree species in the study site was M. volkensii. In this regard, the risk of tree depletion has no significant effects on the population status of Melia volkensii in Kasaala Location of Kitui County. The study reveals that the bushland possessed a high index of tree species and supported a range of vegetation cover unlike the farmland that exhibited a lower index of tree species and a limited range of vegetation cover. Melia volkensii trees found in the bushland had the highest relative abundance while the trees found on the farmland had a moderate representation of relative abundance. There were significant differences in the mean number of M. volkensii trees and coppices. In contrast there were no significant differences in the mean number of M. volkensii seedlings found in the study area. Plant-plant positive associations appeared to be the predominant interaction among the species studied in this community. However, considerable threats negatively impacted the abundance of this arid and semi-arid agroforestry tree. For instance, human encroachment of the natural habitat, overharvesting for timber production, and farmland expansion are the primary threats to M. volkensii and associated species. Findings from this study will help in improving the production of M. volkensii and associated tree species thus promote its propagation and conservation.
The study recommends that there is a great need to conduct more extensive research on the population status of M. volkensii and associated tree species in Kitui County. Tree species with poor regeneration should be prioritized during rehabilitation and conservation of the tree species in the study area. Additionally, detailed regeneration studies should be done in Kitui County so as to fully understand the mechanisms that promote natural regeneration. Further research involving alternative source of livelihood for local community is needed to discourage anthropogenic activities that lead to overconsumption, pollution and overexploitation of forest products. This will help to reduce the pressure on the forest and hence conserving the environment.
Declaration of competing interest
The authors confirm that there are no known conflicts of interest associated with this publication.
Funding:
This research was not funded by any organization.
Acknowledgements
The authors gratefully acknowledge Kenya Forestry Research Institute, Kenyatta University for logistical and technical support for successful completion of the study. Not forgetting to appreciate the assistance offered by the local community of Ikutha Sub County in Kitui County for providing information on trees growing naturally in Kasaala Location.
References
- Mabberley DJ. A Monograph of Melia in Asia and the Pacific. The History of White Cedar and Persian lilac. Gardens' Bulletin 37 (1984): 49-64.
- Orwa C, Mutua A, Kindt R, et al. Agroforestry Database: A Tree Reference and Selection Guide Version 4.0 (2009).
- Blomley T. Indigenous Agroforestry: Melia volkensii in Kenya. Agroforestry Today 6 (1994): 10-11.
- Njehu JM, Wabuyele Emily, Mutune AN, Kevin Omollo, Kamondo BM. Optimizing Germination of Melia volkensii Gürke after Storage of Seeds and Nuts in Different Storage Conditions. International Journal of Plant, Animal and Environmental Sciences 11 (2021): 532-544.
- Mulatya JM, Wilson J, Ong CK, et al. Root architecture of provenances, seedlings and cuttings of Melia volkensii: implications for crop yield in dryland agroforestry. Agroforestry Systems 56 (2002): 65-72.
- Nieuwenhuis M, Egan D. An Evaluation and Comparison of Mechanized and Manual Planting on Afforestation and Reforestation Sites in Ireland. International Journal of Forest Engineering, 13 (2002): 11-23.
- Midgley JJ, Bond WJ. Why the World's Vegetation is not totally dominated by resprouting Plants; because resprouters are shorter than seedsers (1996).
- Kuuluvainen T, Lairo R. Long term forest utilization can decrease forest floor microhabitat diversity:evidence from boreal Fennoscandia. Can J for Res 34 (2004): 303-309.
- Liira J, Sepp T, Kohv K (2011). The Ecology of tree regeneration in mature and old forests: combined knowledge for sustainable forest management. J for Res 16(3): 184-193.
- Dey DC, Knapp BO, Battaglia MA, et al. Barriers to natural regeneration in temperate forests acss the USA. New Forests 50 (2019): 11-40.
- Bongers F, Poorter L, Hawthorne WD. The Intermediate disturbance hypothesis applies to Tropical Forests, but Disturbance contributes little to tree Diversity. Ecol Lett 12 (2009): 798-805.
- Endale Y, Derero A, Argaw M, et al. Farmland tree species diversity and spatial distribution pattern in semi-arid East Shewa, Ethiopia.For Trees Livelihoods26 (2017): 199-214.
- Sales-Baptista E, d’Abreu MC, Ferraz-de-Oliveira M. Overgrazing in the Montado? The need for monitoring grazing pressure at paddock scale.Agrofor Syst 90 (2016): 57-68.
- Cardinale BJ, Nelson K, Palmer MA. Linking species diversity to the functioning of ecosystems: on the importance of environmental context.Oikos 91 (2000): 175-183.
- Parthasarathy N, Sethi P. Trees and liana species diversity and population structure in a tropical dry evergreen forest in south India. Tropical Ecology 38 (1997).
- Lemma DT, Megersa HG. Impact of climate change on East African coffee production and its mitigation strategies.World Journal of Agricultural Sciences,17 (2021): 81-89.
- FAO and UNEP. The State of the World’s Forests 2020. Forests, biodiversity and people. Rome (2020).
- Barber RG, Thomas DB, Moore TR. Studies on soil erosion and runoff and proposed design procedures for terraces in the cultivated semi-arid areas of Machakos District, Kenya. In: Morgan RPC Eds - Soil Conservation: Problems and Prospects. John Wiley & Sons, Chichester, England (1981).
- Jaetzold R, Schmidt H, Hornetz B, et al. Farm Management Handbook of Kenya (Vol. 2/C1). Nairobi: Ministry of Agriculture (2006).
- Gachathi FN, Johansson SG, Alakoski-Johansson GM. A Check-List of Indigenous Trees and Shrubs of Bura, Tana River District, Kenya with Malakote, Orma and Somali Names. Journal of East African Natural History83 (1994): 117-141.
- Kiruki HM. VU Research Portal. Environment, Development and Sustainability 22 (2020): 6931-6960.
- Yohannis MA.ICTS as a Bridge between Climate Information and Livelihood Strategies among Rural Women in Kitui County, Kenya(Doctoral dissertation, UoN) (2019).
- Mbiti J, Misango S. Organizational Culture and Structure as Determinants of Service Delivery in the County Government of Kitui.European Journal of Business and Strategic Management 6 (2021): 73-88.
- Kivunzya AN.Characterisation of livestock production systems and its contribution to the food security in Kitui County, Kenya(Doctoral dissertation) (2019).
- Kivunzya AN, Kanui IT, Amwata AD, et al. The status of livestock production systems in semi-arid farming and arid pastoral agro-ecological zones in Kitui County, Kenya.International Journal of Education and Research 6 (2018): 141-148.
- Warui MW, Gikungu M, Bosselmann AS, et al. Pollination of Acacia woodlands and honey production by honey bees in Kitui, Kenya.Future of Food: Journal on Food, Agriculture and Society 6 (2018): 40-50.
- Musinguzi P, Bosselmann AS, Pouliot M. Livelihoods-conservation initiatives: Evidence of socio-economic impacts from organic honey production in Mwingi, Eastern Kenya.Forest Policy and Economics 97 (2018): 132-145.
- Sisay G, Gitima G, Mersha M, et al. Assessment of land use land cover dynamics and its drivers in Bechet Watershed Upper Blue Nile Basin, Ethiopia.Remote Sensing Applications: Society and Environment 24 (2021): 100648.
- Plumptre AJ, Reynolds V. The Effect of Selective Logging on the Primate Populations in the Budongo Forest Reserve, Uganda.Journal of Applied Ecology 31 (1994): 631-641.
- Manning AD, Cunningham RB, Tongway D, et al. Woodlands and woody debris: Understanding structure and composition to inform restoration.Plos One 15 (2020): e0224258.
- Miller JH, Miller KV. Forest Plants of the Southeast and Their Wildlife Uses. Auburn, AL: Southern Weed Science Society (1999).
- Kumar P, Dobriyal M, Kale A, et al. Calculating forest species diversity with information-theory based indices using sentinel-2A sensor’s of Mahavir Swami Wildlife Sanctuary. Plos One 17 (2022): e0268018.
- Anjarwalla P, Belmain S, Sola P, et al. Handbook on Pesticidal Plants. World Agroforestry Centre (ICRAF), Nairobi, Kenya (2016).
- Kamondo BM, Kariuki JG, Luvanda AM, et al. Guideline on Production, Distribution and Use of Improved Melia Seed and Seedlings in the Drylands of Kenya (2016 ed.). KEFRI - Kenya: Kenya Forestry Research Institute (2016).
- Odum EP. Fundamentals of Ecology (3rd) WB Saunders Co.Philadelphia, Pennsylvania (1971).
- CaviedesJ, IbarraJT. Influence of Anthropogenic Disturbances on Stand Structural Complexity in Andean Temperate Forests: Implications for Managing Key Habitat for Biodiversity (2017).
- Bruun HH, Moen J, Virtanen R, et al. Effects of altitude and topography on species richness of vascular plants, bryophytes and lichens in alpine communities.Journal of Vegetation Science 17 (2006): 37-46.
- Borda-Nino M, Ceccon E, Meli P, et al. Integrating farmers’ decisions on the assessment of forest regeneration drivers in a rural landscape of Southeastern Brazil.Perspectives in Ecology and Conservation 19 (2021): 338-344.
- Stephenson NL, Das AJ, Condit R, etal. Rate of Tree Carbon Accumulation Increases Continuously with Tree Size.Nature507 (2014): 90-93.
- Liu Y, Zhang L, Lu J, et al. Topography Affects the Soil Condition and Bacteria Communities along a restoration Gradient on Loess Plateau. Journal on Applied Soil Ecology 150 (2019): 103471.
- Flores BM, Staal A, Jakovac CC, et al. Soil erosion as a resilience drain in disturbed tropical forests. Plant and Soil 450 (2020): 11-25.
- Xu Y, Zhang Y, Shi M, et al. Environmental variation, functional diversity and identity predicting community biomass in an old-growth subtropical broad-leaved forest.Global Ecology and Conservation 23 (2020): e01093.
- Kayombo C, Rubanza C, Giliba R. Effect of Human Disturbances on Mahungu Green Belt Forest Reserve (MGFR) in Dodoma City, Central Tanzania.East African Journal of Forestry and Agroforestry,2 (2020): 1-15.
- Kidundo M. Participatory technology development and Nursery Propagation of Melia volkensii: A potential Agroforestry tree species for semi-arid Mbeere. MSc Thesis, University of Wales, Bangor (1997).