Araf Reshad1*, Md. Moklesur Rahman2, Nafisur Rahman3, Jannatul Ferdaus4
1Division of Orthopedics, Department of Surgery, Square Hospitals Ltd., Dhaka, Bangladesh
2Faculty of Health Sciences, Queen’s University, Kingston, Ontario, Canada
3,4Department of Radiology, Square Hospitals Ltd., Dhaka, Bangladesh
*Corresponding Author: Araf Reshad. Faculty of Health Sciences, Queen’s University, Kingston, Ontario, Canada
Received: 08 June 2026; Accepted: 15 June 2026; Published: xx June 2026
Background: Osteoporosis is a prevalent skeletal disorder characterized by decreased bone strength and an increased risk of fragility fractures. The lumbar spine (L1–L4) and femoral neck are the principal DXA measurement sites; however, these sites may yield different bone mineral density (BMD) and T-score patterns depending on age, sex, and body mass index (BMI). This study aims to compare lumbar spine and femoral neck bone mineral density (BMD) and corresponding T-scores by age, sex, and body mass index (BMI).
Methods: This observational analytical study was conducted at Square Hospitals Ltd., Dhaka, Bangladesh, from July, 2024 to June, 2025. A total of 160 participants with interpretable measurements for both lumbar spine (AP L1-L4) and femoral neck were included. Age was grouped in years, and BMI was calculated from recorded height and weight. Outcomes were lumbar spine and femoral neck BMD (g/cm²) and T-scores; when both hips were available, the femoral neck with the lower T-score was used. Bone status was classified using WHO T-score thresholds as normal, osteopenia, or osteoporosis. Data were analyzed in SPSS v26.0 using descriptive statistics, and multivariable linear regression with lumbar and femoral neck BMD as dependent variables and age, sex, and BMI as predictors; significance was set at p<0.05, and ethical approval and confidentiality safeguards were maintained.
Results: A total of 160 participants were included, with a mean age of 62.67 ± 9.25 years; 91.25% were female, and the majority were aged 60–69 years (40.63%). The mean body mass index (BMI) was 28.15 ± 4.89 kg/m², with 35.63% classified as overweight and 40.00% as obese. The mean lumbar spine bone mineral density (BMD) was 0.96 ± 0.19 g/cm² (T-score -1.89 ± 1.57), and the mean femoral neck BMD was 0.77 ± 0.15 g/cm² (T-score -2.01 ± 1.07). Osteopenia and osteoporosis were observed in 39.4% and 36.3% of lumbar spine measurements, respectively, and in 50.6% and 32.5% of femoral neck measurements, respectively. Femoral neck BMD decreased with advancing age, reaching the lowest values in participants aged 70 years or older (0.71 ± 0.19 g/cm²; T-score -2.40 ± 1.44). Higher BMI was associated with increased BMD. Regression analysis indicated that age was a significant predictor of lower femoral neck BMD (β = -0.0040 per year, p=0.007), female sex predicted lower lumbar spine BMD (β = -0.2522, p<0.001), and BMI was
positively associated with BMD at both anatomical sites (p=0.001).
Conclusion: Low bone mass was prevalent at both the lumbar spine and femoral neck, with osteopenia more frequently observed at the femoral neck and a greater proportion of osteoporosis at the lumbar spine. Femoral neck bone mineral density (BMD) decreased with age. Female sex was associated with lower lumbar spine BMD, while higher body mass index (BMI) correlated with increased BMD at both anatomical sites. These findings support the use of site-specific dual-energy X-ray absorptiometry (DXA) interpretation for risk assessment.
Bone Mineral Density (BMD), Osteoporosis, Osteopenia, Dual-energy X-ray absorptiometry (DXA), Lumbar Spine, and Femoral neck
Bone Mineral Density (BMD) articles; Osteoporosis articles; Osteopenia articles; Dual-energy X-ray absorptiometry (DXA) articles; Lumbar Spine articles; and Femoral neck articles
Introduction
Osteoporosis is a chronic skeletal disorder defined by reduced bone strength and an increased risk of fragility fractures. In clinical practice, osteoporosis is most commonly assessed using areal bone mineral density (BMD) measured by dual-energy X-ray absorptiometry (DXA) [1,2]. The condition affects a significant proportion of adults globally, with notable variation by region, sex, and age structure [3]. Global Burden of Disease (GBD) analyses underscore the substantial morbidity associated with osteoporosis, demonstrating that fractures are a major and increasing cause of disability worldwide, particularly among older adults where hip and vertebral fractures are prevalent and contribute to increased dependence and healthcare utilization [4]. DXA-based T-scores are central to diagnostic classification and treatment decisions; internationally recognized thresholds define osteopenia as a T-score between -1.0 and -2.5, and osteoporosis as a T-score at or below -2.5 at relevant skeletal sites in appropriate patient groups [1,2]. Current guidelines recommend that BMD interpretation be integrated within comprehensive fracture risk assessment, considering factors such as age, prior fracture, glucocorticoid exposure, secondary causes, and context-specific risk calculators, since fracture risk increases continuously across the BMD spectrum and is not limited to those meeting the osteoporosis threshold [5-7]. Screening recommendations from major preventive organizations similarly prioritize older adults and individuals with elevated clinical risk, reflecting the high absolute fracture risk in later life and the demonstrated efficacy of pharmacologic therapy in reducing incident fractures in appropriately selected patients [5,6]. Within DXA, the lumbar spine (typically L1-L4) and proximal femur, most commonly the femoral neck, are the primary measurement sites for diagnosis and monitoring. However, these sites do not behave identically across the lifespan [1,2]. The lumbar spine, which is rich in trabecular bone, may exhibit earlier BMD decline in some contexts, but is also susceptible to artefactual elevation due to degenerative changes, aortic calcification, and structural abnormalities, potentially masking true bone loss in older adults [1,2]. In contrast, femoral neck BMD is closely associated with hip fracture risk and is often prioritized for risk prediction, but may display different sensitivity to age-related and body composition changes compared to the spine [2,5]. Consequently, discordance between lumbar spine and femoral neck T-scores is common in clinical practice, ranging from minor to major discordance, and can influence diagnostic categorization, perceived severity, and treatment eligibility. Recent community-based studies in older adults confirm that such discordance is frequent and clinically significant [8,9]. Body mass index (BMI) is another important determinant of BMD interpretation and fracture risk, as it reflects, though imperfectly, mechanical loading, adiposity-related endocrine signaling, and nutritional status [2,10]. Evidence indicates that obesity is generally associated with higher areal BMD compared to normal weight, but this does not ensure protection from fractures due to the influence of falls, sarcopenia, fat distribution, and bone quality beyond areal density [2,10]. In South Asian populations, where demographic ageing is accelerating and nutritional transitions coexist with limited DXA availability, understanding the intersection of BMI and sex with site-specific BMD is particularly important for targeted screening and efficient resource allocation [3,4,11]. Despite the clinical emphasis on lumbar spine and femoral neck measurements, locally generated data remain scarce in many low- and middle-income regions, including parts of South Asia, regarding the frequency of spine-hip differences, the strength of association between each site and age or BMI strata, and the consistency of sex-specific patterns with global trends [2,3,11]. In this context, this study compares lumbar spine and femoral neck bone mineral density (BMD) and corresponding T-scores by age, sex, and body mass index (BMI).
Methods
This observational analytical study utilized dual-energy X-ray absorptiometry (DEXA) records to compare lumbar spine and femoral neck bone mineral density (BMD), and to assess their associations with age, sex, and body mass index (BMI). All individuals who underwent DEXA examinations at Square Hospitals Ltd., Dhaka, Bangladesh, from July, 2024 to June, 2025. For this comparative analysis, the analytic cohort included 160 participants with interpretable measurements for both the lumbar spine (AP L1-L4) and femoral neck.
Eligibility criteria required participants to have valid lumbar spine L1-L4 BMD and T-score, as well as at least one femoral neck (left or right) BMD and T-score. Records were excluded if essential variables for analysis were missing (age, sex, height or weight for BMI calculation, or relevant DEXA outputs), or if scans were deemed non-interpretable due to major artefacts, such as severe degenerative changes, metallic implants, or vertebral exclusions that precluded L1-L4 reporting. Demographic variables included age (years) and sex. Age was categorized into four strata: 40-49, 50-59, 60-69, and ≥70 years. Anthropometric data were obtained from recorded height and weight at the time of scan. BMI was calculated as weight in kilograms divided by height in meters squared, and categorized as underweight, normal, overweight, or obese according to dataset-specific cutoffs.
DEXA outcomes included lumbar spine (L1-L4) BMD (g/cm²) and T-score, as well as femoral neck BMD and T-score. When measurements from both hip sides were available, the femoral neck value selected for analysis was the side with the lower, more negative T-score; the corresponding BMD was used to avoid underestimating hip involvement. Osteopenia and osteoporosis were classified according to World Health Organization (WHO) T-score thresholds: normal (T-score ≥ -1.0), osteopenia (T-score between -1.0 and -2.5), and osteoporosis (T-score <-2.5) [12]. These categories were reported separately for the lumbar spine and the femoral neck and summarized using the lowest T-score across both sites to determine stratified prevalence.
Data analysis employed standard descriptive statistics, including mean ± standard deviation, range, and proportions. All the data were analyzed using SPSS (version 26.0). Group comparisons by sex, age strata, and BMI categories were conducted using appropriate parametric or non-parametric tests, depending on distributional assumptions. Multivariable linear regression models were constructed with lumbar BMD and femoral neck BMD as dependent variables, and age, sex, and BMI as predictors. β coefficients, 95% confidence intervals, and p-values were reported, with statistical significance set at p<0.05. Ethical approval and confidentiality safeguards were implemented in accordance with institutional requirements.
Results
Among the 160 participants, the largest age group was 60-69 years (40.63%), followed by those aged 50-59 years (32.50%) and those aged 70 years or older (22.50%). The mean age was 62.67 ± 9.25 years. The sample was predominantly female (91.25%). The mean body mass index (BMI) was 28.15 ± 4.89 kg/m². Excess body weight was prevalent, with 35.63% classified as overweight and 40.00% as obese, while underweight status was rare (0.63%).
|
Variable |
Frequency (n) |
Percentage (%) |
|
Age group (years) |
||
|
40-49 |
7 |
4.38 |
|
50-59 |
52 |
32.50 |
|
60-69 |
65 |
40.63 |
|
≥70 |
36 |
22.50 |
|
Mean ± SD |
62.67 ± 9.25 |
|
|
Gender |
||
|
Male |
14 |
8.75 |
|
Female |
146 |
91.25 |
|
BMI category |
||
|
Underweight |
1 |
0.63 |
|
Normal |
38 |
23.75 |
|
Overweight |
57 |
35.63 |
|
Obese |
64 |
40.00 |
|
Mean ± SD |
28.15 ± 4.89 |
|
Table 1: Sociodemographic and anthropometric characteristics of the study participants (n=160)
Bone density measurements indicated low average T-scores at both anatomical sites. The mean lumbar spine (L1-L4) bone mineral density (BMD) was 0.96 ± 0.19 g/cm², with a mean T-score of -1.89 ± 1.57. The mean femoral neck BMD was 0.77 ± 0.15 g/cm², with a mean T-score of -2.01 ± 1.07. These results suggest that, on average, participants were in the osteopenia range, with femoral neck values marginally lower than those of the lumbar spine.
|
Site and metric |
Mean ± SD |
Min to Max |
|
Lumbar spine (L1-L4) BMD (g/cm²) |
0.96 ± 0.19 |
0.03-1.50 |
|
Lumbar spine (L1-L4) T-score |
-1.89 ± 1.57 |
-9.40-2.10 |
|
Femoral neck BMD used (g/cm²) |
0.77 ± 0.15 |
0.04-1.23 |
|
Femoral neck T-score used (lowest of L/R) |
-2.01 ± 1.07 |
-7.90-0.50 |
Table 2: Descriptive statistics of lumbar spine (L1-L4) and femoral neck bone mineral density and T-scores.
Stratification by sex revealed that males had higher lumbar spine BMD (1.18 ± 0.19 g/cm²) compared to females (0.94 ± 0.18 g/cm²), as well as substantially better lumbar T-scores (-0.25 ± 1.47 in males versus -2.05 ± 1.49 in females). Femoral neck BMD was similar between sexes (0.78 ± 0.26 g/cm² in males and 0.77 ± 0.14 g/cm² in females), although males exhibited a lower mean femoral neck T-score (-2.24 ± 1.83) than females (-1.98 ± 0.97), acknowledging the small male sample size (n=14). Age stratification showed that femoral neck BMD decreased and T-scores worsened in the oldest group; participants aged 70 years or older had the lowest femoral neck BMD (0.71 ± 0.19 g/cm²) and T-score (-2.40 ± 1.44). Higher BMI categories were associated with greater BMD and less negative T-scores. For instance, obese participants had a lumbar BMD of 0.98 ± 0.18 g/cm² and femoral neck BMD of 0.79 ± 0.12 g/cm², compared to those with normal BMI, who had a lumbar BMD of 0.91 ± 0.16 g/cm² and femoral neck BMD of 0.73 ± 0.13 g/cm².
|
Variable |
Lumbar BMD (Mean ± SD) |
Lumbar T-score (Mean ± SD) |
Femoral neck BMD (Mean ± SD) |
Femoral neck T-score (Mean ± SD) |
|
Gender |
||||
|
Male (n=14) |
1.18 ± 0.19 |
-0.25 ± 1.47 |
0.78 ± 0.26 |
-2.24 ± 1.83 |
|
Female (n=146) |
0.94 ± 0.18 |
-2.05 ± 1.49 |
0.77 ± 0.14 |
-1.98 ± 0.97 |
|
Age group (years) |
||||
|
40-49 (n=7) |
1.03 ± 0.14 |
-1.36 ± 1.09 |
0.75 ± 0.15 |
-2.09 ± 1.11 |
|
50-59 (n=52) |
0.94 ± 0.19 |
-1.98 ± 1.59 |
0.80 ± 0.12 |
-1.69 ± 0.87 |
|
60-69 (n=65) |
0.95 ± 0.19 |
-2.01 ± 1.54 |
0.77 ± 0.14 |
-2.03 ± 0.91 |
|
≥70 (n=36) |
0.99 ± 0.21 |
-1.66 ± 1.68 |
0.71 ± 0.19 |
-2.40 ± 1.44 |
|
BMI category |
||||
|
Underweight (n=1) |
0.49 |
-5.7 |
0.53 |
-3.7 |
|
Normal (n=38) |
0.91 ± 0.16 |
-2.28 ± 1.30 |
0.73 ± 0.13 |
-2.23 ± 0.96 |
|
Overweight (n=57) |
0.97 ± 0.22 |
-1.83 ± 1.73 |
0.77 ± 0.18 |
-2.07 ± 1.27 |
|
Obese (n=64) |
0.98 ± 0.18 |
-1.66 ± 1.48 |
0.79 ± 0.12 |
-1.79 ± 0.89 |
Table 3: Lumbar spine and femoral neck BMD and T-scores stratified by sex, age group, and BMI category.
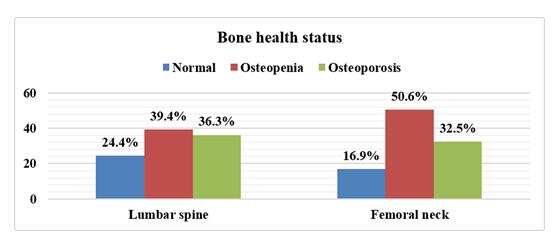
Figure 1: Distribution of bone health status by measurement site (lumbar spine vs femoral neck).
Classification by anatomical site demonstrated a substantial prevalence of low bone mass and osteoporosis. At the lumbar spine, 39.4% of participants had osteopenia and 36.3% had osteoporosis. In contrast, at the femoral neck, osteopenia was more common (50.6%) and osteoporosis was somewhat less frequent (32.5%). These findings suggest that the femoral neck identified a greater proportion of individuals with borderline low bone mass, whereas the lumbar spine detected a higher proportion with osteoporosis.
Analysis of subgroup prevalence patterns revealed that females had a higher proportion of osteoporosis compared to males (54.8% versus 42.9%). Osteoporosis prevalence was elevated at the extremes of age, with 57.1% in the 40-49-year group (n=7) and 58.3% in those aged 70 years or older. The 50-59-year group exhibited a higher prevalence of osteopenia (61.5%). Regarding BMI, osteoporosis was most prevalent among participants with normal BMI (60.5%) and less common in obese individuals (42.2%), further supporting the association between higher BMI and increased BMD.
|
Stratum |
Category |
Osteopenia, n (%) |
Osteoporosis, n (%) |
|
Sex |
Male (n=14) |
8 (57.1) |
6 (42.9) |
|
Female (n=146) |
66 (45.2) |
80 (54.8) |
|
|
Age |
40-49 (n=7) |
3 (42.9) |
4 (57.1) |
|
50-59 (n=52) |
32 (61.5) |
20 (38.5) |
|
|
60-69 (n=65) |
27 (41.5) |
38 (58.5) |
|
|
≥70 (n=36) |
15 (41.7) |
21 (58.3) |
|
|
BMI |
Underweight (n=1) |
0 (0.0) |
1 (100.0) |
|
Normal (n=38) |
15 (39.5) |
23 (60.5) |
|
|
Overweight (n=57) |
25 (43.9) |
32 (56.1) |
|
|
Obese (n=64) |
37 (57.8) |
27 (42.2) |
Table 4: Prevalence of osteopenia and osteoporosis by sex, age group, and BMI category (DXA-derived classification).
Multivariable linear regression analysis indicated that age was not associated with lumbar spine BMD (β -0.0004, p=0.84), but was significantly associated with lower femoral neck BMD (β −0.0040 per year, p=0.007). Female sex was a significant predictor of lower lumbar spine BMD (β -0.2522, p<0.001), but not of femoral neck BMD (p=0.326). BMI demonstrated a positive association with BMD at both sites: lumbar spine (β 0.0106 per 1 kg/m², p=0.001) and femoral neck (β 0.0083 per 1 kg/m², p=0.001), reinforcing the observed trend of higher BMD with increasing BMI.
|
Predictor |
Lumbar BMD, β (SE) |
95% CI |
p-value |
Femoral neck BMD, β (SE) |
95% CI |
p-value |
|
Age (per year) |
-0.0004 (0.0018) |
-0.0039 to 0.0032 |
0.84 |
-0.0040 (0.0015) |
-0.0069 to -0.0011 |
0.007 |
|
Sex (female vs male) |
-0.2522 (0.0545) |
-0.3600 to -0.1444 |
<0.001 |
-0.0438 (0.0445) |
-0.1317 to 0.0441 |
0.326 |
|
BMI (per 1 kg/m²) |
0.0106 (0.0030) |
0.0047 to 0.0165 |
0.001 |
0.0083 (0.0024) |
0.0034 to 0.0131 |
0.001 |
Table 5: Multivariable linear regression of predictors of lumbar spine and femoral neck BMD.
Discussion
This DXA-based comparative analysis reveals a substantial prevalence of reduced bone mass in an older cohort (mean age 62.67 ± 9.25 years), predominantly female (91.25%) with a high mean BMI (28.15 ± 4.89 kg/m²). The mean lumbar spine BMD (0.96 ± 0.19 g/cm²; T-score -1.89 ± 1.57) and mean femoral neck BMD (0.77 ± 0.15 g/cm²; T-score -2.01 ± 1.07) indicate that, on average, participants were osteopenic at both anatomical sites. However, site-specific classification varied: lumbar spine measurements identified 39.4% osteopenia and 36.3% osteoporosis, while femoral neck measurements identified 50.6% osteopenia and 32.5% osteoporosis. Comparable patterns of “high overall burden, site-dependent proportions” have been documented in diverse settings, including large multicenter Asian DXA surveys and South Asian clinic-based samples, where hip and spine assessments do not necessarily yield identical diagnostic distributions due to differences in bone compartments and their susceptibility to ageing and artefacts [13-15]. Age-related decline in this dataset was most pronounced at the femoral neck. Femoral neck BMD decreased from 0.80 ± 0.12 g/cm² (50-59 years) to 0.71 ± 0.19 g/cm² (≥70 years), and multivariable modeling confirmed a significant inverse association between age and femoral neck BMD (β −0.0040 per year, p=0.007). This finding aligns with epidemiologic evidence that hip BMD declines steadily with age and that hip measurements are central to fracture-risk stratification and monitoring of age-related bone loss [15,16]. In contrast, lumbar spine BMD did not demonstrate a statistically significant association with age in regression analysis, and the ≥70 group exhibited a slightly higher mean lumbar BMD than the 60-69 group (0.99 vs 0.95 g/cm²). This pattern may reflect age-related degenerative changes, aortic calcification, and other artefacts that can artificially elevate lumbar BMD in older adults [17]. Recent studies on spine-hip discordance similarly report that discordance increases with age, partly because lumbar spine values are disproportionately influenced by degenerative changes compared to proximal femur measures [9]. Sex differences were most apparent at the lumbar spine. Men exhibited higher lumbar BMD (1.18 ± 0.19 vs 0.94 ± 0.18 g/cm²) and substantially better lumbar T-scores (-0.25 ± 1.47 vs -2.05 ± 1.49), and female sex remained independently associated with lower lumbar BMD (β -0.2522, p<0.001). Comprehensive reviews and population studies consistently report lower BMD in women, attributed to differences in peak bone mass and accelerated postmenopausal bone loss, with significant implications for screening and treatment thresholds [13,14]. In this cohort, femoral neck BMD was similar between sexes (0.78 ± 0.26 vs 0.77 ± 0.14 g/cm²), and sex was not a significant factor in the femoral model. This divergence from many population-based datasets may be due to the small male sample (n=14), referral patterns, and greater variability in hip BMD estimates when subgroup sizes are limited, a phenomenon also observed in clinical DXA series examining discordance and subgroup effects [9]. BMI demonstrated a consistent positive association with BMD at both sites. Each 1 kg/m² increase in BMI was associated with higher lumbar spine BMD (β 0.0106, p=0.001) and higher femoral neck BMD (β 0.0083, p=0.001), and obese participants had the most favorable mean T-scores (lumbar -1.66; femoral -1.79). This observation is consistent with previous studies in older adults showing a positive BMI-BMD association of similar magnitude, likely reflecting mechanical loading, larger skeletal size, and endocrine factors related to adiposity [18]. Bangladeshi clinical data have also identified BMI as an important correlate of BMD, underscoring the relevance of body composition in local risk profiles [15,19]. Notably, higher BMI and higher BMD should not be interpreted as an absence of fracture risk, as systematic review evidence indicates that obesity may be associated with site-specific fracture patterns, increased fall risk, and reduced bone quality despite higher areal BMD [20,21]. Clinically, this supports a nuanced interpretation: while BMI may increase BMD on DXA, fracture prevention still requires comprehensive risk assessment rather than reassurance based solely on adiposity [13,20,21]. The site-dependent distribution observed in this cohort highlights the clinical significance of spine-hip discordance and the necessity for careful DXA interpretation. Meta-analytic evidence demonstrates that lumbar spine and femoral neck discordance can meaningfully influence risk stratification around intervention thresholds, even when FRAX utilizes femoral neck BMD, particularly when one site is disproportionately affected by artefact or local pathology. Real-world DXA series confirm that discordance is common, increases with age, and necessitates attention to scan quality and artefact recognition, especially at the lumbar spine [9]. In summary, these findings support routine reporting and interpretation of both lumbar spine and hip results, increased reliance on hip measures for age-related decline and fracture-risk integration, and explicit consideration of degenerative spine changes when lumbar BMD appears unexpectedly preserved in older adults [9,17].
Limitations of the study
This was a single-center, cross-sectional analysis, so temporal or causal relationships between age, sex, BMI, and BMD cannot be inferred. The sample was predominantly female, with a small male subgroup, which limits sex-based comparisons and generalizability. Potential confounders such as menopausal status, vitamin D level, calcium intake, physical activity, comorbidities, and medication use were not accounted for, and lumbar spine BMD may have been influenced by degenerative changes that can artifactually elevate measurements in older adults.
Conclusion
Low bone mass was highly prevalent in this cohort at both the lumbar spine and femoral neck. Site-specific differences were observed, with a greater prevalence of osteopenia at the femoral neck and a higher proportion of osteoporosis at the lumbar spine. Femoral neck bone mineral density (BMD) declined significantly with age. Female sex was independently associated with lower lumbar spine BMD, while higher body mass index (BMI) was positively associated with BMD at both skeletal sites. These results support the routine evaluation of both lumbar spine and hip dual-energy X-ray absorptiometry (DXA) results, recommend careful interpretation of lumbar values in older adults, and highlight the need for targeted osteoporosis risk assessment and prevention strategies in older women and individuals with lower BMI.
Funding:
No funding sources
Conflict of interest:
None declared
Ethical approval:
The study was approved by the Institutional Ethics Committee.
References
- Cosman F, de Beur SJ, LeBoff MS, et al. Clinician’s Guide to Prevention and Treatment of Osteoporosis. Osteoporosis International 25 (2014): 2359-2381.
- LeBoff MS, Greenspan SL, Insogna KL, et al. The Clinician’s Guide to Prevention and Treatment of Osteoporosis. Osteoporosis International 33 (2022): 2049-2102.
- Salari N, Ghasemi H, Mohammadi L, et al. The Global Prevalence of Osteoporosis in the World: A Comprehensive Systematic Review and Meta-Analysis. Journal of Orthopaedic Surgery and Research 16 (2021): 609.
- Wu AM, Bisignano C, James SL, et al. Global, Regional, and National Burden of Bone Fractures in 204 Countries and Territories, 1990-2019: A Systematic Analysis from the Global Burden of Disease Study 2019. The Lancet Healthy Longevity 2 (2021): e580-e592.
- Curry SJ, Krist AH, Owens DK, et al. Screening for Osteoporosis to Prevent Fractures: US Preventive Services Task Force Recommendation Statement. JAMA 319 (2018): 2521-2531.
- Eastell R, Rosen CJ, Black DM, et al. Pharmacological Management of Osteoporosis in Postmenopausal Women: An Endocrine Society Clinical Practice Guideline. The Journal of Clinical Endocrinology & Metabolism 104 (2019): 1595-1622.
- Qiao D, Li Y, Liu X, et al. Association of Obesity with Bone Mineral Density and Osteoporosis in Adults: A Systematic Review and Meta-Analysis. Public Health 180 (2020): 22-28.
- Lee SE, Park JH, Kim KA, et al. Discordance in Bone Mineral Density between the Lumbar Spine and Femoral Neck is Associated with Renal Dysfunction. Yonsei Medical Journal 63 (2022): 133.
- Shoback D, Rosen CJ, Black DM, et al. Pharmacological Management of Osteoporosis in Postmenopausal Women: An Endocrine Society Guideline Update. The Journal of Clinical Endocrinology & Metabolism 105 (2020): 587-594.
- Dong Y, Kang H, Peng R, et al. Global, Regional, and National Burden of Low Bone Mineral Density from 1990 to 2019: Results from the Global Burden of Disease Study 2019. Frontiers in Endocrinology 13 (2022): 870905.
- WHO Study Group on Assessment of Fracture Risk, et al. Assessment of Fracture Risk and its Application to Screening for Postmenopausal Osteoporosis. World Health Organization (1994).
- Akkawi I, Zmerly H. Osteoporosis: Current Concepts. Joints 6 (2018): 122-127.
- Zeng Q, Li N, Wang Q, et al. The Prevalence of Osteoporosis in China, a Nationwide, Multicenter DXA Survey. Journal of Bone and Mineral Research 34 (2019): 1789-1797.
- Nahar K, Bhuiyan MM, Munir MS, et al. Association between Body Mass Index and Bone Mineral Density in Patients Referred for Dual-Energy X-Ray Absorptiometry Scan in INMAS, Sylhet. Bangladesh Journal of Nuclear Medicine 22 (2019): 108-113.
- Cawthon PM, Ewing SK, McCulloch CE, et al. Loss of Hip BMD in Older Men: The Osteoporotic Fractures in Men (MrOS) Study. Journal of Bone and Mineral Research 24 (2009): 1728-1735.
- Tenne M, McGuigan F, Besjakov J, et al. Degenerative Changes at the Lumbar Spine—Implications for Bone Mineral Density Measurement in Elderly Women. Osteoporosis International 24 (2013): 1419-1428.
- Lloyd JT, Alley DE, Hawkes WG, et al. Body Mass Index is Positively Associated with Bone Mineral Density in US Older Adults. Archives of Osteoporosis 9 (2014): 175.
- Begum RA, Ali L, Akter J, et al. Osteopenia and Osteoporosis among 16-65 Year Old Women Attending Outpatient Clinics. Journal of Community Health 39 (2014): 1071-1076.
- Lelijveld N, Musyoki E, Adongo SW, et al. Relapse and Post-Discharge Body Composition of Children Treated for Acute Malnutrition Using a Simplified, Combined Protocol: A Nested Cohort from the ComPAS RCT. PLOS ONE 16 (2021): e0245477.
- Piñar-Gutierrez A, García-Fontana C, García-Fontana B, et al. Obesity and Bone Health: A Complex Relationship. International Journal of Molecular Sciences 23 (2022): 8303.
- Johansson H, Kanis JA, Odén A, et al. Impact of Femoral Neck and Lumbar Spine BMD Discordances on FRAX Probabilities in Women: A Meta-Analysis of International Cohorts. Calcified Tissue International 95 (2014): 428-435.