Yelei Wang1,2, Anqi Jiang1-4, Ying Shen1-4, Yao Zhang1,2, Xizheng Zhang1,2, Jiayu Wei1,2, Qian Liu1-4*
1Department of Oncology, Wujin Hospital Affiliated with Jiangsu University, Changzhou, Jiangsu Province 213017, China.
2School of Life Science, Jiangsu University, Zhenjiang, Jiangsu 212013, China
3Department of Oncology, The Wujin Clinical College of Xuzhou Medical University, Changzhou, Jiangsu Province, China.
4Changzhou Key Laboratory of Molecular Diagnostics and Precision Cancer Medicine / Wujin Institute of Molecular Diagnostics and Precision Cancer Medicine of Jiangsu University, Changzhou, Jiangsu Province, China.
*Corresponding Author: Qian Liu, Department of Oncology, Wujin Hospital Affiliated with Jiangsu University, Changzhou, Jiangsu Province
Received: 30 June 2026; Accepted: 07 July 2026; Published: 20 July 2026
Objective: Colorectal cancer (CRC) is a highly prevalent malignancy, and TNM staging fails to fully capture tumor heterogeneity and prognostic variability. This study aimed to construct a Wnt/β-catenin pathway-related prognostic model by integrating single-cell RNA sequencing (scRNA-seq) and bulk RNA-seq data for improved risk stratification and therapeutic guidance.
Methods: scRNA-seq datasets (GSE231559, GSE289314) were processed using Seurat for quality control, clustering, and cell annotation. CellChat was used to infer intercellular communication, and GSVA quantified Wnt/β-catenin pathway activity to identify pathway-associated genes. WGCNA was applied to detect co-expression modules related to pathway activation. Candidate genes were derived by intersecting scRNA-seq differentially expressed genes and WGCNA modules. We subsequently developed a predictive signature using machine-learning approaches in the TCGA cohort and validated in GEO datasets. Its prognostic independence, immune microenvironment associations, and drug sensitivity were evaluated.
Results: A total of 76,549 cells were analyzed, revealing diverse tumor and stromal populations. Wnt/β-catenin signaling showed a stromal-to-immune activation gradient, with fibroblasts as key regulators. A WGCNA tan module strongly correlated with pathway activity. Integration yielded 361 candidate genes. An elastic net (α = 0.3) model performed best (C-index = 0.598) and significantly stratified survival outcomes (p < 0.001), acting as an independent prognostic factor (HR = 2.725, p < 0.001). High-risk patients exhibited an immunosuppressive phenotype, higher TIDE scores, and increased sensitivity to EGFR inhibitors.
Conclusion: The Wnt/β-catenin-related model enables robust patient stratification in CRC and offers insights into tumor immune status and therapeutic responsiveness, supporting its potential utility in precision oncology.
Colorectal cancer; Single-cell RNA sequencing; Wnt/β-catenin; Prognostic risk model; Immunotherapy response; Tumor microenvironment; Drug sensitivity
Colorectal cancer articles; Single-cell RNA sequencing articles; Wnt/β-catenin articles; Prognostic risk model articles; Immunotherapy response articles; Tumor microenvironment articles; Drug sensitivity articles
Introduction
Colorectal cancer (CRC) ranks as the third most common cancer and the second leading cause of cancer-related death globally, with over 1.9 million new cases and 900,000 deaths annually [1]. At present, clinical decision-making and prognostic evaluation rely mainly on the TNM staging system [2-5]; however, this system does not adequately reflect tumor heterogeneity, and patients at the same stage often exhibited strikingly different clinical courses and treatment responses [6,7]. Thus, there is an urgent need for risk models that enable precise prognostic stratification and guide individualized therapy. scRNA-seq has provided unprecedented resolution for dissecting tumor heterogeneity, successfully delineating epithelial-mesenchymal transition, tumor stem cell heterogeneity, and immune infiltration patterns in CRC [8-12]. Cell communication tools such as CellChat can systematically map ligand-receptor interactions between tumor cells and microenvironmental components [11]. However, the limited sample size and absence of long-term follow-up data in scRNA-seq necessitate integration with bulk RNA-seq cohorts to bridge molecular features and clinical outcomes. Prognostic risk models integrating multi-omics and clinical data can achieve accurate risk stratification for cancer patients, and machine learning algorithms have greatly improved their predictive performance and clinical applicability [13-15]. This study aimed to integrate scRNA-seq and bulk RNA-seq data to construct a Wnt/β-catenin-related prognostic risk model for CRC. We characterized cellular heterogeneity and communication networks in the tumor microenvironment, identified pathway-associated genes, built and validated the prognostic model, and analyzed its associations with clinicopathological features, immune microenvironment, and drug sensitivity.
Materials and Methods
Preprocessing of scRNA-seq data, dimensionality reduction and clustering, and cell type annotation
The scRNA-seq datasets GSE231559 and GSE289314 were analyzed using R (v4.1.2) and Seurat (v4). Low-quality cells with fewer than 50 detected genes or mitochondrial gene content >15% were removed. Data were normalized using the LogNormalize method, and 2,000 highly variable genes were identified using the vst method [16-19]. PCA and Harmony correction were performed, and [20] significant principal components identified by JackStraw analysis were used for downstream clustering. Cells were clustered using the SNN graph method (resolution = 0.6) and visualized by t-SNE [16,17,19]. Marker genes were identified using FindAllMarkers (|log2FC| > 1, adjusted p < 0.05), and cell types were annotated using SingleR with multiple reference datasets [21].
Construction of the cell communication network and visualization of signaling pathway enrichment
CellChat was used to construct cell-cell communication networks for normal and tumor tissues separately [22]. Based on CellChatDB.human and the human PPI network, communication probabilities were estimated and low-confidence interactions supported by fewer than 10 cells were excluded. Interaction networks and signaling pathway enrichment were visualized using circle plots, communication plots, and bubble plots.
Single-cell gene set variation analysis (GSVA) and differential gene expression screening
ssGSEA was performed using the GSVA package[23]. The Wnt/β-catenin signaling pathway gene set from MSigDB was used to calculate pathway activity scores for each cell, which were visualized by FeaturePlot and VlnPlot. Cells were divided into high- and low-activity groups according to the median score. Differentially expressed genes (DEGs) were identified using the Wilcoxon rank-sum test with thresholds of |log2FC| > 1 and adjusted p < 0.05.
Weighted gene co-expression network analysis (WGCNA)
WGCNA (v1.72) was used to construct the gene co-expression network[24,25]. Log2-transformed tumor expression data were analyzed, and genes with standard deviation >0.5 were retained. After outlier removal, the soft-threshold power was set to 7 according to the scale-free topology criterion (R² > 0.8). Co-expression modules were identified using TOM-based hierarchical clustering and dynamic tree cutting, and similar modules were merged. Module eigengenes were correlated with Wnt/β-catenin pathway activity to identify key modules and genes.
Multi-omics integration for candidate gene screening and construction/validation of the prognostic prediction model
The overlap between scRNA-seq DEGs and WGCNA core module genes was defined as the candidate gene set. TCGA samples with survival time ≥30 days were used as the training cohort, and GSE40967 served as the validation cohort. Univariate Cox regression (p < 0.05) identified prognosis-related genes, followed by construction of prognostic models using Enet, SuperPC, and Ridge algorithms. Model performance was evaluated using the C-index, and the Enet model (alpha = 0.3) with the highest mean C-index was selected. Patients were divided into high- and low-risk groups according to the median risk score, and survival differences were assessed by Kaplan–Meier analysis and log-rank testing.
Assessment of the independent prognostic value of the risk score and its association with clinical characteristics
Univariate and multivariate Cox regression analyses were performed in the TCGA cohort to evaluate the independent prognostic value of the risk score together with clinicopathological variables. Time-dependent ROC curves and AUC values were used to assess predictive performance for 1-, 3-, and 5-year overall survival. Circos plots and chi-square tests were used to evaluate associations between risk groups and clinical characteristics.
GO, KEGG, and GSEA enrichment analyses
GO and KEGG enrichment analyses were performed using enrichGO and enrichKEGG with adjusted p < 0.05 and q < 0.05 [26,27]. For GSEA, genes ranked by log2 fold change between high- and low-risk groups were analyzed with 1,000 permutations using public GO gene sets as references. The top significantly enriched pathways were visualized.
Analysis of immune cell infiltration, correlation with risk score, and TIDE immunotherapy score
Immune infiltration estimated by CIBERSORT, risk scores, and TIDE scores were integrated[28]. Only tumor samples with CIBERSORT p < 0.05 were included. Differences in immune cell infiltration between risk groups were compared using Wilcoxon rank-sum tests, and Spearman correlation analysis was used to evaluate associations between immune cells and risk score. TIDE scores between groups were compared using violin plots and statistical testing.
Prediction and differential analysis of drug sensitivity
Drug sensitivity analysis was performed using the GDSC2 database. Risk grouping and drug sensitivity data were matched, missing values were removed, and sensitivity values were log2(x + 1)-transformed. Wilcoxon rank-sum tests were used to identify differential drug sensitivity between risk groups, and drugs with p < 0.001 were considered significant.
Results
Quality control, dimensionality reduction, clustering, and cell type annotation of scRNA-seq data from normal and tumor colon tissues
To develop a prognostic risk model for precise prognostic stratification and early identification of recurrence risk in CRC, scRNA-seq analysis was first performed to characterize the cellular composition of normal and tumor tissues. After stringent quality control, 76,549 high-quality cells and 22,323 genes were retained from 107,706 cells (Figure S1A). Sequencing-depth correlation analysis demonstrated a positive correlation between RNA counts and detected genes, and a negative correlation with mitochondrial gene proportion, indicating reliable data quality (Figure S1B). Based on expression variance, 2,000 highly variable genes were identified for downstream analysis (Figure S1C). PCA revealed clear transcriptomic separation between normal and tumor tissues (Figure S2A). The PCA loading plot and heatmap showed the major genes contributing to the principal components (Figure S2B, C), while JackStraw analysis confirmed the significance of the first 20 principal components (Figure S2D). Using these components, graph-based clustering identified 29 transcriptionally distinct cell clusters with clear separation in t-SNE space (Figure 1A). The cluster marker heatmap further demonstrated cluster-specific gene expression patterns (Figure 1B). SingleR annotation based on the Human Cell Atlas identified multiple immune, stromal, and epithelial-related cell populations (Table S1). Quantitative analysis showed marked differences in cellular composition between normal and tumor tissues (Figure 1C). Tumor tissues exhibited increased proportions of epithelial cells and CD4+ T cells, whereas neurons, fibroblasts, and endothelial cells were markedly reduced, indicating substantial remodeling of the CRC tumor microenvironment. Overall, these findings established a high-quality single-cell atlas of CRC and provided an important cellular and molecular basis for subsequent prognostic model construction.
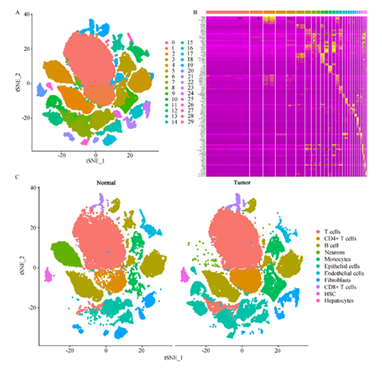
Figure 1: scRNA-seq reveals cellular heterogeneity between normal and tumor samples.
- t-SNE-based visualization of cell clustering. The first 20 principal components after Harmony correction were used for t-SNE dimensionality reduction, and cells were colored according to clusters identified by FindClusters (resolution = 0.6).
- Heatmap of cluster marker genes. The expression patterns of the top 10 differentially expressed genes in each cluster are shown, with a color gradient from blue (low expression) to red (high expression), highlighting the transcriptional features of distinct cell subpopulations.
- Comparison of cell-type composition between normal and tumor groups. The left panel shows the cellular composition of normal tissue, and the right panel shows the cellular composition of tumor tissue, illustrating changes in the immune cell landscape within the tumor microenvironment.
Cell-cell communication analysis based on CellChat
Database annotation showed that secreted signaling was the dominant ligand–receptor interaction type (61.8%), followed by extracellular matrix–receptor interactions (21.7%) and direct cell-cell contact (16.5%), with 73% of pathways consistent with KEGG annotations (Figure S3A). Network analysis of 11 major cell types revealed that, in normal tissue, epithelial cells served as the main ligand source and communicated with at least 10 target cell populations, forming a broad intercellular network (Figure S3B, C). In tumor tissue, the communication network was remodeled: epithelial cells retained ligand-secretion activity, fibroblasts became aberrantly activated, and hepatocytes, hematopoietic stem cells, and B cells were no longer detected in the network (Figure S3D, E). At the pathway level, normal tissue showed a simplified signaling pattern dominated by the GDF15-TGFBR2 axis, with MIF-(CD74+CXCR4) as the most frequent ligand-receptor pair (Figure 2A). In tumor tissue, the ligand repertoire expanded, with fibroblast-derived WNT5A and its receptor FZD4 emerging alongside GDF15-TGFBR2, forming two parallel signaling axes corresponding to GDF and non-canonical ncWNT pathways (Figure 2B). Globally, the dominant interaction pair shifted from immune-related MIF-(CD74+CXCR4) to MDK-NCL, accompanied by loss of immune-regulatory pairs such as MIF-ACKR3 and CXCL12-CXCR4. Overall, these results indicate marked remodeling of cell-cell communication in the CRC microenvironment, characterized by enhanced pro-tumor signaling and impaired immune regulation.
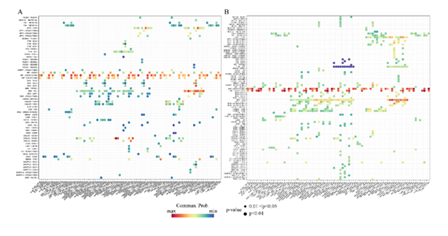
Figure 2: Analysis of intercellular interaction networks.
- Bubble plot of cell-cell communication in normal tissue. Bubble size indicates the number of ligand-receptor interaction pairs, and color intensity represents communication strength (communication probability). The x-axis denotes sending cell types, and the y-axis denotes receiving cell types, providing a panoramic view of intercellular signaling in normal tissue.
- Bubble plot of cell-cell communication in tumor tissue. The bubble size and color visualize the intercellular signaling network in the tumor microenvironment, with the x-axis indicating sender cells and the y-axis indicating receiver cells, enabling the identification of tumor-specific communication features and potential therapeutic targets.
Spatial heterogeneity and cell type-specific activation of Wnt/β-catenin signaling in the tumor microenvironment
Mapping ssGSEA-derived Wnt/β-catenin activity scores onto the t-SNE embedding revealed that pathway activity was highly heterogeneous and unevenly distributed across the tumor microenvironment, with a distinct spatial pattern (Figure 3A). Stratified analysis by cell type displayed a pronounced pathway-specific pattern, fibroblasts exhibited the highest pathway activity score (0.231), followed by hepatocytes (0.192) and endothelial cells (0.164), whereas epithelial cells (0.155) and neurons (0.141) manifested intermediate activity (Figure 3B, Table S2). In contrast, classical Wnt signaling activity was generally low in immune cells. Monocytes had a score of 0.103, and the scores of CD4+ T cells, CD8+ T cells, total T cells, HSCs, and B cells were all below 0.10, with B cells exhibiting the lowest score (0.037). These results indicate that activation of the canonical Wnt signaling pathway in the CRC microenvironment follows a clear stromal-to-immune gradient of decline, and that fibroblasts are the central cellular carriers of pathway activation, consistent with their functional remodeling during tumor progression and upregulation of the ligand WNT5A. In addition, to pinpoint key driver genes regulating Wnt/β-catenin signaling, we calculated expression differences across all genes between the high-score and low-score groups, removed weakly differential genes with limited biological relevance, and retained only genes with both biological and statistical significance (Table S3). Collectively, these data reveal a stromal-to-immune gradient of Wnt/β-catenin activation in the CRC microenvironment, with fibroblasts as the core carriers matching WNT5A upregulation, and key driver gene identification enables mechanistic dissection.
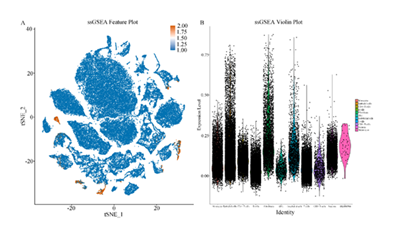
Figure 3: Distribution of Wnt/β-catenin signaling pathway activity in single-cell data.
- Spatial distribution of Wnt/β-catenin pathway activity scores calculated by ssGSEA on the t-SNE map. The color gradient from blue (low enrichment) through white (moderate enrichment) to orange (high enrichment) indicates the activity level of the gene set across cells.
- Violin plot showing the distribution of Wnt/β-catenin pathway activity across different cell types.
WGCNA identifies Wnt/β-catenin pathway-related core modules
To discern core modules related to the Wnt/β-catenin pathway, the raw mRNA expression data were quality controlled and filtered. Missing values, duplicate genes, normal samples, and low-variance genes were removed to obtain a standardized tumor-sample expression matrix, which was matched to the ssGSEA scoring file to define the qualified dataset for WGCNA. The filtered gene expression matrix was used for sample hierarchical clustering, and a sample dendrogram was generated. Outliers were removed by setting a cut height, eliminating their influence on subsequent network construction. The qualified samples were then reclustered, and a sample dendrogram-trait heatmap was generated based on the ssGSEA scores to visually display the relationship between sample clustering and Wnt/β-catenin pathway activity (Figure S4A). To construct a scale-free co-expression network, the fit of soft-threshold powers from 1 to 20 was evaluated and a soft-threshold selection plot was generated. The optimal soft-threshold power satisfying the scale-free network criterion (R2 ≥ 0.8) was successfully determined, ensuring accurate network construction (Figure 4A). Based on the TOM dissimilarity matrix, all genes were hierarchically clustered to generate a gene dendrogram (Figure S4B). Dynamic tree cutting was then applied to determine initial co-expression modules, and the gene dendrogram with module annotations was completed (Figure S4C). Clustering of module eigengenes was performed to generate a module eigengene dendrogram, and a merge threshold of 0.2 was used to combine redundant modules with highly similar expression patterns (Figure 4B), resulting in 19 stable gene co-expression modules (Table S4). Correlation analysis between module eigengenes and pathway activity scores suggested that the tan module had the strongest positive correlation with Wnt/β-catenin pathway activity (r = 0.70, p < 0.0001) (Figure 4C). After calculating module significance, defined as the average association between all genes in a module and the pathway activity score, the tan module still retained high module significance (Figure S4D), substantiating at the gene level that it represents a core functional unit in the Wnt/β-catenin-related regulatory network. In conclusion, the scale-free co-expression network constructed by WGCNA identified the tan module as having the strongest positive correlation with Wnt/β-catenin pathway activity and high module significance, confirming it as the core functional unit in the regulatory network of this pathway.
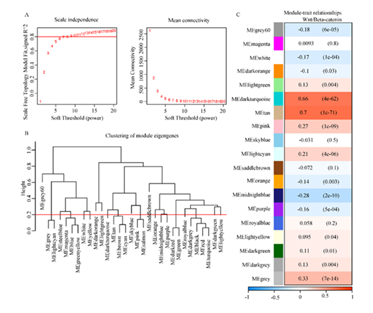
Figure 4: WGCNA results.
- Soft-threshold selection plot. The left panel shows the scale-free topology fit index (signed R²) across different power values, and the right panel shows changes in mean connectivity. The red dashed line indicates the target fit threshold (R² = 0.80), and the red annotation marks the corresponding power value of 7, which was selected as the optimal soft threshold for constructing a scale-free network.
- Dendrogram of module eigengenes (MEs). Hierarchical clustering was performed based on the correlation distance among module eigengenes, and the red horizontal line indicates the module merging threshold (MEDissThres = 0.2). This plot was used to identify similar modules and guide subsequent module merging.
- Module-trait association heatmap. The correlations between co-expression modules and the ssGSEA score of the Wnt/β-catenin pathway are shown. The values in the heatmap indicate correlation coefficients and corresponding P values. Color intensity reflects the strength of the correlation (blue, negative correlation; red, positive correlation), facilitating the identification of modules significantly associated with the target trait.
Integration of scRNA-seq and WGCNA to screen key genes and construct the prognostic model
To build a risk model with robust prognostic discrimination, the intersection of DEGs from scRNA-seq and WGCNA module genes yielded a key candidate gene set comprising 361 genes (Figure 5A, Table S5). Based on this gene set, univariate Cox regression in the TCGA training cohort further identified 35 genes significantly associated with prognosis (p < 0.05) (Figure 5B, Table S6). We then constructed several machine-learning models, including Enet, SuperPC, and Ridge. The C-index heatmap indicated that the Enet [alpha = 0.3] model performed best in both the training and validation cohorts (mean C-index = 0.598) and was selected as the final predictive model (Figure 5C). Based on the risk score derived from this model, patients in the TCGA and GEO cohorts were stratified into high- and low-risk groups. Survival analyses revealed that overall survival was significantly shorter in the high-risk group than in the low-risk group (p < 0.001) (Figure 5D, E), verifying the model's prognostic discrimination and robustness. In sum, the risk score developed by integrating genes identified through the intersection of scRNA-seq and WGCNA data and based on the optimal elastic network model can significantly distinguish between high- and low-risk patients in terms of overall survival, thereby validating the model’s favorable prognostic discriminatory power and robustness.
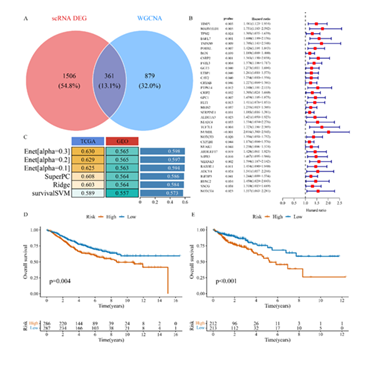
Figure 5: Screening of key prognostic genes and construction of the prognostic model.
- Venn diagram of key gene screening, showing the overlap between genes identified by single-cell differential expression analysis and those from the key WGCNA module.
- Forest plot of univariate Cox regression analysis. This plot displays genes significantly associated with overall survival among the intersecting genes. The hazard ratio and 95% confidence interval for each gene are represented by squares and horizontal lines, respectively.
- Heatmap comparing the performance of prognostic modeling algorithms. Multiple feature-selection and regression algorithms, together with ensemble strategies, were used to construct prognostic models, and their C-index values were evaluated in the training and validation sets. Color intensity indicates the magnitude of the C-index.
- Overall survival analysis in the TCGA cohort. Patients were stratified into high-risk and low-risk groups based on the median risk score. The risk table below the survival curve shows the number of patients at risk at each time point.
- Overall survival analysis in the GEO validation cohort. Patients were stratified into high-risk and low-risk groups based on the median risk score. The risk table below the survival curve shows the number of patients at risk at each time point.
Validation of the independent prognostic value and clinical utility of the risk score
To validate the reliability of the risk score as a clinical prognostic indicator, univariate Cox regression uncovered that clinical stage (HR = 2.374, p < 0.001) and risk score (HR = 2.621, p < 0.001) were significant risk factors for overall survival (Figure 6A). In multivariate Cox regression, after adjustment for age, sex, and clinical stage, the risk score remained an independent prognostic factor (HR = 2.725, p < 0.001), and age and clinical stage also remained independently prognostic (Figure 6B). These findings indicate that the risk score has prognostic value beyond traditional clinicopathological features. ROC curve analysis revealed that for 3-year overall survival prediction (Figure 6C), the TNM clinical stage, the established gold standard for tumor prognostic stratification, achieved the best discriminative performance with an AUC of 0.770. The established risk score model yielded an AUC of 0.629, which outperformed that of age (AUC = 0.553) and sex (AUC = 0.521) for survival prediction. Time-dependent ROC analysis further demonstrated favorable performance for 1-year, 3-year, and 5-year survival prediction, with AUC values of 0.640, 0.629, and 0.662, respectively (Figure 6D), collectively affirming that the risk score has prognostic stratification capacity. Comparative analysis of clinicopathological features between the high- and low-risk groups (212 and 213 cases, respectively) using the chi-square test yielded no significant differences in age, sex, or distant metastasis (M stage) distribution (all p > 0.05). In contrast, lymph node metastasis (N stage), depth of invasion (T stage), and clinical stage differed significantly between the groups, with significant differences in N stage (p < 0.001), T stage (p < 0.01), and clinical stage (p < 0.05). The proportions of patients with N2 disease, T3/T4 disease, and advanced clinical stage (stage III+IV) were markedly higher in the high-risk group (Figure 6E). These findings suggest that the high-risk group is strongly associated with more invasive and advanced pathological features, indicating that the risk score not only stratifies prognosis but also reflects tumor progression and malignant biological behavior.
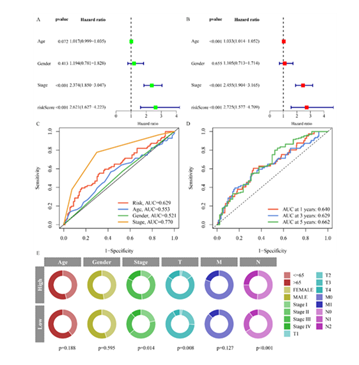
Figure 6: Validation of the independence of the prognostic model and assessment of its clinical utility.
- Forest plot of univariate Cox regression analysis showing the hazard ratios (HRs) and 95% confidence intervals of each variable. Green squares indicate HR estimates, horizontal lines indicate the 95% confidence intervals, and the dashed line marks HR = 1 (null effect).
- Forest plot of multivariate Cox regression analysis showing the independent HRs and 95% confidence intervals of each variable after adjustment for other covariates.
- Comparison of ROC curves for risk score and clinical features. The red curve represents the risk score, whereas the other colored curves represent different clinical features. Comparison of the AUC values was used to evaluate the relative performance of the risk score versus clinical variables in predicting survival outcomes; a higher AUC indicates better predictive ability.
- ROC curves of the risk score for 1-, 3-, and 5-year survival prediction. The red, blue, and green curves represent the 1-, 3-, and 5-year predictions, respectively.
- Circos plot showing the relationship between clinical characteristics and risk groups. Colors represent different clinical feature values, and sector size indicates sample proportion. P values are annotated to assess the statistical association between each clinical feature and the risk group.
Biological functions and signaling pathway enrichment of prognostic genes, and functional features of the high- and low-risk groups
To define the biological processes and key signaling pathways involved in the prognostic genes and to explore molecular functional heterogeneity between the high- and low-risk groups, GO enrichment analysis uncovered that the prognostic genes were significantly enriched in extracellular matrix organization and extracellular structure organization, as well as in processes related to collagen fibril organization, cell-matrix adhesion, chemotaxis, tissue development, and regulation of angiogenesis (Figure 7A, Table S7). These findings suggest that these genes primarily exert biological functions through regulation of extracellular matrix remodeling, cell adhesion and migration, tissue development and differentiation, and related signaling pathways. KEGG enrichment analysis further identified 42 significantly enriched pathways, with core pathways concentrated in metabolism and signal transduction (Figure 7B, Table S8), several of which are related to the Wnt/β-catenin pathway. the Cytoskeleton in muscle cells pathway forms a bidirectional regulatory loop with the canonical Wnt/β-catenin signaling [29-31], and the PI3K-Akt signaling pathway has a direct bidirectional positive feedback regulatory relationship with the canonical Wnt/β-catenin pathway [32-34]. Finally, GSEA risk-group analysis indicated functional heterogeneity between the high- and low-risk groups (Figure 7C and D, Table S9). The high-risk group was significantly enriched in pathways related to regulation of the actin cytoskeleton, integrin signaling, ECM-receptor interaction, phagosome, focal adhesion, and the PI3K-Akt signaling pathway, all of which are mainly involved in cell adhesion, extracellular matrix remodeling, immune-inflammatory responses, and proliferative signal transduction. In contrast, the low-risk group was significantly enriched in pathways associated with maintenance of cellular structural homeostasis and protein digestion and absorption, suggesting that the low-risk phenotype is closely linked to cytoskeletal stability, normal extracellular matrix assembly, and basal metabolic balance. These results indicate that the molecular differences underlying risk stratification are mainly driven by abnormal activation of pathological pathways and preservation of physiologic homeostatic pathways.
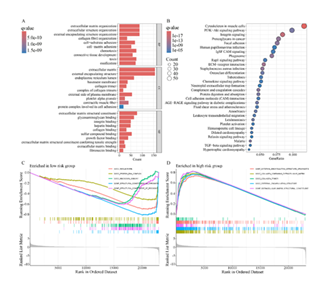
Figure 7: Functional enrichment analysis of differentially expressed genes between the high- and low-risk groups.
- GO enrichment bar plot showing the top 10 enriched terms, with color representing −log10(P value) and bar length representing gene count.
- KEGG pathway enrichment bubble plot showing significantly enriched signaling pathways, with emphasis on the TGF-β signaling pathway and related structural/metabolic pathways.
- GSEA plot for the low-risk group showing the top five enriched pathways, which were mainly associated with physiological functions such as maintenance of cellular structural homeostasis and protein digestion and absorption.
- GSEA plot for the high-risk group showing the top five enriched pathways, including regulation of the actin cytoskeleton, integrin signaling, ECM-receptor interaction, phagosome pathway, focal adhesion, and PI3K-Akt signaling pathway.
Association between the risk score and the tumor immune microenvironment
To further investigate the relationship between the risk score and the tumor microenvironment, Spearman correlation analysis with significance testing (p < 0.05) identified seven immune cell types significantly associated with the risk score. Naive B cells, M0 macrophages, and M1 macrophages were positively correlated, indicating that higher risk scores were associated with greater infiltration of these immune cell types. Plasma cells, resting CD4 memory T cells, activated dendritic cells, and eosinophils were negatively correlated, with plasma cells displaying the strongest negative correlation. The remaining 11 immune cell types, including CD8 T cells, activated CD4 memory T cells, and regulatory T cells, were not significantly correlated with the risk score (Figure 8A, Figure S5B). Immune infiltration analysis further showed highly significant differences in the infiltration levels of plasma cells, resting CD4 memory T cells, and M0 macrophages between the two groups; significant differences were also observed for naive B cells and activated dendritic cells, while resting NK cells, monocytes, and M1 macrophages evidenced modest but significant differences. Plasma cells and resting CD4 memory T cells were more abundant in the low-risk group, whereas M0 macrophages were markedly increased in the high-risk group (Figure 8B, Figure S5A, Table S10). Briefly, the risk score appeared to reflect distinct immune microenvironment states, with high-risk tumors tending to harbor more innate myeloid cells and low-risk tumors retaining greater adaptive immune components.
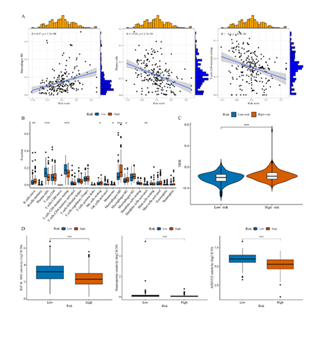
Figure 8: Association of the risk score with tumor microenvironment characteristics, immune infiltration, immunotherapy response, and drug sensitivity.
- Spearman correlation analysis between the risk score and immune cells, including macrophages M0, plasma cells, and resting memory CD4 T cells. The scatter plot shows the relationship between risk score and immune cell abundance. The blue solid line indicates the linear fit, and the gray shaded area represents the 95% confidence interval. The ρ and P values in the upper right corner denote the Spearman correlation coefficient and significance level, respectively (p < 0.05). Marginal distributions show the density of the variables.
- Boxplot comparison of immune cell abundance between different risk groups. The boxplots show the distribution of each immune cell type in the low-risk and high-risk groups, with the y-axis representing the fraction.
- Violin plot combined with boxplot showing differences in TIDE scores between low-risk and high-risk samples. The violin shape reflects the density distribution of TIDE scores, and the boxplot indicates the median and interquartile range (IQR).
- Boxplot showing the distribution and statistical differences in drug sensitivity scores between different risk groups. Only IGF1R_3801, staurosporine, and AZD1332 are shown.
Differential drug sensitivity between risk groups
To predict tumor responses to immune checkpoint inhibitor therapy, TIDE immunotherapy scores were calculated for the high- and low-risk groups (Figure 8C, Table S11). The results indicated that TIDE scores were significantly higher in the high-risk group, leading us to infer that these patients exhibit stronger immunosuppression and lower responsiveness to immune checkpoint inhibitors. To provide evidence for drug prioritization in patients at different risk levels, drug sensitivity was predicted for the high- and low-risk groups based on the GDSC2 database (Figure 8D, Table S12). A total of 41 drugs presented significant differences between the two groups (p < 0.001). Among them, 35 drugs were more sensitive in the low-risk group, including Staurosporine, PLX-4720, Dasatinib, and AZD1332, covering most targeted agents. Conversely, high-risk patients exhibited heightened sensitivity to six agents, predominantly EGFR inhibitors such as Gefitinib and Erlotinib. These findings demonstrate that high-risk patients may be less responsive to immune checkpoint inhibitors but could potentially gain greater benefit from EGFR-targeted agents, whereas low-risk patients appear more sensitive to a broader range of targeted drugs.
Discussion
This study integrated scRNA-seq and bulk RNA-seq data to construct a Wnt/β-catenin pathway-related prognostic risk model for CRC, systematically evaluating its independent prognostic value, associations with the tumor immune microenvironment, and potential to predict drug sensitivity. By integrating two independent scRNA-seq cohorts, we established a comprehensive atlas of the CRC microenvironment, which allowed for a more nuanced characterization of cellular heterogeneity than previous single-dataset studies. However, residual batch effects may still exist despite Harmony correction. In future studies, we will perform in-house scRNA-seq and spatial transcriptome sequencing using paired tumor and paracancerous tissues from our hospital to further refine the spatial distribution characteristics and cell-cell crosstalk of Wnt/β-catenin pathway activation. The discrimination efficiency of the risk score for 3-year overall survival (AUC = 0.629) was lower than that of the TNM staging system, which is expected given TNM's decades of clinical validation. Notably, the risk score is an independent prognostic factor beyond clinical stage and can provide complementary prognostic information for patients within the same stage. Another notable limitation is the lack of in vitro or in vivo validation regarding the predicted drug sensitivities. While bioinformatics analyses suggest differential responses to EGFR inhibitors, experimental confirmation using patient-derived organoids (PDOs) or xenografts is required to translate these findings into clinical practice.
In future research, we will first perform in vitro and in vivo drug sensitivity experiments using CRC cell lines, patient-derived organoids, and xenograft models to verify the differences in drug sensitivity between high- and low-risk groups. Subsequently, we will cooperate with clinical departments to supplement clinical cohort validation of the model's predictive efficiency for immunotherapy outcomes.
Conclusion
In conclusion, by integrating scRNA-seq and bulk transcriptomic analyses, we constructed and validated a Wnt/β-catenin-related prognostic risk model for colorectal cancer. This model showed stable and independent prognostic value across training and validation cohorts, effectively stratifying patients by survival risk. Beyond prognosis, the model reflected clinicopathological aggressiveness, immune microenvironment remodeling, immunotherapy responsiveness, and differential drug sensitivity. In summary, our single-cell-informed Wnt/β-catenin signature provides a robust framework for prognostic stratification in CRC. By linking pathway activation to immune exclusion and differential drug sensitivity, this model offers a translational avenue for identifying patients who may benefit from EGFR-targeted therapies or require alternative immunomodulatory strategies.
Acknowledgments: We thank the Gene Expression Omnibus (GEO) and The Cancer Genome Atlas (TCGA) Database for sharing a large amount of data.
Funding statement: This research project was funded by the National Natural Science Foundation of China [grant number 81872275]; by Changzhou High-Level Medical Talents Training Project [No: 2022CZBJ110]; by Open Project of Jiangsu Provincial Key Laboratory of Xuzhou Medical University [XZSYSKF2023034].
Conflicts of interest statement: The authors declare no conflicts of interest.
Author contributions: YW and QL contributed to the conception, design and overall framework of the study; QL provided financial support for this research. YW and QL were responsible for data analysis, result interpretation and core methodological construction of the study. AJ and YS provided critical and constructive discussions throughout the analysis process,and offered valuable methodological suggestions for the optimization of analytical strategies and in-depth interpretation of research results. YW completed the data visualization, original manuscript drafting and systematic content revision. YZ, XZ and JW participated in the critical review and editing of the manuscript for important intellectual content and put forward targeted revision opinions for the manuscript. QL supervised the whole research process and reviewed and approved the final version of the manuscript. All authors have read and approved the final submitted manuscript and agreed to be accountable for all aspects of the work in ensuring that questions related to the accuracy or integrity of any part of the work are appropriately investigated and resolved.
References
- Sung H, Ferlay J, Siegel RL, et al. Global Cancer Statistics 2020: GLOBOCAN Estimates of Incidence and Mortality Worldwide for 36 Cancers in 185 Countries. CA Cancer J Clin 71 (2021): 209-249.
- Jin M, Frankel WL. Lymph Node Metastasis in Colorectal Cancer. Surg Oncol Clin N Am 27 (2018): 401-412.
- Asare EA, Grubbs EG, Gershenwald JE, et al. Setting the 'stage' for Surgical Oncology Fellows: Pierre Denoix and TNM Staging. J Surg Oncol 119 (2019): 823.
- Amin MB, Greene FL, Edge SB, et al. The Eighth Edition AJCC Cancer Staging Manual: Continuing to Build a Bridge from a Population-Based to a More 'Personalized' Approach to Cancer Staging. CA Cancer J Clin 67 (2017): 93-99.
- Weiser MR. AJCC 8th Edition: Colorectal Cancer. Ann Surg Oncol 25 (2018): 1454-1455.
- Mlecnik B, Bifulco C, Bindea G, et al. Multicenter International Society for Immunotherapy of Cancer Study of the Consensus Immunoscore for the Prediction of Survival and Response to Chemotherapy in Stage III Colon Cancer. J Clin Oncol 38 (2020): 3638-3651.
- Luo XJ, Zhao Q, Liu J, et al. Novel Genetic and Epigenetic Biomarkers of Prognostic and Predictive Significance in Stage II/III Colorectal Cancer. Mol Ther 29 (2021): 587-596.
- Wang M, Deng C, Yang C, et al. Unraveling Temporal and Spatial Biomarkers of Epithelial-Mesenchymal Transition in Colorectal Cancer: Insights into the Crucial Role of Immunosuppressive Cells. J Transl Med 21 (2023): 794.
- Zhao F, Chen M, Wu T, et al. Integration of Single-Cell and Bulk RNA Sequencing to Identify Distinct Tumor Stem Cells and Construct a Novel Prognostic Signature for Evaluating Prognosis and Immunotherapy in LUAD. J Transl Med 23 (2025): 222.
- Liu J, Yao L, Yang Y, et al. A Novel Stemness-Related lncRNA Signature Predicts Prognosis, Immune Infiltration and Drug Sensitivity of Clear Cell Renal Cell Carcinoma. J Transl Med 23 (2025): 238.
- Tan Z, Chen X, Zuo J, et al. Comprehensive Analysis of scRNA-Seq and Bulk RNA-Seq Reveals Dynamic Changes in the Tumor Immune Microenvironment of Bladder Cancer and Establishes a Prognostic Model. J Transl Med 21 (2023): 223.
- Zhang X, Wang WB, Cai XY, et al. MNDA Promotes Immunosuppression in Microsatellite Instability-High Colorectal Cancer by Facilitating PMN-MDSC Infiltration via H3K18 Lactylation. J Transl Med 23 (2025): 1049.
- Tran D, Nguyen H, Pham VD, et al. A Comprehensive Review of Cancer Survival Prediction Using Multi-Omics Integration and Clinical Variables. Brief Bioinform 26 (2025): bbaf150.
- Cai Z, Poulos RC, Liu J, et al. Machine Learning for Multi-Omics Data Integration in Cancer. iScience 25 (2022): 103798.
- Al-Tashi Q, Saad MB, Muneer A, et al. Machine Learning Models for the Identification of Prognostic and Predictive Cancer Biomarkers: A Systematic Review. Int J Mol Sci 24 (2023): 7781.
- Stuart T, Butler A, Hoffman P, et al. Comprehensive Integration of Single-Cell Data. Cell 177 (2019): 1888-1902.e21.
- Stuart T, Satija R. Integrative Single-Cell Analysis. Nat Rev Genet 20 (2019): 257-272.
- Butler A, Hoffman P, Smibert P, et al. Integrating Single-Cell Transcriptomic Data Across Different Conditions, Technologies, and Species. Nat Biotechnol 36 (2018): 411-420.
- Hao Y, Hao S, Andersen-Nissen E, et al. Integrated Analysis of Multimodal Single-Cell Data. Cell 184 (2021): 3573-3587.e29.
- Korsunsky I, Millard N, Fan J, et al. Fast, Sensitive and Accurate Integration of Single-Cell Data with Harmony. Nat Methods 16 (2019): 1289-1296.
- Aran D, Looney AP, Liu L, et al. Reference-Based Analysis of Lung Single-Cell Sequencing Reveals a Transitional Profibrotic Macrophage. Nat Immunol 20 (2019): 163-172.
- Jin S, Guerrero-Juarez CF, Zhang L, et al. Inference and Analysis of Cell-Cell Communication Using CellChat. Nat Commun 12 (2021): 1088.
- Hänzelmann S, Castelo R, Guinney J. GSVA: Gene Set Variation Analysis for Microarray and RNA-Seq Data. BMC Bioinformatics 14 (2013): 7.
- Zhang B, Horvath S. A General Framework for Weighted Gene Co-Expression Network Analysis. Stat Appl Genet Mol Biol 4 (2005): Article17.
- Langfelder P, Horvath S. WGCNA: An R Package for Weighted Correlation Network Analysis. BMC Bioinformatics 9 (2008): 559.
- Kanehisa M, Furumichi M, Sato Y, et al. KEGG: Integrating Viruses and Cellular Organisms. Nucleic Acids Res 49 (2020): D545-D551.
- Subramanian A, Tamayo P, Mootha VK, et al. Gene Set Enrichment Analysis: A Knowledge-Based Approach for Interpreting Genome-Wide Expression Profiles. Proc Natl Acad Sci U S A 102 (2005): 15545-15550.
- Newman AM, Liu CL, Green MR, et al. Robust Enumeration of Cell Subsets from Tissue Expression Profiles. Nat Methods 12 (2015): 453-457.
- Sl L, Aj C, Rt M. Wnt/Fz Signaling and the Cytoskeleton: Potential Roles in Tumorigenesis. PubMed (2009): 19365405.
- Akiyama T, Kawasaki Y. Wnt Signalling and the Actin Cytoskeleton. Oncogene 25 (2006): 7538-7544.
- Thorpe CJ, Schlesinger A, Bowerman B. Wnt Signalling in Caenorhabditis elegans: Regulating Repressors and Polarizing the Cytoskeleton. Trends Cell Biol 10 (2000): 10-17.
- Chen P, Shi P, Du G, et al. Wnt/β-Catenin, Carbohydrate Metabolism, and PI3K-Akt Signaling Pathway-Related Genes as Potential Cancer Predictors. J Healthc Eng 2019 (2019): 9724589.
- Tomar VS, Patil V, Somasundaram K. Temozolomide Induces Activation of Wnt/β-Catenin Signaling in Glioma Cells via PI3K/Akt Pathway: Implications in Glioma Therapy. Cell Biol Toxicol 36 (2020): 273-278.
- Chandra V, Fatima I, Manohar M, et al. Inhibitory Effect of 2-(Piperidinoethoxyphenyl)-3-(4-Hydroxyphenyl)-2H-Benzo(b)Pyran (K-1) on Human Primary Endometrial Hyperplasial Cells Mediated via Combined Suppression of Wnt/β-Catenin Signaling and PI3K/Akt Survival Pathway. Cell Death Dis 5 (2014): e1380.