Jiaming Fu1#, Guangxin Hu2#, Zijing Wang3, Jieni Li4, Wentao Hu2#, Junyi Fu2*
1Guangdong Pharmaceutical University, Guangzhou, Guangdong, China. 510006.
2Department of Neurology, Institute of Neuroscience, Key Laboratory of Neurogenetics and Channelopathies of Guangdong Province and Ministry of Education of China, The Second Affiliated Hospital of Guangzhou Medical University, Guangzhou, Guangdong, China. 510260.
3College of Clinical Medicine, Guilin Medical University, Guilin, Guangxi, China, 541001.
4College of Clinical Medicine, Nanchang Medical College, Nanchang, Jiangxi, China, 330052.
*Corresponding Author: Junyi Fu at Department of Neurology, The Second Affiliated Hospital of Guangzhou Medical University, Guangzhou, Guangdong, China. 510260.
#These authors contributed equally to this work.
Received: 22 July 2026; Accepted: 28 July 2026; Published: 06 August 2026
Background: Dizziness is a common symptom with diverse etiologies, and its prevalence increases with age. Emerging evidence indicates that systemic inflammatory processes might contribute to the development of dizziness. Nevertheless, the association between dizziness and integrated hematologic inflammatory markers has not been thoroughly investigated. Objective: This study aims to assess the relationship between inflammatory markers and dizziness. Methods: This population-based cross-sectional analysis utilized data from the National Health and Nutrition Examination Survey (NHANES) conducted between 1999 and 2004. The study population consisted of 6,393 individuals aged over 40 years old. Seven inflammation-related biomarkers included monocyte-to-lymphocyte ratio (MLR), systemic inflammation response index (SIRI), C-reactive protein-to-albumin ratio (CAR), aggregate index of systemic inflammation (AISI), neutrophil-to-lymphocyte ratio (NLR), platelet-to-lymphocyte ratio (PLR), and systemic immune-inflammation index (SII), which were computed from standard complete blood counts. Analytical approaches included weighted logistic regression, restricted cubic spline (RCS) models, threshold effect evaluation, subgroup stratification, and receiver operating characteristic (ROC) curve analyses to determine the relationship between these biomarkers and self-reported dizziness. Results: After adjusting for potential confounders, elevated levels of MLR, SIRI, AISI, and CAR were significantly associated with increased odds of dizziness. RCS and threshold effect analysis revealed a significant non-linear relationship between SIRI and dizziness, with a significant inflection point at 1.2526. Subgroup analyses indicated stronger associations among females, non-smokers, and individuals with higher educational attainment. Among all markers, SIRI demonstrated the highest area under the ROC curve (AUC = 0.5532), although overall predictive performance remained modest. Conclusion: Several CBC-derived inflammatory biomarkers (MLR, SIRI, and AISI) were independently associated with dizziness in a general adult population. These findings support the involvement of systemic inflammation in dizziness and suggest that such biomarkers may serve as adjunctive tools for risk identification. Further longitudinal studies are needed to clarify causality and underlying mechanisms.
NHANES, Dizziness, Inflammation, Monocyte-to-lymphocyte ratio, Systemic inflammation response index, Aggregate index of systemic inflammation.
NHANES articles; Dizziness articles; Inflammation articles; Monocyte-to-lymphocyte ratio articles; Systemic inflammation response index articles; Aggregate index of systemic inflammation articles.
1. Introduction
Dizziness is one of the most common symptoms globally, with an estimated lifetime prevalence ranging from 15% to 35% in the general population, and its prevalence increases with advancing age [1, 2]. Beyond its impact on daily functioning and quality of life, dizziness has been associated with heightened mortality risks linked to cardiovascular conditions and diabetes mellitus [3, 4]. As the incidence of dizziness continues to rise, particularly among aging populations, it is imperative to identify reliable predictive biomarkers to facilitate early intervention and management.
Dizziness is a multifactorial symptom that can result from a variety of conditions, including cerebrovascular disease, vestibular system diseases, multiple sclerosis, migraine, depression, anxiety, and adverse effects of medications [5, 6]. Among the proposed mechanisms, inflammation has emerged as an important contributor to dizziness pathogenesis. For example, in patients with vestibular neuritis, viral or immune-mediated inflammation can directly impair vestibular structures, leading to symptoms such as dizziness and nausea [7]. Similarly, in systemic lupus erythematosus, immune complex deposition can damage the vestibular system, resulting in balance disorders [8]. These findings suggest that inflammatory processes may be centrally involved in both the onset and persistence of dizziness, positioning inflammatory biomarkers as valuable candidates for both diagnostic refinement and targeted interventions.
In recent years, inflammatory biomarkers have gained increasing attention in clinical research. Composite hematologic indices such as the monocyte-to-lymphocyte ratio (MLR), systemic inflammation response index (SIRI), C-reactive protein-to-albumin ratio (CAR), aggregate index of systemic inflammation (AISI), neutrophil-to-lymphocyte ratio (NLR), platelet-to-lymphocyte ratio (PLR), and systemic immune-inflammation index (SII) which have been increasingly recognized as reliable surrogates for systemic inflammation and as predictors of diverse pathological outcomes [9-14]. SIRI has demonstrated significant associations with periodontitis in population-based analyses [15], while NLR, MLR, and PLR have been reported as prognostic markers in patients with advanced kidney disease [16], and CAR values have been previously linked to poor outcomes in neurological disorders such as stroke and cognitive decline [17]. Compared to single blood cell parameters, these composite indices provide a more integrated reflection of inflammatory status and have demonstrated superior predictive value in inflammatory and metabolic conditions [18]. Given their ability to capture systemic inflammatory burden, it is plausible that these indices may also serve as early indicators for inflammation-related dizziness.
However, the potential link between dizziness and comprehensive blood count (CBC)-based inflammatory indices remains largely unexamined. To address this research gap, we performed a cross-sectional investigation utilizing data from the National Health and Nutrition Examination Survey (NHANES). The primary objective was to assess the association between dizziness and a range of inflammation-related hematological markers. Our study may support early identification and clinical evaluation of individuals at risk for dizziness.
2. Materials and Methods
2.1 Data Source and Study Population
This study utilized cross-sectional data from the National Health and Nutrition Examination Survey (NHANES, 1999-2004). NHANES employs a stratified multistage probability sampling design, covering non-hospitalized populations in the United States. The dataset includes demographic, dietary, physical examination, laboratory testing, and questionnaire information. The NHANES survey was approved by the Ethics Review Board of the National Center for Health Statistics, and all participants provided informed consent prior to enrollment. All NHANES data are publicly available on the website (https://www.cdc.gov/nchs/nhanes).
Following a comprehensive screening process of the NHANES dataset, a cohort of 31,126 subjects spanning the years 1999 to 2004 was initially deemed eligible for inclusion in this investigative study. The analysis excluded individuals with missing data on dizziness symptoms (n = 21,176). In addition, participants with missing lymphocyte count (n = 1,255), serum albumin (n = 469), and C-reactive protein (CRP) (n = 1) were also removed. Pregnant individuals were excluded to avoid potential confounding (n = 7). Furthermore, we excluded participants with missing information on key covariates, including education level (n = 21), marital status (n = 281), poverty income ratio (PIR) (n = 749), drinking status (n = 384), Hypertension status (n = 38), diabetes status (n = 136), smoking status (n = 8), and body mass index (BMI) (n = 208). After implementing all exclusion criteria, the final analytic sample comprised 6,393 individuals. A detailed flow diagram of the participant selection process is provided in Figure 1.
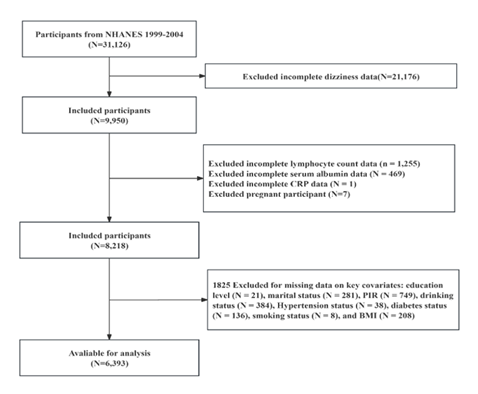
Figure 1: A flowchart showing the selection of study participants.
2.2 Study Variables
The main dependent variable in this analysis was dizziness, as assessed through participant self-report in the NHANES survey. Individuals were classified as experiencing dizziness based on their response (“yes” or “no”) to the question: “During the past 12 months, have you had a problem with dizziness, lightheadedness, feeling as if you are going to pass out or faint, unsteadiness or imbalance?” It is critically important to emphasize that participation in this survey was exclusively restricted to individuals aged over 40 years old. This age-based inclusion criterion was intentionally implemented to align with the research objectives of investigating adult-specific health patterns, thereby ensuring biological homogeneity and epidemiological relevance in the analytical cohort.
The main independent variables were inflammation-related biomarkers calculated from complete blood count and serum biochemical measurements. The CBC parameters (neutrophil count, lymphocyte count, monocyte count and platelet count) were measured using the Beckman Coulter automated hematology analyzer, which applies impedance-based techniques for cell counting and sizing. For serum albumin, values were obtained using the bromocresol purple dye-binding method, as part of the NHANES Standard Biochemistry Profile. All blood samples were drawn during morning sessions following an overnight fast to minimize variability in biomarker levels. To capture the systemic inflammatory burden, the following composite indices were calculated:
MLR = monocyte count / lymphocyte count
SIRI = (neutrophil count × monocyte count) / lymphocyte count
CAR = C-reactive protein / albumin
AISI = (neutrophil count × platelet count × monocyte count) / lymphocyte count
NLR = neutrophil count / lymphocyte count
PLR = platelet count / lymphocyte count
SII = (platelet count × neutrophil count) / lymphocyte count
These markers, derived from absolute cell counts and biochemical parameters, provide comprehensive insight into the balance of immune cell subpopulations and the acute-phase inflammatory response. All measurements adhered to NHANES' rigorous quality control standards, which include standardized procedures, regularly calibrated instruments, and periodic proficiency testing to ensure data reliability and reproducibility. To explore potential dose–response relationships, all inflammatory biomarkers were treated as continuous variables and further stratified into quartiles.
2.3 Selection of Covariates
Utilizing existing literature and clinical insights, we incorporated a range of covariates that could potentially influence the association between inflammation-related biomarkers and dizziness. The continuous variables included age, poverty-to-income ratio (PIR), and body mass index (BMI, kg/m²). The categorical variables included sex, race/ethnicity, education level, and marital status, smoking status (at least 100 cigarettes in a lifetime?), drinking status (had at least 12 alcohol drinks/1 yr?), diabetes history (have you been told by a doctor or health professional that you have diabetes?), hypertension history (have you been told by a doctor or health professional that you have hypertension, also called high blood pressure?).
2.4 Statistical Analysis
To summarize participant characteristics, descriptive analyses were carried out, presenting categorical variables as frequencies and percentages, while continuous variables were expressed as means accompanied by standard errors (SE). Differences between groups were assessed using analysis of variance (ANOVA) for continuous variables and chi-square tests for categorical data. Given the stratified, multistage sampling framework employed in NHANES, all analyses incorporated appropriate sampling weights to correct for unequal selection probabilities, oversampling, and participant nonresponse. This weighting approach enhances the generalizability and precision of the results. To explore the association between inflammatory markers and dizziness, we constructed weighted binary logistic regression models, treating dizziness as the dependent variable. Inflammatory biomarkers including MLR, SIRI, AISI, CAR, NLR, PLR, and SII were included as independent variables. We developed three models: Model 1 provided unadjusted estimates; Model 2 adjusted for demographic variables including age, sex, and ethnicity; and Model 3 included additional adjustments for socioeconomic and health-related confounders, namely educational attainment, marital status, BMI, poverty income ratio (PIR), smoking habits, alcohol consumption, as well as diabetes and hypertension status. The results were presented as odds ratios (ORs) with corresponding 95% confidence intervals (CIs). Furthermore, restricted cubic spline (RCS) modeling and threshold analyses were employed to explore non-linear and dose-dependent associations between each biomarker and dizziness. Stratified analyses were also conducted to evaluate potential effect modification across subgroups. Statistical interaction was tested to assess heterogeneity among subgroups, and forest plots were created to visualize subgroup-specific ORs and confidence intervals. All statistical procedures were implemented using R (version 4.3.2) and EmpowerStats (version 4.2), with statistical significance defined as a two-sided p-value < 0.05.
3. Results
3.1 Baseline Characteristics
A total of 6,393 adult participants were included in the analysis, among whom 1,645 individuals (25.73%) reported experiencing dizziness. Table 1 summarizes the sociodemographic and behavioral attributes of the study population, categorized based on the presence or absence of dizziness. The prevalence of dizziness was notably higher among older, economically disadvantaged, and well-educated Non-Hispanic White females who were married and had a history of cigarette use, excessive alcohol intake, hypertension, or diabetes mellitus. Additionally, individuals in the dizziness group exhibited significantly increased mean values of several inflammation-related biomarkers, including MLR (0.31 ± 0.005), SIRI (1.41 ± 0.03), CAR (0.13 ± 0.01), AISI (380.50 ± 10.74), NLR (2.39 ± 0.04), and SII (635.19 ± 11.39). In contrast, no statistically significant difference was observed in PLR levels between the two groups (P = 0.84).
Table 1: Baseline characteristics of the study population.
|
Characteristics |
With dizziness |
Without dizziness |
P-value |
|
(N = 1,645) |
(N = 4,748) |
||
|
Age (year), mean ± SE |
59.74 ± 0.46 |
55.53 ± 0.26 |
<0.0001 |
|
PIR, mean ± SE |
2.64 ± 0.08 |
3.43 ± 0.05 |
<0.0001 |
|
Sex (n, %) |
<0.0001 |
||
|
Male |
634 (38.56%) |
2,403 (50.61%) |
|
|
Female |
1,011 (61.44%) |
2,345 (49.39%) |
|
|
Race (n, %) |
0.0431 |
||
|
Mexican American |
68 (4.11%) |
220 (4.63%) |
|
|
Other Hispanic |
92 (5.60%) |
201 (4.23%) |
|
|
Non-Hispanic White |
1,271 (77.29%) |
3,776 (79.52%) |
|
|
Non-Hispanic Black |
133 (8.09%) |
397 (8.36%) |
|
|
Other Race |
81 (4.91%) |
154 (3.25%) |
|
|
Education (n, %) |
<0.0001 |
||
|
Less Than High School |
438 (26.62%) |
812 (17.11%) |
|
|
High School Diploma (including GED) |
484 (29.40%) |
1,181 (24.87%) |
|
|
More Than High School |
723 (43.98%) |
2,755 (58.02%) |
|
|
Marital Status (n, %) |
<0.0001 |
||
|
Married |
960 (58.38%) |
3,319 (69.90%) |
|
|
Widowed |
264 (16.06%) |
373 (7.85%) |
|
|
Divorced |
238 (14.45%) |
533 (11.23%) |
|
|
Separated |
44 (2.65%) |
107 (2.25%) |
|
|
Never married |
89 (5.41%) |
262 (5.51%) |
|
|
Living with partner |
50 (3.05%) |
154 (3.26%) |
|
|
Smoking status (n, %) |
0.0161 |
||
|
Yes |
935 (56.84%) |
2,490 (52.44%) |
|
|
No |
710 (43.16%) |
2,258 (47.56%) |
|
|
Drinking status (n, %) |
<0.0001 |
||
|
Yes |
1,034 (62.86%) |
3,402 (71.66%) |
|
|
No |
611 (37.14%) |
1,346 (28.34%) |
|
|
Hypertension (n, %) |
<0.0001 |
||
|
Yes |
848 (51.52%) |
1,607 (33.85%) |
|
|
No |
797 (48.48%) |
2,141 (66.15%) |
|
|
Diabetes (n, %) |
<0.0001 |
||
|
Yes |
269 (16.35%) |
391 (8.23%) |
|
|
No |
1,376 (83.65%) |
4,357 (91.77%) |
|
|
BMI, mean ± SE |
28.67 ± 0.22 |
28.58 ± 0.15 |
0.6925 |
|
MLR, mean ± SE |
0.31 ± 0.005 |
0.29 ± 0.002 |
0.0032 |
|
SIRI, mean ± SE |
1.41 ± 0.03 |
1.25 ± 0.01 |
<0.0001 |
|
CAR, mean ± SE |
0.13 ± 0.01 |
0.10 ± 0.003 |
<0.0001 |
|
AISI, mean ± SE |
380.50 ± 10.74 |
335.45 ± 4.60 |
0.0001 |
|
NLR, mean ± SE |
2.39 ± 0.04 |
2.22 ± 0.02 |
0.0001 |
|
PLR, mean ± SE |
142.99 ± 1.74 |
142.63 ± 1.22 |
0.8441 |
|
SII, mean ± SE |
635.19 ± 11.39 |
589.33 ± 6.09 |
0.0004 |
Note: Values are weighted mean ± SE or weighted % (95% confidence interval). P values are weighted Table 1 (continued)
3.2 Correlation between Inflammatory Biomarkers and Dizziness
The partial correlation among inflammatory biomarkers and dizziness both in continuous and categorical analyses are illustrated in Table 2. As the continuous analysis demonstrated, positive associations were consistently found between SIRI, MLR, AISI, NLR and dizziness in Models 1–3 (all P<0.05). A strong association between the prevalence of dizziness and CAR was observed in Models 1 (OR= 1.8726, 95% CI: 1.3438–2.6096, P= 0.0006) and Model 2(OR= 1.6066, 95% CI: 1.1940–2.1618, P=0.0034), however, this relationship diminished in Model 3 (P=0.0689). Furthermore, there were no relationships between PLR, SII and dizziness in model 1 (P>0.05), suggesting limited diagnostic utility in this context. Among all biomarkers analyzed, MLR emerged as the most robust predictor of dizziness in Model 3 (OR = 2.0474, 95% CI: 1.1886–3.5268, P = 0.0163).
Table 2: Association between inflammatory biomarkers and dizziness.
|
Exposure |
MODEL1 |
MODEL2 |
MODEL3 |
|
OR (95%CI) P-value |
OR (95%CI) P-value |
OR (95%CI) P-value |
|
|
MLR |
2.4256 (1.4137, 4.1621) 0.0025 |
2.2053 (1.2614, 3.8555) 0.0086 |
2.0474 (1.1886, 3.5268) 0.0163 |
|
Q1 |
reference |
reference |
reference |
|
Q2 |
1.0247 (0.8327, 1.2610) 0.8187 |
1.1068 (0.8858, 1.3830) 0.3779 |
1.1526 (0.9380, 1.4164) 0.1903 |
|
Q3 |
1.0984 (0.9272, 1.3012) 0.2839 |
1.1709 (0.9775, 1.4026) 0.0956 |
1.1882 (0.9894, 1.4268) 0.0783 |
|
Q4 |
1.2948 (1.0493, 1.5979) 0.0206 |
1.3374 (1.0594, 1.6883) 0.0196 |
1.3464 (1.0786, 1.6807) 0.0153 |
|
p for trend |
p<0.0109 |
0.0102 |
0.0112 |
|
SIRI |
1.1989 (1.1163, 1.2876) <0.0001 |
1.1851 (1.0984, 1.2787) 0.0001 |
1.1111 (1.0271, 1.2020) 0.0148 |
|
Q1 |
reference |
reference |
reference |
|
Q2 |
1.0829 (0.8759, 1.3389) 0.4660 |
1.1266 (0.9174, 1.3835) 0.2631 |
1.1137 (0.8893, 1.3947) 0.3582 |
|
Q3 |
1.3767 (1.1070, 1.7121) 0.0064 |
1.4215 (1.1349, 1.7806) 0.0042 |
1.3254 (1.0502, 1.6727) 0.0268 |
|
Q4 |
1.5579 (1.3033, 1.8622) <0.0001 |
1.5820 (1.2983, 1.9276) 0.0001 |
1.3674 (1.1197, 1.6700) 0.0056 |
|
p for trend |
p<0.0001 |
p<0.0001 |
0.0018 |
|
CAR |
1.8726 (1.3438, 2.6096) 0.0006 |
1.6066 (1.1940, 2.1618) 0.0034 |
1.2825 (0.9928, 1.6567) 0.0689 |
|
Q1 |
reference |
reference |
reference |
|
Q2 |
1.1359 (0.9195, 1.4034) 0.2442 |
1.0731 (0.8647, 1.3317) 0.5259 |
1.0466 (0.8447, 1.2968) 0.6808 |
|
Q3 |
1.2469 (1.0171, 1.5286) 0.0398 |
1.1180 (0.9137, 1.3680) 0.2860 |
1.0355 (0.8425, 1.2728) 0.7432 |
|
Q4 |
1.7096 (1.4225, 2.0545) <0.0001 |
1.4709 (1.2163, 1.7787) 0.0003 |
1.2647 (1.0478, 1.5265) 0.0229 |
|
p for trend |
p<0.0001 |
0.0003 |
0.0295 |
|
AISI |
1.0005 (1.0003, 1.0007) <0.0001 |
1.0004 (1.0002, 1.0007) 0.0005 |
1.0003 (1.0000, 1.0005) 0.0460 |
|
Q1 |
reference |
reference |
reference |
|
Q2 |
1.3522 (1.0676, 1.7126) 0.0164 |
1.3647 (1.0743, 1.7336) 0.0154 |
1.3005 (1.0229, 1.6534) 0.0432 |
|
Q3 |
1.2544 (1.0381, 1.5157) 0.0238 |
1.2637 (1.0243, 1.5591) 0.0357 |
1.1539 (0.9270, 1.4363) 0.2135 |
|
Q4 |
1.5645 (1.2836, 1.9068) 0.0001 |
1.5357 (1.2381, 1.9048) 0.0004 |
1.3101 (1.0541, 1.6283) 0.0235 |
|
p for trend |
0.0001 |
0.0008 |
0.0564 |
|
NLR |
1.1132 (1.0634, 1.1653) <0.0001 |
1.0913 (1.0382, 1.1471) 0.0015 |
1.0619 (1.0059, 1.1210) 0.0397 |
|
Q1 |
reference |
reference |
reference |
|
Q2 |
1.0424 (0.8119, 1.3384) 0.7461 |
1.1122 (0.8719, 1.4187) 0.3978 |
1.1261 (0.8887, 1.4270) 0.3362 |
|
Q3 |
1.2636 (0.9983, 1.5993) 0.0586 |
1.2975 (1.0266, 1.6399) 0.0361 |
1.2853 (1.0106, 1.6348) 0.0529 |
|
Q4 |
1.2503 (1.0244, 1.5259) 0.0337 |
1.2394 (0.9992, 1.5374) 0.0589 |
1.1777 (0.9386, 1.4775) 0.1717 |
|
p for trend |
0.0046 |
0.015 |
0.0787 |
|
PLR |
1.0001 (0.9991, 1.0011) 0.8438 |
0.9996 (0.9986, 1.0006) 0.3999 |
1.0002 (0.9993, 1.0011) 0.6831 |
|
Q1 |
reference |
reference |
reference |
|
Q2 |
0.9615 (0.7840, 1.1792) 0.7081 |
0.9616 (0.7857, 1.1769) 0.7064 |
1.0444 (0.8599, 1.2686) 0.6654 |
|
Q3 |
0.8437 (0.6918, 1.0288) 0.1007 |
0.8298 (0.6714, 1.0257) 0.0933 |
0.9382 (0.7591, 1.1596) 0.5614 |
|
Q4 |
0.9796 (0.8091, 1.1861) 0.8338 |
0.9141 (0.7521, 1.1110) 0.3729 |
1.0661 (0.8915, 1.2748) 0.4904 |
|
p for trend |
0.5797 |
0.2322 |
0.7743 |
|
SII |
1.0003 (1.0002, 1.0004) 0.0002 |
1.0002 (1.0001, 1.0004) 0.0048 |
1.0001 (1.0000, 1.0003) 0.1071 |
|
Q1 |
reference |
reference |
reference |
|
Q2 |
0.9843 (0.7886, 1.2285) 0.8892 |
0.9920 (0.7843, 1.2548) 0.9471 |
0.9855 (0.7867, 1.2346) 0.9001 |
|
Q3 |
1.1725 (0.9596, 1.4326) 0.1273 |
1.1816 (0.9554, 1.4613) 0.1328 |
1.1698 (0.9514, 1.4383) 0.1511 |
|
Q4 |
1.1947 (0.9740, 1.4654) 0.0953 |
1.1428 (0.9196, 1.4202) 0.2368 |
1.0522 (0.8404, 1.3174) 0.6614 |
|
p for trend |
0.0384 |
0.1155 |
0.396 |
Model 1: Non-adjusted model;
Model 2: adjusted for: sex, age, race;
Model 3 adjusted for: age, sex, race, education attainment, marital status, alcohol status, smoking status, poverty income ratio, BMI, Hypertension, diabetes.
In the categorical analysis, using the lowest quartile (Q1) as the reference group, higher quartiles of several biomarkers were associated with increased dizziness risk. Significant associations were evident for SIRI in both Q3 and Q4, while elevated levels of MLR, CAR, and AISI in Q4 were also linked to greater odds of dizziness. Moreover, a clear dose–response pattern was observed, where increases in SIRI, MLR, and CAR levels corresponded with progressively higher odds ratios (P-values < 0.05). Specifically, in Model 3, Q4 of SIRI (OR = 1.3674, 95% CI: 1.1197–1.6700), MLR (OR = 1.3464, 95% CI: 1.0786–1.6807), CAR (OR = 1.2647, 95% CI: 1.0478–1.5265), LAP (OR = 1.5400, 95% CI: 1.1600–2.0500), and AISI (OR = 1.3101, 95% CI: 1.0541–1.6283) showed significant associations with dizziness when compared to the reference quartiles. These findings suggest that elevated levels of these inflammatory markers serve as independent predictors of dizziness.
Interestingly, although the continuous analysis identified a statistically significant positive relationship between NLR and dizziness, this association did not persist in the categorical analysis. There has no significant differences were observed across quartiles in either Model 2 or Model 3. This inconsistency suggests that the link between NLR and dizziness may lack stability or robustness across different analytical approaches.
To explore the relationship between inflammatory biomarkers and dizziness more comprehensively, restricted cubic spline (RCS) regression models were applied with full covariate adjustment. As shown in Figure 2, a significant positive linear association was observed between both SIRI and MLR levels and the prevalence of dizziness (p for overall effect <0.05; p for nonlinearity >0.05), suggesting the statistical significance and stability of the inflammatory- dizziness association.
To further explore this pattern, a threshold effect analysis was performed using a piecewise linear regression model (Table 3). A significant inflection point was identified at SIRI=1.2526, corroborated by a log-likelihood ratio test (P = 0.038). Below this threshold (SIRI <1.2526), SIRI was significantly associated with increased risk of dizziness (OR=1.3903, 95% CI: 1.1061–1.7474, P=0.0047), whereas the association was attenuated and non-significant above the threshold (OR=1.0553, 95% CI: 0.9811–1.1353, P=0.1343), indicating a potential saturation effect. No significant threshold effects were observed for other biomarkers.
Table 3: Threshold effect analysis of inflammatory biomarkers and dizziness.
|
Fitting by the 2-piecewise linear model |
Adjusted OR (95% CI) |
P-value |
|
Inflection point |
1.2526 |
|
|
SIRI < 1.2526 |
1.3903 (1.1061, 1.7474) |
0.0047 |
|
SIRI >= 1.2526 |
1.0553 (0.9811, 1.1353) |
0.148 |
|
p for Log-likelihood ratio |
0.038 |
adjusted for: age, sex, race, education attainment, marital status, alcohol status, smoking status, poverty income ratio, BMI, Hypertension, diabetes.
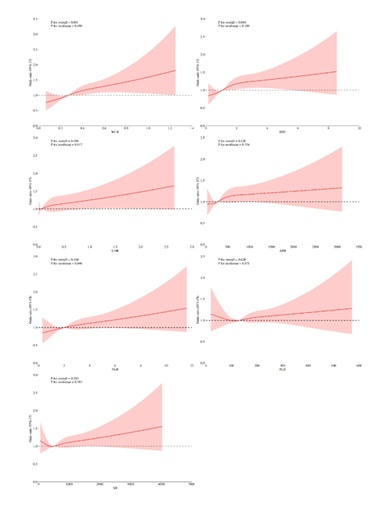
Figure 2: Restricted cubic splines of l inflammatory biomarkers and dizziness.
3.3 Subgroup and ROC Analysis
To investigate potential effect modifiers in the relationship between inflammatory biomarkers and dizziness, we conducted stratified analyses across key demographic and clinical variables, including sex, age, race/ethnicity, education level, marital status, BMI, smoking status, drinking status, and history of hypertension and diabetes (Figure 3). Interaction terms were incorporated into the regression models to evaluate the statistical significance of effect modification. Notably, significant interactions were identified for CAR and smoking status, NLR and education level, and SII and education level (all P for interaction < 0.05), indicating that the strength of the associations between these inflammatory markers and dizziness may vary across subgroups defined by these characteristics. Further subgroup analyses revealed that several inflammatory markers demonstrated stronger positive associations with dizziness in specific populations. For instance: In participants with educational attainment beyond high school, the associations between dizziness and SIRI, AISI, NLR, and SII were more pronounced (P < 0.05). Among female participants, significant associations were observed for MLR, SIRI, AISI, and NLR (P < 0.05). Among non-smokers, stronger associations were found between dizziness and both CAR and AISI (P < 0.05). These findings suggest that demographic and lifestyle factors may modulate the relationship between systemic inflammation and dizziness, emphasizing the importance of considering subgroup characteristics when evaluating potential inflammatory risk factors.
These results highlight that the link between systemic inflammation and dizziness may be influenced by specific sociodemographic and behavioral factors, underlining the necessity of incorporating subgroup-specific characteristics when assessing inflammatory biomarkers as potential predictors of dizziness.
The diagnostic performances of the eight inflammatory biomarkers for dizziness were investigated using ROC curves. The ROC curve indicated that SIRI had comparable and highest diagnostic efficacy for dizziness. (AUC: 0.5532, 95% CI: 0.5371–0.569) (Figure 4).
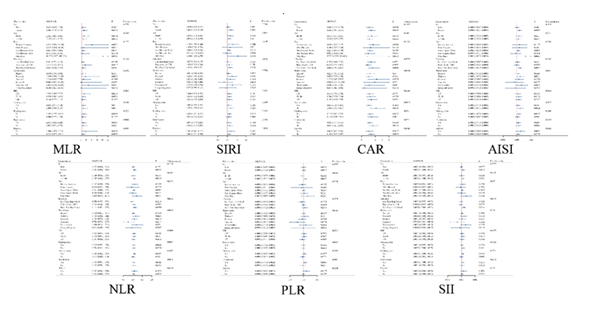
Figure 3: Subgroup analysis of the association between inflammatory biomarkers and dizziness.
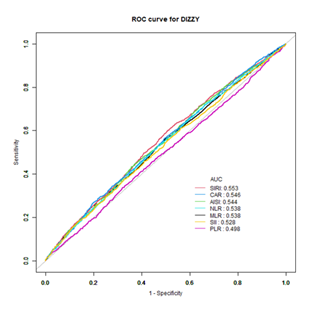
Figure 4: ROC curves and the AUC values of inflammatory biomarkers and dizziness.
4. Discussion
This cross-sectional analysis represents the first investigation to assess the association between systemic inflammatory markers and the presence of dizziness. Our findings demonstrated that elevated levels of MLR, SIRI, and AISI were positively associated with dizziness, even after adjusting for a wide range of potential confounders. Among these markers, MLR exhibited the strongest and most consistent association, indicating its potential value in reflecting low-grade systemic inflammation involved in dizziness pathophysiology. Although CAR was initially associated with dizziness, this relationship diminished after controlling covariates, indicating a lack of stability in its predictive power. This variability may, in part, be attributed to findings from our interaction analyses, which revealed a statistically significant modifying effect of smoking status on the CAR–dizziness association.
We also found a positive linear relationship between both SIRI and MLR and dizziness through RCS. In particular, the threshold analysis for SIRI revealed a significant inflection point at 1.2526, below which SIRI was strongly associated with dizziness. This suggests that low-to-moderate elevations in systemic inflammation may have a more pronounced effect on dizziness risk, whereas higher levels might reach a saturation point beyond which additional risk does not increase significantly. This nonlinear pattern suggesting that immune system activation may play a role in early stages of neurological or vestibular dysfunction, while chronic high-level inflammation might induce adaptation or compensatory mechanisms.
Inflammatory biomarkers such as the MLR and the SIRI have been associated with neurological outcomes, particularly in stroke [19]. Inflammation also plays a role in the pathophysiology of dizziness, with oxidative stress and pro-inflammatory signaling pathways contributing to chronic vestibular symptoms [20]. Patients with vestibular dysfunction frequently exhibit signs of immune or systemic involvement, suggesting that dizziness may be influenced by underlying inflammatory processes [21]. Furthermore, vestibular balance disorders have been linked to bilateral otolith dysfunction, which has been associated with dizziness symptoms even in the absence of apparent central nervous system damage [22]. Central vestibular disorders, including those affecting the brainstem and cerebellum, are also recognized contributors to dizziness, and their clinical manifestations may overlap with those of systemic inflammation [23]. In addition, functional dizziness—an increasingly acknowledged condition in clinical practice—often arises from complex interactions between physiological and psychological factors, including inflammation and heightened autonomic reactivity [24].
Subgroup analyses offered deeper insights into the heterogeneity of the observed associations. Significant interaction effects were found between CAR and smoking status, as well as between NLR and SII and educational level. These results suggest that individuals with certain behavioral or socioeconomic characteristics (such as non-smokers and those with higher educational attainment) may be more susceptible to the effects of systemic inflammation on dizziness. Previous studies have demonstrated that systemic inflammation, as measured by CRP and other biomarkers, is strongly influenced by smoking status. Specifically, current smokers tend to exhibit higher levels of inflammation than non-smokers and former smokers [25, 26]. This phenomenon occurs because dizziness in non-smokers is more likely to be exclusively mediated by inflammatory mechanisms (unconfounded by smoking-related factors), whereas in smokers, dizziness may arise from multifactorial etiologies (e.g., vasospasm, carbon monoxide toxicity) that diminish the relative contribution of inflammatory components [27]. Moreover, higher educational attainment has been associated with a stronger inflammatory response to psychological and physical stressors, possibly due to differences in lifestyle or health perception, which may increase their physiological sensitivity to systemic inflammation. Additionally, socioeconomic factors such as education level have been found to modulate inflammatory responses across the life course, with variable patterns depending on the biomarker and context, indicating that educational attainment interacts with stress and immune function in complex ways [28]. Our gender-stratified analysis revealed that MLR, SIRI, AISI and NLR were more predictive of dizziness among women. Research indicates that systemic inflammation levels such as CRP and IL-6 vary significantly with sex, with females often exhibiting elevated inflammatory markers that contribute to cognitive and neurological decline [29]. These sex-related differences in inflammatory profiles may partly stem from hormonal fluctuations, several studies demonstrate that estrogen may Toll-like receptor signaling pathways to amplify inflammatory responses [30-32].
From a clinical perspective, the ability of SIRI to differentiate dizziness was modest (AUC = 0.5532) [33]. This suboptimal performance may stem from potential model overfitting or variability in predictor stability. Moreover, the operational definition of dizziness in this analysis relied on self-reported data from the NHANES questionnaire, which may lack the diagnostic precision required for clinical classification. Nonetheless, when integrated into comprehensive, multimodal predictive frameworks, inflammatory biomarkers such as SIRI could still contribute to improving overall diagnostic accuracy.
These indices have shown predictive value in various inflammatory conditions, including cardiovascular disease [34], sarcopenia [35], psoriatic disease [36], and fatty liver disease [37]. Specifically, SII and SIRI have been associated with increased mortality risk [38] and disease severity in infections and neurovascular events [39], while CAR and SII have been explored as biomarkers distinguishing causes of vertigo [40].
More broadly, the link between systemic inflammation and vestibular or balance-related symptoms has been supported by experimental and clinical research. Cytokines such as IL-6, TNF-α, and CRP have been shown to influence neurovascular integrity and vestibular afferent function. For instance, patients with Menière’s disease and vestibular migraine demonstrate elevated TNF-α and IL-6 levels compared to controls, indicating a role of inflammation in vestibular dysfunction [41]. Chronic inflammation may impair cerebral perfusion and promote oxidative stress, as evidenced by vascular vertigo patients exhibiting significantly elevated TNF-α and IL-6 levels along with reduced antioxidant capacity [42]. Furthermore, studies using in vitro blood-labyrinth barrier models have confirmed that cytokines like TNF-α increase inner ear vascular permeability and may contribute to dizziness-related pathology [43]. Inflammatory labyrinthitis, characterized by blood-labyrinth barrier impairment, further supports a direct inflammatory mechanism contributing to vestibular dysfunction [44]. Moreover, inflammation may exacerbate central perception of dizziness in individuals with heightened interoceptive or anxiety-related responses, as supported by findings that vestibular rehabilitation can modulate oxidative stress pathways and reduce dizziness symptoms through the anti-inflammatory SIRT1 axis [45]. Finally, studies in pediatric populations show that systemic inflammatory responses, such as elevated CRP, can coincide with vestibular neuronitis and vertigo during respiratory infections [46].
localized neuroinflammation may significantly contribute to the onset and persistence of dizziness. Experimental research has demonstrated that key pro-inflammatory cytokines such as IL-1β, IL-6, and TNF-α can be upregulated in the vestibular nuclei and surrounding brainstem regions following peripheral vestibular injury [47]. These mediators not only enhance glial activation and neuronal excitability but also interfere with synaptic plasticity, a key element in the process of central vestibular compensation [48]. Additionally, microglial activation plays a central role in modulating inflammation and neuronal plasticity within the vestibular nuclei, influencing the speed and completeness of compensation [49].
Furthermore, chronic low-grade inflammation may impair the physiological process of vestibular adaptation. Vestibular compensation relies on neuroplasticity, cerebellar recalibration, and multisensory integration. However, inflammation can compromise blood–brain barrier integrity and reduce neurotrophic factor signaling like BDNF, critical for synaptic recovery and balance function [50]. Structural brain plasticity in multisensory cortices has also been observed during vestibular recovery, underlining the role of inflammation in modulating central compensation [51]. Additionally, modulation of BDNF-TrkB signaling pathways in the medial vestibular nucleus enhances neuronal survival and functional recovery [52].
5. Conclusion
Several CBC-derived inflammatory biomarkers (MLR, SIRI, and AISI) were independently associated with dizziness in a general adult population. These findings support the involvement of systemic inflammation in dizziness and suggest that such biomarkers may serve as adjunctive tools for risk identification. Further longitudinal studies are needed to clarify causality and underlying mechanisms.
Acknowledgements
We extend our gratitude to all volunteers who participated in the National Health and Nutrition Examination Survey (NHANES). We also acknowledge the National Center for Health Statistics for making the NHANES data publicly available for research purposes.
Data Availability
The data supporting the findings of this study were obtained from the National Health and Nutrition Examination Survey (NHANES), which is a publicly available dataset. The NHANES data can be accessed through the Centers for Disease Control and Prevention (CDC) website (https://wwwn.cdc.gov/Nchs/Nhanes/).
Author Contributions
Guangxin Hu and Jiaming Fu designed and conceived this study. Jiaming Fu and Zing Wang collected the data. Wentao Hu and Jieni Li analyzed the data. Guangxin Hu and Junyi Fu wroted the manuscript. Xin Yang and Junyi Fu revised the paper. Each author contributed important content during manuscript drafting or revision and accepts accountability for the overall work, and all the authors agreed on the final manuscript.
Funding
This work was supported by Guangzhou Medical Key Discipline Construction Project (2025-2027).
Declarations
Ethics Approval and Consent to Participate
This study utilized data from the National Health and Nutrition Examination Survey (NHANES), which received approval from the Ethics Review Board of the National Center for Health Statistics (NCHS). Informed consent was obtained from all participants by the NCHS during the data collection phase. The current study involved a secondary analysis of publicly available, de-identified data, for which no additional ethical approval was necessary.
Consent for Publication
Not applicable.
Conflict of Interest
The authors declare that there is no conflict of interest.
Reference
- Kroenke K, Price RK. Symptoms in the community. Prevalence, classification, and psychiatric comorbidity. Arch Intern Med 153 (1993): 2474-2480.
- Neuhauser HK. The epidemiology of dizziness and vertigo. Handb Clin Neurol 137 (2016): 67-82.
- Dros J, Maarsingh OR, Beem L, et al. Impact of dizziness on everyday life in older primary care patients: a cross-sectional study. Health Qual Life Outcomes 9 (2011): 44.
- Jang Y, Hur HJ, Park B, et al. Psychosocial Factors Associated with dizziness and chronic dizziness: a nationwide cross-sectional study. BMC Psychiatry 24 (2024): 13.
- Tusa RJ. Dizziness. Med Clin North Am 93 (2009): 263-271.
- Karatas M. Central vertigo and dizziness: epidemiology, differential diagnosis, and common causes. Neurologist 14 (2008): 355-364.
- Le TN, Westerberg BD, Lea J. Vestibular Neuritis: Recent Advances in Etiology, Diagnostic Evaluation, and Treatment. Adv Otorhinolaryngol 82 (2019): 87-92.
- Di Stadio A, Ralli M. Systemic Lupus Erythematosus and hearing disorders: Literature review and meta-analysis of clinical and temporal bone findings. J Int Med Res 45 (2017): 1470-1480.
- Sant'Ana M, Gameiro J, Costa C, et al. C-reactive protein-to-albumin ratio and six-month mortality in incident hemodialysis patients. Ren Fail 45 (2023): 2182615.
- Wang H, Guo Z, Xu Y. Association of monocyte-lymphocyte ratio and proliferative diabetic retinopathy in the U.S. population with type 2 diabetes. J Transl Med 20 (2022): 219.
- Wang RH, Wen WX, Jiang ZP, et al. The clinical value of neutrophil-to-lymphocyte ratio (NLR), systemic immune-inflammation index (SII), platelet-to-lymphocyte ratio (PLR) and systemic inflammation response index (SIRI) for predicting the occurrence and severity of pneumonia in patients with intracerebral hemorrhage. Front Immunol 14 (2023): 1115031.
- Xiu J, Lin X, Chen Q, et al. The aggregate index of systemic inflammation (AISI): a novel predictor for hypertension. Front Cardiovasc Med 10 (2023): 1163900.
- Mai R-Y, Lu T-L, Lu R-J, et al. C-Reactive Protein-Albumin Ratio (CAR): A More Promising Inflammation-Based Prognostic Marker for Patients Undergoing Curative Hepatectomy for Hepatocellular Carcinoma. Journal of Inflammation Research 17 (2024): 919-931.
- Wang C, Wu J-P, Zhou W-Q, et al. The C-Reactive Protein/Albumin Ratio as a Predictor of Mortality in Patients with HBV-Related Decompensated Cirrhosis. Clinical laboratory 65 (2019): 8.
- Luo S, Liu Z, Jiao R, et al. The associations of two novel inflammation indexes, systemic immune-inflammation index (SII) and system inflammation response index (SIRI), with periodontitis: evidence from NHANES 2009-2014. Clin Oral Investig 28 (2024): 129.
- Mureșan AV, Russu E, Arbănași EM, et al. The Predictive Value of NLR, MLR, and PLR in the Outcome of End-Stage Kidney Disease Patients. Biomedicines 10 (2022).
- Yuan J, Cheng Y, Han X, et al. Association between C-reactive protein/albumin ratio and all-cause mortality in patients with stroke: Evidence from NHANES cohort study. Nutr Metab Cardiovasc Dis 34 (2024): 2305-2314.
- Xing Y, Tian Z, Jiang Y, et al. A practical nomogram based on systemic inflammatory markers for predicting portal vein thrombosis in patients with liver cirrhosis. Ann Med 54 (2022): 302-309.
- Göçmen A, Demir TG. The Aggregate Index of Systemic Inflammation as a Predictor of Mortality in Stroke Patients. Cureus 16 (2024).
- Kao C, Tsai K-L, Cheng Y-Y, et al. Vestibular rehabilitation ameliorates chronic dizziness through the SIRT1 axis. Frontiers in Aging Neuroscience 6 (2014).
- Lee S-U, Kim H-J, Kim J-S. Bilateral Vestibular Dysfunction. Seminars in Neurology 40 (2020): 40-48.
- Grebenuk O, Svetlik M, Alifirova V, et al. Specific features of bilateral otolith manifestations in patients with vestibular balance disorder. Siberian Journal of Clinical and Experimental Medicine (2024).
- Troost BT. Dizziness and vertigo in vertebrobasilar disease. Part II. Central causes and vertebrobasilar disease. Stroke 11 (1980): 413-415.
- Brandt T, Huppert D, Strupp M, et al. Functional dizziness: diagnostic keys and differential diagnosis. Journal of Neurology 262 (2015): 1977-1980.
- Fröhlich M, Sund M, Löwel H, et al. Independent association of various smoking characteristics with markers of systemic inflammation in men. Results from a representative sample of the general population (MONICA Augsburg Survey 1994/95). European heart journal 14 (2003): 1365-1372.
- Yanbaeva DG, Dentener MA, Creutzberg EC, et al. Systemic effects of smoking. Chest 131 (2007):1557-1566.
- Rose JJ, Wang L, Xu Q, et al. Carbon Monoxide Poisoning: Pathogenesis, Management, and Future Directions of Therapy. Am J Respir Crit Care Med 195 (2017): 596-606.
- Maurel M, Castagné R, Berger E, et al. Patterning of educational attainment across inflammatory markers: Findings from a multi-cohort study. Brain Behav Immun 90 (2020): 303-310.
- Noss MM, Millwood S, Kuhlman K. Inflammation and Cognitive Functioning in Older Adults: The Role of Gender and Obesity. Innov Aging 5 (2021): 694-695.
- Kettelhut A, Bowman E, Gabriel J, et al. Estrogen May Enhance Toll-Like Receptor 4-Induced Inflammatory Pathways in People With HIV: Implications for Transgender Women on Hormone Therapy. Front Immunol 13 (2022): 879600.
- Klein SL, Flanagan KL. Sex differences in immune responses. Nat Rev Immunol 16 (2016): 626-638.
- Young NA, Wu LC, Burd CJ, et al. Estrogen modulation of endosome-associated toll-like receptor 8: an IFNα-independent mechanism of sex-bias in systemic lupus erythematosus. Clin Immunol 151 (2014): 66-77.
- Nahm FS. Receiver operating characteristic curve: overview and practical use for clinicians. Korean J Anesthesiol 75 (2022): 25-36.
- Li X, Zhang L, Du Y, et al. Association between monocyte-to-lymphocyte ratio and cardiovascular diseases: insights from NHANES data. Diabetol Metab Syndr 17 (2025): 98.
- Zhang J, Wang Y, Liu H, et al. The association between eight complete blood count-derived inflammatory markers and muscle health. Front Nutr 12 (2025): 1498757.
- Tiucă OM, Morariu SH, Mariean CR, et al. Impact of Blood-Count-Derived Inflammatory Markers in Psoriatic Disease Progression. Life (Basel) 14 (2024).
- Shen D, Cai X, Hu J, et al. Inflammatory Indices and MAFLD Prevalence in Hypertensive Patients: A Large-Scale Cross-Sectional Analysis from China. J Inflamm Res 18 (2025): 1623-1638.
- Xia Y, Xia C, Wu L, et al. Systemic Immune Inflammation Index (SII), System Inflammation Response Index (SIRI) and Risk of All-Cause Mortality and Cardiovascular Mortality: A 20-Year Follow-Up Cohort Study of 42,875 US Adults. Journal of Clinical Medicine 12 (2023).
- Fois A, Paliogiannis P, Scano V, et al. The Systemic Inflammation Index on Admission Predicts In-Hospital Mortality in COVID-19 Patients. Molecules 25 (2020).
- Şahin O, Güneş M, Dönmez R. C-reactive protein-to-albumin ratio and systemic immune-inflammatory index as potential markers in distinguishing acute cerebellar infarction from benign paroxysmal positional vertigo. Neurosciences (Riyadh) 30 (2025): 30-35.
- Monaghan NP, Shah S, Keith BA, et al. Proinflammatory Cytokine Profiles in Menière's Disease and Vestibular Migraine. Otol Neurotol 46 (2025): 88-95.
- Qian SX, Gu JX, Guan QB, et al. Serum oxidative stress, inflammatory response and platelet activation in patients with vascular vertigo. J Biol Regul Homeost Agents 33 (2019): 499-504.
- Sekulic M, Puche R, Bodmer D, et al. Human blood-labyrinth barrier model to study the effects of cytokines and inflammation. Front Mol Neurosci 16 (2023): 1243370.
- Djian C, Champion K, Lai N, et al. Infliximab for the Treatment of Inflammatory Labyrinthitis: A Retrospective Cohort Study. J Clin Med 12 (2023).
- Kao CL, Tsai KL, Cheng YY, et al. Vestibular rehabilitation ameliorates chronic dizziness through the SIRT1 axis. Front Aging Neurosci 6 (2014): 27.
- Dzięciołowska-Baran EA, Gawlikowska-Sroka A. Vertigo with a Vestibular Dysfunction in Children During Respiratory Tract Infections. Adv Exp Med Biol 858 (2015): 79-85.
- Liu F, Yuan H. Role of glia in neuropathic pain. Front Biosci (Landmark Ed) 19 (2014): 798-807.
- Rizzo FR, Musella A, De Vito F, et al. Tumor Necrosis Factor and Interleukin-1β Modulate Synaptic Plasticity during Neuroinflammation. Neural Plast (2018): 8430123.
- El Mahmoudi N, Marouane E, Rastoldo G, et al. Microglial Dynamics Modulate Vestibular Compensation in a Rodent Model of Vestibulopathy and Condition the Expression of Plasticity Mechanisms in the Deafferented Vestibular Nuclei. Cells 11 (2022).
- Mao D, He Z, Xuan W, et al. Effect and mechanism of BDNF/TrkB signaling on vestibular compensation. Bioengineered 12 (2021): 11823-11836.
- Dutia M. Mechanisms of vestibular compensation: recent advances. Current Opinion in Otolaryngology & Head and Neck Surgery 18 (2010): 420.
- Zhou L, Zhou W, Zhang S, et al. BDNF signaling in the rat cerebello‐vestibular pathway during vestibular compensation: BDNF signaling in vestibular compensation. The FEBS Journal 282 (2015).