Richard H Zander*
Missouri Botanical Garden, 4344 Shaw Blvd, St. Louis, Missouri, USA
*Corresponding author: Richard H Zander, Missouri Botanical Garden, 4344 Shaw Blvd, St. Louis, Missouri, USA
Received: 04 September 2026; Accepted: 11 September 2026; Published: 21 September 2026
Twelve genera of fossil hominins, precursors of Homo sapiens, correlate in origination with Earth’s orbital eccentricity periodicities of 1.2 Myr. This extends Vrba’s Turnover-Pulse Hypothesis of evolutionary change in African animal genera of about 1 million years in cycle to the human lineage and suggests that major climate changes potentiate major reconstitution of hominin morphology. This connection parallels in the small the Raup and Sepkoski demonstrated 26-million-year periodicity of extinction events that is paralleled by genus origination in bryophyte lineages. It suggests that different organism groups have different sensitivities to environmental disruption of cosmic origin. The analysis of hominoids was done with a specialized 12-genus hominin and hominoid data spanning 0-17 Myr and a comprehensive 50-genus hominoid timeline. The data shows multi-frequency complexity driven by interference of the 1.2 Myr long-eccentricity cycle. Alignment of the genus originations was tested against a normalized circular phase representation (θ). Eccentricity values were scaled to [0,1] interval and mapped to a 2π radian coordinate system to distinguish the repeating orbital phase rhythms from amplitude modulations. Because of the small size of the data within the 17 Myr interval (n = 9), statistical analysis via Raleigh’s test of uniformity was restricted to revealing phase coherence and non-random clustering at 1.2 Myr intervals. Poisson, cumulative distribution and Chi-Squared tests demonstrated strong periodicity (1.2 and 2.4 Myr) of 50 hominoid genera with origination across 28 Myr despite densely packed data and low, 1 Myr resolution.
Artificial intelligence; Bryophytes; Extinction; Hominins; Miocene; Orbital eccentricity; Periodicity; Phase clustering; Turnover-Pulse
Artificial intelligence articles; Bryophytes articles; Extinction articles; Hominins articles; Miocene articles; Orbital eccentricity articles; Periodicity articles; Phase clustering articles; Turnover-Pulse articles
1. Introduction
Evolutionist E. Vrba [1-3 but see 4] has suggested a Turnover-Pulse Hypothesis to explain an apparent ca. one-million-year periodicity for evolution in African fauna, focusing on ungulates but extending the hypothesis to Pliocene-Pleistocene hominins and associated mammal faunas. The claim is that major climate shifts produce bursts of speciation and extinction. Essentially, the turnover-pulse theory says that climate shifts as external forcing, not continuous biological competition, are the primary drivers of macroevolutionary turnover, resulting in pulses of origination and extinction. For review, hominoids are all apes from gibbons to humans—no tails, large brains, mobile shoulder joints, origin of extant species ca. 20 to 25 million years ago (Ma); hominids are the great apes, including humans—large bodies, complex sociality, no tails, origin 15 to 20 Ma; hominins are humans and immediate ancestors—bipedal, smaller canines, even larger brains, origin 6 to 8 Ma. Ecosystem collapses may encourage adaptive radiation and extinction as dense forests are replaced by savannah requiring deep structural transformation, for instance, from tree-dwelling apes to hominin bipedal land dwellers, precursors of Homo sapiens. Evidence of climate changes occurring at 1-million-year intervals come from both fossils and African paleolakes. The present paper identifies periodic Jupiter-Venus-Mars secular interactions as strong correlation to hominin genus origination.
1.1. Origination dates of plant genera
An ongoing study of genus origination across time has involved two lineages of mosses (Bryophyta) [5,12,17,29]. A morphological clock was established by initial segregation of larger taxa into minimally monophyletic groups, essentially of one ancestral species and a very few descendant species. The method for identifying the extant ancestor was that the ancestral species was most like an outgroup and generalist to the rest of the species in the group. Additionally, the minimally monophyletic group was monothetic in that at least the ancestor and all immediate descendants possessed the initial new traits fixed in the ancestor. Empirically, there were never more than four immediate descendants and the number of new traits per speciation events was about four. Because the number of new traits between any ancestor and one or its descendants were almost always between two and seven, evincing a strong constraint against major leaps, the evolutionary tree (a caulogram) connecting these species was statistically locked at high Bayesian support [6].
1.2. Past analyses
This leads to a physics-style unitization of taxonomic variables, a genus as minimally monophyletic group, evolutionary mass as a species description, distance as a change in description from an ancestral species to an immediate descendant species, and time as a speciation event. Powerful analyses are then available adapting formulae of classical mechanics [6,7]. Four kinds of information suggested that two bryophyte lineages followed a morphological clock in generation of their genera across 100 Myr. (1) Two minimally monophyletic groups appear to have originated during uplift of the West Indies about 45 million years ago, and by the Principle of Mediocrity, half, or 22 million years was selected as probable point of origin of the genera [8]. (2) An anchoring fossil of a related genus was noted for 66 to 84 Ma [9]. (3) A general study of fossil mosses indicated late Cretaceous as origin for modern mosses, with many modern genera identifiable about that time [10]. (4) A recent study of the age of genera in the mosses [11] suggested 27 million years as a strong estimate of genus origination periods. The figure of about 26 million years as periodicity of extinction cycles globally by Raup and Sepkoski [12,13] matched quite well with genus origination figures in the mosses [14]. Various explanations have been given, such as by Muller [15] as due to a highly eccentric orbit of a nearby but presently unsubstantiated star, “Nemesis,” and more recently by Rampino [16] and Rampino and Haggerty [17] concerning the periodic (ca. 30 Myr) passing of the Earth through the plane of the galaxy with associated disturbances in the solar system. The series of bryophyte genera on the longest connection through the evolutionary tree of the mosses studied [5,31,32] showed about five time periods, which if assigned 26 million years each, reached neatly into the late Cretaceous. That morphological clock has much the same correlation with evolution as Vrba’s Turnover-Pulse Hypothesis [1-3] but differs in acting at ca. a 26-million-year periodicity instead of a 1-Myr cycle. Details of the analysis have been published [14]. Unitization of taxonomic variables begins with standardization of the genus as a minimally monophyletic group (MMG) consisting of one ancestral species and a few immediate descendant species. Several studies have shown [5, 21-23] that the number of species in many recognized genera of fauna and flora is largely from one to seven, which when graphed show an inverse power curve, generally about:
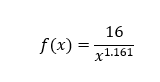
where the power of x is ln5/ln4, reflecting the Pareto ratio. While the hominins have not been examined for their possible status as minimally monophyletic groups, the small size of the genera in numbers of species suggests that they do represent what was a minimally monophyletic group, with the earliest fossil as ancestor. Because the single ancestor is the key element of an evolutionary tree, earliest date of fossil genus could be used as estimated date of evolutionary origin.
1.3. Sensitivities s to cosmic perturbation
The figure of 26 million years as extinction/origination periodicity may well apply to many groups of organisms but clearly does not fit the known fossil dating of the hominids in general and hominins in particular. This is true whether hominid genera are exactly equivalent to minimally monophyletic groups in studied plant taxa. Both hominid and genera of minimally monophyletic groups of bryophytes, in any case, are small, of one ancestral species and a few immediate descendant species. Calculations show the climate of the Earth is affected by cosmic perturbations and generally involve the eccentricity of the Earth’s orbit (is it circular or somewhat elliptical) and the obliquity of the Earth’s axis relative to its orbit. There is a 2.4-Myr orbital grand eccentricity cycle plus a long eccentricity cycle of about 1.2 Myr associated with deep sea hiatus records, circulation changes, ice volume, and carbon cycling [18-22]. The Laskar et al. [19] data provides information on the orbit (eccentricity and inclination, of 2.4 and 1.2 My periodicities) and the spin axis (obliquity and precession, with ca. 41 Kyr periodicities). The genus origination dates occur at or near large-scale reorganization of global climate associated with orbital eccentricity cycles (Table 1). What is needed to establish a clear association between biological and cosmic dates that may have causal bases requires phase tests showing clustered events, periodicity tests for significance of time intervals, and null comparisons of actual and random data. The cosmic cycles are quite stable and are commonly used for dating geological and fossil evidence of climate change. Data on orbital eccentricity (La2011) from the team led by Jacques Laskar [18,19] is valid for matching long-term variations in Earth’s climate. The Laskar La2011 data details the eccentricity shift across 50 million years. The data file for La2011 (l10a_e31l.dat) provides Earth’s orbital eccentricity over 250 Myr. It is used as orbital solutions in astrochronology, paleoclimate modeling, Milankovitch cycle research, and long-term climate forcing analysis.
1.4. Hominid origination dates
A table of the genera of hominids (Table 1) is given here with estimated dates of origin. The data are a compounding of the various estimates in the literature, including standard sources including that of Begun [23], and Almécija et al. [24,25].
Table 1: Timeline showing approximate dates of major Hominidae genus origination, connection with astronomical events, genus and lineage, taxonomic group, and major climate change and result.
|
Genus Origination |
Genus / Lineage |
Taxonomic Group |
Climatic Driver & Evolutionary Response |
|
16.3 Ma |
Stem Hylobatidae |
Lesser Apes (Gibbons) |
Mid-Miocene Cooling Step 1: The ancestral lesser ape lineage splits definitively away from Great Apes. |
|
13.6 Ma |
Kenyapithecus |
Stem Hominid Ape |
The Antarctic Glaciation Peak: Drop in sea levels. Forcing emergence of robust, thick-enameled forest floor foragers. |
|
12.6 Ma |
Sivapithecus / Pongo stem |
Orangutan Lineage (Ponginae) |
The Great Splitting Valley: Drying of Afro-Eurasian migration tracks. Splits Asian Orangutans from African lineages (Homininae). |
|
9.6 Ma |
Ouranopithecus / Nakalipithecus Histaopithecus |
Late Miocene Transitional Apes |
The Vallesian Crisis: Massive, loss of humid European canopy forest forces ground-foraging adaptations and thick tooth enamel. |
|
7.6 Ma |
Gorilla |
Great Ape (Gorillini) |
Late Miocene Aridification Pulse: Forest fragmentation in central Africa. Gorilla lineage splits from common ancestor. Possible African Orangutan. |
|
6.6 Ma |
Sahelanthropus |
Basal Transitional Hominin |
Pre-Messinian Global Chill: Evolutionary baseline split: hominin branch separates from the Chimpanzee stem. |
|
5.6 Ma |
Orrorin / Ardipithecus |
Early Bipedal Hominins |
The Messinian Salinity Crisis: Mediterranean dries triggering extreme equatorial African droughts. Earliest bipedal adaptations form. |
|
3.8 Ma |
Australopithecus |
Gracile Hominins |
Pliocene Thermal Shift: Loss of early Pliocene warmth, enhanced radiation, rise of genus Australopithecus. |
|
2.6 Ma |
Homo, Pan & Paranthropus |
Archaic Human / Robust Hominin / Chimpanzee (2.3 Ma) |
Northern Hemisphere Glaciation: Savanna permanently dominates East Africa. Australopithecus gone, splitting into tool-makers (Homo) and jaw-crushers (Paranthropus). |
|
1.8 Ma |
Homo erectus |
True Obligate Biped |
Double 405-kyr Wave Maxima: Widespread aridification. Fragile, small-bodied Homo habilis gone; global emergence of Homo erectus. |
|
1.0 Ma |
Pan diversification (Bonobo split) |
Great Ape (Pan paniscus) |
The Mid-Pleistocene Transition (MPT): Congo River cuts through during intense climate changes, permanently isolating the Bonobo lineage (Pan paniscus) to the south. |
|
0.7 Ma |
Homo heidelbergensis |
Encephalized Hominin |
MPT Glacial Lock-In: Ice age rhythms intensify from 41k to harsher 100k cycles. Paranthropus gone; massive encephalization (brain growth) pulse, archaic Homo sapiens ancestors. |
Figure 1 contrasts the evident two-million-year periodicity of gibbons and apes with that of hominins. This may be due to habitats inhabited that require different adaptations (exaptations) to climate change. Before analysis, it may be expected that bipedal hominins of Plio-Pleistocene origin are more generalist and open-habitat tolerant, thus origination events occur in post-crest phases of a periodicity chart. The great apes and gibbon, however, are forest-specialists responding to climate change with range contraction, local extinction and stasis, not periodic origination reflected in the fossil record.
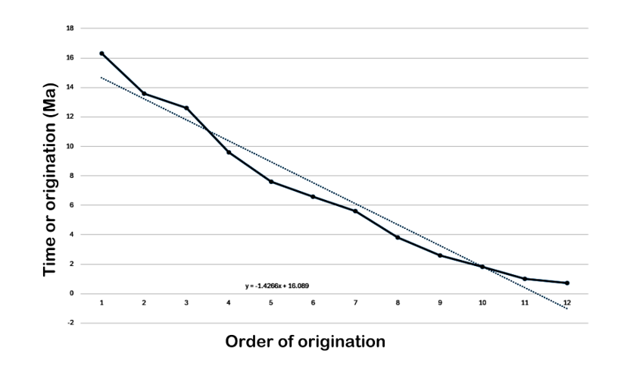
Figure 1: Twelve origination dates of gibbon, ape and hominin genera listed by time of fossil-informed date of genus origination in millions of years ago (Ma). 1 Hylobatidae (Gibbons), 2 Kenyapithecus, 3 Sivapithecus / Pongo stem, 4 Ouranopithecus / Nakalipithecus, 5 Gorilla, 6 Sahelanthropus (basal human), 7 Orrorin / Ardipithecus, 8 Australopithecus, 9 Homo & Paranthropus, 10 Homo erectus 11 Pan (& Bonbo), 12 Homo heidelbergensis. Two-million-year periodicity of apes (1-5) contrasts with 1 Myr for hominins (5-12) but is near the Excel spreadsheet linear trendline.
Although Figure 1 shows a linear relationship in genus origination, a cosmic cycle may only apply to hominins, which have a structural sensitivity. On the other hand, there are three time slots available, 8.6, 10.6 and 11.6 Mya, in which now extinct genera may be originated. The Spanish Hispanopithecus of 9.5 Ma, is a potential orangutan ancestor [25,26], while Pilobtes fits in at 11.6 and Dryopithecus at 11.8 [27]. There are other less well understood genera of Miocene apes [23,28] addressed below. The African Orangutan hypothesis [29,28] presents a more direct genetic ancestor to the human lineage than that of chimpanzee. This preserves the observation of J. Schwartz [30] that the chimpanzee is more closely related to humans by conservative, shared morphological traits. Origination of an African orangutan may be anchored at 7.6 Ma as an evolutionary response during the 9.8 Ma and 12.8 Ma cosmic valleys demonstrated below.
2. Materials and methods
Needed for statistical support for correlation of genus origination with cosmic cycles are phase tests that show clustering and periodicity tests for a significant 1.2-million-year signal at event dates. The fossil data do largely match the known 1.2 Myr long eccentricity modulation in Earth’s orbit and 2.4 grand eccentricity modulation cycles in planetary interactions demonstrated by Laskar et al. [19]. The potential association of dates of hominin genus origination (Figure 1 of turnover pulses) with dates of astronomical rhythms of long-period eccentricity cycles. The origination dates are 16.3, 13.6, 12.6, 9.6, 7.6, 6.6, 5.6, 3.8, 2.6, 1.8, 1.0, 0.7 Ma, treated as timestamps F(t) on the enclosing interval of 17 Ma of hominoid data. Software used for data analysis includes Microsoft Excel for spreadsheet analysis, PixelNeo for graphics, Desmos graphing software for data calculation and visualization, and two Artificial Intelligences (Microsoft Copilot 5.6 and Google Gemini 3.7 Flash) for Internet searches, conceptualization of the analytic method, and computations (see discussion below). Google Colab was used to produce graphics from AI-generated Python code. The hominid data are given above and the orbital eccentricity data are that of Laskar et al. [19] here identified by the filename La2011. Hominin divergence events and astronomical forcing were evaluated using the raw La2011 orbital eccentricity data over the 17 Ma interval as transformed into a continuous phase space (a complex sinusoidal curve). The raw data shows multi-frequency complexity driven by interference of the 1.2 Myr long-eccentricity cycle and 404 Kyr metronome. Alignment of the genus originations was tested against a normalized circular phase representation (θ). Eccentricity values were scaled to [0,1] interval and mapped to a 2π radian coordinate system to distinguish the repeating orbital phase rhythms from amplitude modulations. Because of the small size of the data within the 17 Myr interval (n = 9), statistical analysis via Raleigh’s test of uniformity was restricted to revealing phase coherence and non-random clustering rather than resolving frequency distinctions between 1.2 Myr cosmic cycles and 1.0 Myr turnover pulses. All phase alignments used the long-eccentricity component of the La2011 orbital solution. Obliquity data were not used because they do not show a comparable long-period cycle.
2.1 Rayleigh test for phase clustering
The test for a preferred periodicity involves choosing a range of trial periods P. For each P compute phases:
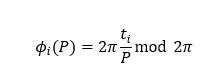
which say where in the cycle each event falls. If events are random in time, will be uniformly distributed on . but if they are phase-locked they will cluster. A Rayleigh test of cluster statistics computes the mean resultant vector:
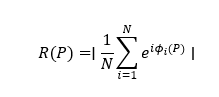
The Rayleigh test is to identify key cosmic periods. It identifies how periodicity of hominid data might be phase-locked for some selected cosmic period. The test gives Rayleigh R for candidate periods of fossil data 1 and 2 Mry, and known celestial cycles 1.2, 2.4 and 4.8 Myr. If R ≳ 0.4-0.5 then there is strong clustering, but if R ≲ 0.2, then the phase correlation is random. If R(P) is close to 0 then phases are random. If it is large, then phases cluster and we have a candidate for periodicity. P is scanned in a search for peaks in R(P), where a peak supports a cosmic causality. The Turnover-Pulse Hypothesis suggests that extinctions should be lagging indicators of the periodic driver, while genus origination pulses can be leading indicators.
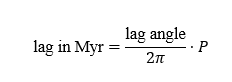
2.2. Phase lag test
A phase lag test was also conducted to evaluate divergence (origination) from period crests. This is the circular mean of relative to the reference phase, where if lag is 0, then events are at crest. Converted to time, where P is 1.0 Myr:
2.3. Circular phase test
A phase test examines a possible lock of genus origination to one orbital solution. A real orbital forcing curve is used (F(t), in recent paleontological climate studies; this is usually the La2011 data [19]. The data F(t) is normalized over the time window of 0-17 Ma. The phase variable is identified as either the 2.4 Myr envelope or 1.2 Myr band. For each time event ti the orbital phase is computed for the orbital band. Whether is uniform or clustered is tested using Rayleigh statistics. If events consistently occur just after envelope maxima, then phase locking is supported. The question asked is whether ape divergences prefer a special part of the original cycle. The analysis aligns event timing with orbital forcing curve and computes the orbital phase, Rayleigh clustering and a visual alignment plot.
The circular phase plot gives Rayleigh p-value (significance of clustering), Watson U2 (sensitivity to overall distribution shape), Kuiper V (sensitivity of gaps and lack of uniformity in the circular distribution), circular mean direction, circular variance, circular standard deviation, and a phase histogram. There are only 9 hominoid divergence events because three taxa are terminal (Homo sapiens, Pan troglodytes, Gorilla gorilla) and do not have divergence ages and thus do not map to orbital eccentricity curve.
3. Results
3.1. Rayleigh test
Results of the Rayleigh test for phase clustering (Figure 2) show that the 1.0 Mry peak is real. The R ≈ 0.63 at 1.0 Myr is strong for data of only 12 events. The 0.32 measure at 1.2 Myr is moderate and shows some alignment with the known 1.2 modulation but is not the dominant signal. The Rayleigh R values for the other cycles are weak. There is no strong phase locking for the grand eccentricity cycle of 2.4 Myr, or its harmonic (4.8 Myr), which indicates that the gibbon-orangutan-gorilla data do not represent periodical signals. The signal is hominin-driven and does not clearly apply pan-Hominidae for this data set. Apparently, the ca. 1 Myr Jupiter-Venus-Mars secular beat controls to a significant extent the African evolutionary climate at least for hominins.
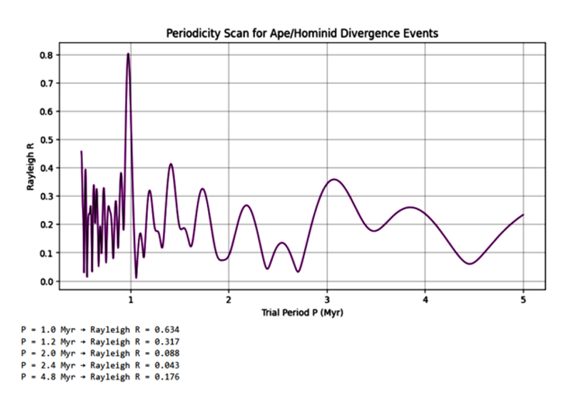
Figure 2: Results of Rayleigh R test for phase clustering. Values are given below the graph of periods versus Rayleigh R scores. Five periods are tested. The 1.0 Myr peak is clear.
3.2. Periodicity
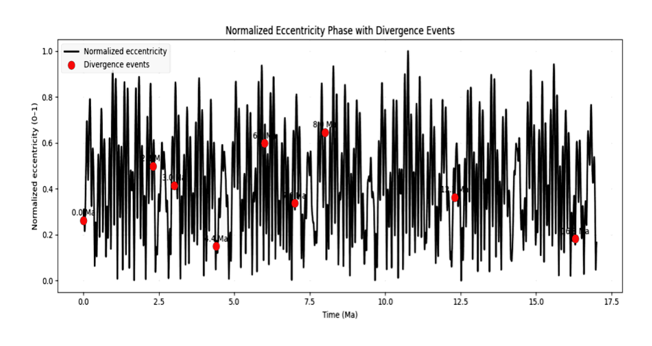
Figure 3: Raw La2011 eccentricity curve (0-17 Ma). Red dots are hominid correlations with dates.
The La2011 eccentricity solution (Figure 3) was plotted over a 0-17 Ma interval, showing the multi‑frequency structure of orbital forcing, including amplitude modulation and the 405 Kyr component. The dominant long‑eccentricity rhythm (~1.2 Myr) is present but visually obscured by higher‑frequency interference. Divergence events are shown as points on the curve. The 1.2 Myr long-eccentricity cycle is strong but heavily modulated by 405 Kyr metronome and shorter 100 Kyr cycles.
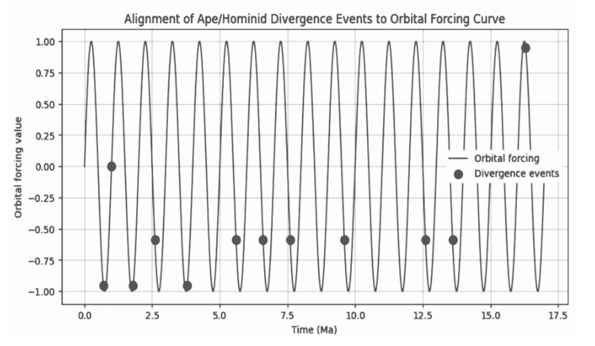
Figure 4: The 1.2 Myr phase‑unwrapped long‑eccentricity cycle.
The idealized sinusoidal curve of the dominant long‑eccentricity cycle extracted from the La2011 solution is given in Figure 4. This graph removes from the raw data amplitude modulation, waveform asymmetry, interference from 406 Kyr and 100 Kyr cycles, and secular frequency mixing. Eccentricity is normalized to 0-1, then mapped onto a circular phase , then plotted against time. Each cycle is the phase of a long-eccentricity beat of 1.2 Myr. The black dots represent the exact phase positions of hominin divergence events derived from the raw La2011 eccentricity curve in Figure 3. This figure clarifies the repeating cycle structure affecting hominids, independent of amplitude modulation or waveform asymmetry. It provides the simplified timewise framework for phase‑based biological alignment. The Rayleigh R for this orbital alignment is 0.713, quite strong. The phase plots provide a biologically connected periodicity derived from underlying astronomical forcing, distinguishing the 1.2 Myr signal from raw eccentricity data.
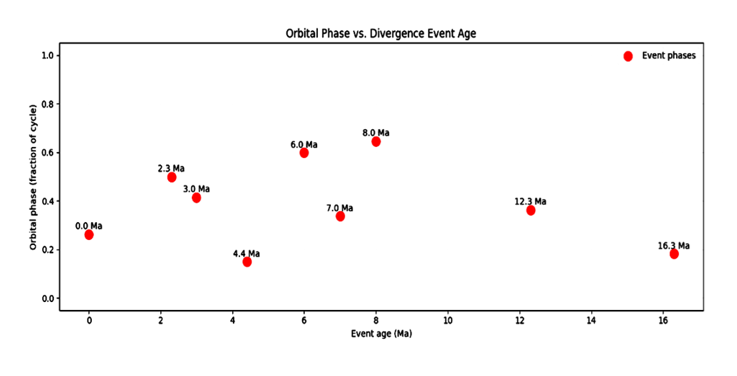
Figure 5: Divergence events mapped onto the conceptual long‑eccentricity phase.
Divergence ages were plotted (Figure 5) against the real eccentricity waveform. This figure visually demonstrates the spread of events that is difficult to see in the raw La2011 curve (Figure 3). This demonstrates how an event’s orbital phase (0-2π) changes as a function of the event’s age (Ma). Biological connections are supported by the clustering between 0.3 and 0.6.
3.3. Phase lag test
Results of the calculation of the amount of divergence of the tested events from the crests of the 1 Myr cycle were: phase angle (radians) 4.053; phase lag fraction of cycle 0.645; phase lag in Myr 0.6451. The divergence mostly occurs about 0.65 of a cycle after the crest, or about two-thirds of the way around the cycle, where 0.0 is maximum forcing at the crest. Biological response is delayed about 650 Kyr after peak climate forcing, a rather late response to a turnover-pulse theory of fragmentation leading to divergence. Origination of general apparently occurs after a full ecological turnover of extinctions and niche modifications and relocations that last hundreds of thousands of years.
3.4. Circular phase distribution
Eccentricity values were normalized to the 0-1 interval and transformed into circular phase using , producing a continuous phase variable as a circle that represents position within each long‑eccentricity cycle. The Rayleigh statistic (Table 2) gives , indicating moderate clustering around an average phase direction, while the associated p‑value shows significant deviation from uniformity, thus phase distribution is not random. Watson’s statistic indicates a unimodal distribution with limited dispersion, and the Kuiper statistic reflects a large gap opposite the preferred phase, consistent with the absence of divergence events near eccentricity minimum. Circular variance and circular standard deviation further quantify the restricted spread of phases around the mean direction (Table 2). Together, these metrics demonstrate that divergence events are modestly but consistently concentrated within a specific portion of the long‑eccentricity cycle.
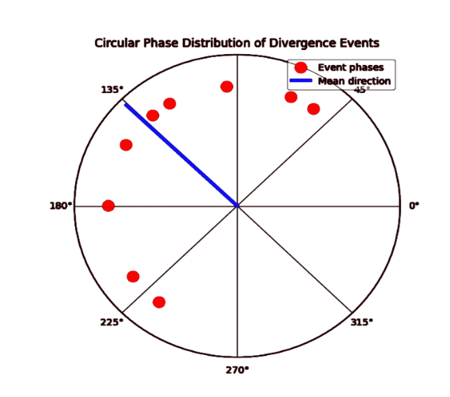
Figure 6: Circular phase distribution and mean direction of divergence events.
Figure 6 shows the circular plot of the distribution of divergence event phases derived from the normalized La2011 eccentricity curve. Red points mark the orbital phase of each event (counting around the circle), and the blue vector indicates the mean direction of the distribution. The clustering of points within a restricted angular arc, together with the clear gap opposite the mean direction, illustrates the non-uniformity of divergence timing across the long eccentricity cycle. This figure provides the statistical visualization underlying the Rayleigh, Watson U^2, and Kuiper V results reported in Table 2.
Table 2: Circular uniformity tests for divergence events.
|
Statistic |
Result |
Value |
Interpretation |
|
Rayleigh R |
0.549 |
Moderate |
Moderate clustering around a mean phase direction |
|
Rayleigh p‑value |
0.063 |
Significant |
Rejects uniform phase distribution |
|
Watson U² |
0.271 |
> 0 (non‑zero) |
Indicates deviation from uniformity; supports unimodal concentration |
|
Kuiper V |
0.392 |
> 0 (non‑zero) |
Detects a pronounced gap opposite the preferred phase |
|
Circular variance |
0.451 |
Low |
Events occupy a restricted angular arc |
|
Circular SD |
1.1 |
Low |
Tight dispersion around the mean direction |
3.5. The Begun Compilation of 50 hominoids
Begun [23] published a timeline for 50 genera of hominoids (apes and ape-like taxa) with resolution at 1 Myr intervals. Fossil evidence indicated that most genera are represented for only one 1 Myr interval, implying geologically short survival. These Hominidea filled the 28 million-year set of 1 Myr intervals (Figure 7), except for nine intervals (Figure 8). In that at least 1 genus originated in most of the 28 Myr intervals, this represents a saturated time series. There are two possible explanations, either the data are crowded simply due to the coarse resolution of 1 Myr, or there is a masked but active macroevolutionary signal due to cosmic influence. Aliasing and carrier signal saturation is a standard problem in signal processing. Little signal but absolute presence implies stationary pacing.
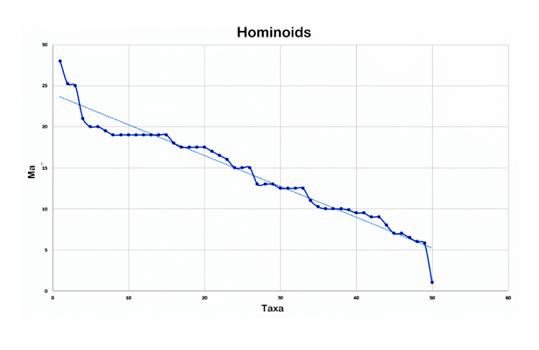
Figure 7: Fifty hominoid genera from the Begun paper graphed according to reported age of origination, in Myr. The Excel spreadsheet trendline is linear.
To determine if the dense occupancy of the Begun [23] data was either background noise or a structured signal, the taxic originations distributed across 28 1-Myr intervals were evaluated against a stochastic Poisson point distribution. Under a random baseline arrival rate of λ=1.78 originations/Myr, the theoretical probability of any one interval remaining vacant through random drift is 17.38%. A binomial cumulative distribution test found that the presence of exactly nine empty intervals is a significant departure from pure stochasticity at p = 0.0423. In addition, a Chi-Square goodness-of-fit test confirmed that the variance in diversification rates across the time is not random at χ2=68.14, p<0.0001, apparently powered by structured origination than a general evolutionary stagnation.
Table 3: Statistical analysis of the Begun data on 50 hominoid originations.
|
Statistical Metric |
Calculated Value |
Interpretation |
|
Chi-Square (x2) Variance Test |
(x2=68.14) (p <0.0001) |
Significant rejection of a flat, static distribution. The variation (the pulses) is real and driven by a structured signal, not noise. |
|
Poisson Baseline Zero-Probability |
P (0) =17.38% |
In a purely random timeline of this density, any given 1-Myr bin has a 17.38% structural probability of being empty by pure chance. |
|
Binomial Excess Gaps (p)-value) |
p=0.0423 |
The probability of getting 9 or more empty bins via a random process is statistically significant (p < 0.05). |
The timeline (Figure 7) across 28 Myr is approximately saturated and maintains strong boundaries around empty intervals. It thus behaves as a frequency-modulated carrier wave. The conclusion is that periodic cosmic pacing controls the baseline hominoid macroevolutionary experimentation. High amplitude diversification pulses are associated with major planetary-correlated climate regimes.
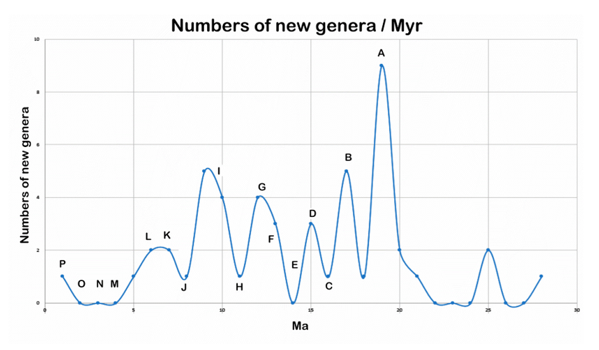
Figure 8: Numbers of new genera for each Myr of hominoid data set. Only nine of the 28 1-Myr intervals do not have new fossil genera. Letters annotating peaks and valleys are more fully explained in the text. A= Mid-Miocene build up. B = forest-savannah mosaics. C = Columbia River continental basalt flooding. D = Antarctic glaciation forest fragmentation. E = peak Antarctic glaciation. F = hominin emergence, continued cooling. G = Great Splitting Valley. H = Raup & Sepkoski extinction event. I = Vallesian Crisis. J = Late Miocene Aridification Pulse. K = Pre-Messinian Global Chill. L = Messinian Salinity Crisis. M = Pliocene Thermal Shift. N = Northern Hemisphere Glaciation. O = Double 405-Kyr Wave Maxima, aridification, Homo erectus. P = Mid-Pleistocene Transition, Pan.
The Begun [23] timeline (Figure 7) is crowded with new genera of Hominidae. Much experimentation among hominoids is evident from 19-9 Ma, with a major peak (Figure 8) just before and after the advent of the hominin line about 13 Ma, continuing through the Antarctic Glaciation Peak and the Great Splitting Valley perturbations, ending about the time of the Vallesian Crisis at 9 Ma of the massive loss of the European canopy forest that forced ground-foraging adaptations and thick tooth enamel. A high radiative peak occurs at 19 Myr, just before the hominid records. The valleys in Figure 8 correspond to little or no origination, perhaps due to ecological stability although poor fossil data is always a possibility. Extinction events are not represented as such in Begun’s data. In the Begun [23] data set, 13 genera have spans of more than 1 Myr, but of these all are only 1-2 Myr in length. As reviewed by Rampino [16], orbit eccentricity cycles pf 2.4 Myr up to 9 Myr have been identified in various geological records by paleontologists, while Boulila et al. [31] proposed that the 2.4 Myr and 9 Myr cycles may have double cycles of 27 and 33 Myr through amplitude modulation. Rampino [16] documented actual correspondences with the 2.4 and 9 Myr cycles. There are three spectral peaks that correspond to the peaks (Figure 8) at 12, 14 and 18 Ma that are particularly evident in the marine mass extinction graph of Stothers republished by Rampino [16].
The peaks (Figure 8) at 9 to 19 Ma are pulses correlated with ecological events of Miocene diversification and may be associated with a 2.4 Myr cosmic cycle: At 19 Ma during the build-up to the Mid-Miocene Climatic Optimum, hominoids expanded and diversified across the warm, humid, well-forested expanse of Eurasia and Africa opening new arboreal niches. Around 17-15 Ma, the Mid-Miocene Climatic Optimum followed by global cooling led to rapid diversification across shifting forest-savanna mosaics (peak at 17 Ma). Around the peak at 15 Ma Antarctic glaciation increased, forests fragmented, and habitats became more open. Around 12 Ma continued cooling led to a major global fragmentation and aridification separating faunal regions (presaged by the 13 Ma peak). Around the 9 Ma peak the Vallesian Crisis led to loss of closed canopy forests in Europe forcing ground-foraging adaptations. The present data is highly focused on one taxonomic group, and requires additional astrochronological analysis of fossil lineages, especially valuable would be that of Vrba’s African ungulates. There is no peak in the hominoid sequence (Figure 8) of the 26 Myr Raup and Sepkoski [13] minor extinction event at 11.3 Ma (unless extinction is signaled by the minimum at that time) or the Columbia River continental basalt flooding at 16.5 Ma (again a minimum). The hominin divergence events show significant orbital phase alignment with the 1.2 Myr long-eccentricity cycle while the larger hominoid group may well respond to a superimposed long-period 2.4 Myr cycle.
4. Conclusions
The correlation of evolutionary events, particularly of extinctions, with astronomical rhythms and catastrophes is well documented [12,13,16,17] and discussed by evolutionists, for example Vrba [1-3] suggested a “Turnover-Pulse Hypothesis” for a one-million-year periodicity in African ungulate evolution. Zander [14] advanced a connection of bryophyte genus origination with the 26-million-year extinction periodicities of Raup and Sepkoski [12,13], which were given multiple possibly causal correlations with astrophysical phenomena by Rampino [16] and Rampino an Haggerty [17]. The floral timeline as annotated with geological perturbations is summarized graphically by Zander [14].
The present paper details an exact statistical correlation with 1.2-Myr long eccentricity periodicity and the ca. 1-my intervals between fossil hominin genus origination. The crest of the 1.2 Myr cycle is derived entirely from the astronomical solution (La2011), and has a period of 1.2 Myr, with phase determined by the orbital eccentricity, with crests at eccentricity maxima and valleys are eccentricity minima. Hominin data aligns well with the phase. The long eccentricity cycle has maximum at:
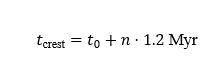
where t0 is the most recent eccentricity maximum. Using the La2011 data, the nearest eccentricity crest for the hominin data is 66 Ma plus (or minus) multiples of 1.2 Myr. The 66 Ma extinction event is an eccentricity maximum and a reference point for the entire study, and crests are at 66 Myr minus 1.2 Myr in series. The hominin divergences fall between these crests. Hominin origination events occur about 624 Kyr after each crest.
The date of 66 Ma is selected because it is an eccentricity maximum, anchors the sinusoid, and aligns with the K-Pg extinction event. The most recent eccentricity maxima are 6.0, 4.8, 5.6, 3.6, 2.4,1.2 and 0.0 Ma. We might expect another burst of hominoid origin in 624,000 years. The match of macroevolutionary events with cosmic rhythms creates a predictive and deterministic framework for evaluating the processes governing biological diversity over geological time. In past literature, palaeobiological models have invoked stochastic birth-death processes or continuous competition via Red Queen hypothesis governing the origin of taxa. The present study suggests the importance of the impact of physical, astronomical influences on macroevolution. Evolutionary change at a level above that of species is apparently sensitive to environmental perturbations triggered by cosmic events.
The immediate inference is that other taxa in other groups may also respond at the macroevolutionary level to cosmic phenomena. At least it is clear that different groups are sensitive to different astronomical periodicities. The bryophytes and perhaps plants in general respond to a 26 Myr cycle of galactic modulations while apes of the human lineage and perhaps other sensitive fauna respond to a 1.2 Myr or 2.4 Myr cycle governed by inter-planetary positioning. The 1.2 Myr long eccentricity periodicity is associated with adaptation to ground-dwelling foraging, while the 2.4 Myr grand eccentricity periodicity is associated with canopy habitation of early hominoids, and as superimposed on more recent major ecological pulses. All maximums appear to correlate at least indirectly with severe forest fragmentation, canopy collapse and large extinctions. The African Orangutan hypothesis [29] is a conceptual bridge that explains both the morphological similarity of the orangutan and humans, and the molecular similarity of chimpanzees and humans. It represents events in the deep geographical barriers that occurred during the 9.8 and 12.8 Ma cosmic valleys (valleys of Fig. 4 not Fig. 8). Additional study demonstrating such correlations requires continued revisionary study among disparate taxa. The taxonomic data is already available in our major collections-based institutions and awaits attention.
Critical to future studies of cosmic influences on biological diversity is unitization of taxonomic variables. Genera are made amenable as comparable units by re-definition as minimally monophyletic groups with one ancestral species and a few descendant species that are monothetic through isomorphism. Analogically, unitization is furthered with species descriptions as evolutionary mass, changes in descriptions between ancestor and immediate descendant as evolutionary distance, and time as one speciation event. Effectiveness of such analysis in understanding the processes underlying macroevolution justifies advancing taxonomy and paleobiology as provinces of biophysics. Biological processes are associated statistically with the timing of cosmic events, supporting a theory that macroevolutionary change is sensitive to and dependent on climatic or catastrophic changes caused by astronomical events. The magnitude of astronomical influence is far less important than the timing, perhaps because similar sized environmental cascades can be induced by small initial perturbations. Orbital eccentricity then affects the amplitude of precession‑driven insolation variability, producing recurring intervals of heightened climatic change, sea-level instability, and habitat fragmentation. Origination dates for nine hominoid and hominin nodes were taken from published phylogenetic and stratigraphic sources. Each origination event was mapped to its corresponding eccentricity value and phase. Circular statistical tests were applied to evaluate non‑uniformity in the phase distribution of events. The Rayleigh statistic was used to quantify the strength of clustering, with associated p‑values assessing deviation from uniformity. Watson’s statistic evaluated overall distribution shape, and the Kuiper statistic evaluated gaps or multimodal structure. Circular variance and circular standard deviation were computed to characterize dispersion around the mean phase. There is no systematic drift in time of divergence, nor do any origination events fall near the trough of the eccentricity cycle.
Early Miocene hominoids have a double periodicity and are more likely to respond to climatic pulses associated with a 2.4 Myr cycle, but they do also fall within similar phase fractions of the long-eccentricity cycle of late Miocene-Pliocene hominins with their clear 1.2 Myr cycle. Because a 26 Myr cycle is apparent for two lineages of bryophytes [14], it is probable that different taxonomic groups are macroevolutionarily sensitive to different astronomical cycles. Determining the extent and degree of cosmic effects on biological diversity is a clear desideratum for the understanding of the processes affecting resilience and change in biological diversity.
A key to the differences in sensitivity to cosmic effects on evolution may be in the mechanisms promoting sustainability. The minimally monophyletic group or microgenus is the powerhouse of macroevolution. Two processes combine upon origination of a microgenus to enhance survivability: (1) initially a microgenus consists of one ancestral species and no more than four immediate descendant species with distinctive new traits, this determined empirically upon taxonomic revision. Four new independently generated traits in each of the immediate descendants yields 16 informational bits translatable to four-sigma of certainty for integrability through time of the genus [5,19,31, 32]. (2) The ancestor gives each of the four descendants its most recently fixed traits, about four of them, such that five species now share four traits. This shared isomorphism provides strong redundancy [5,9,30] that is the basis for error correction. Combining four-sigma certainty and isomorphism is a salient explanation for how plants lineages last up to 100 million years (in studied groups). The hominoid lineage spans only about 30 Myrs. It is possible that it is composed of only one or two minimally monophyletic groups, that is the earliest hominoids up to Homo, which did have descendant genera. Thus, otherwise, the hominoids are largely chains of descendants of descendants, with no sigma-level certainty or group isomorphism. Such chains of descendants would be understandable if indeed hominoids commonly dealt with sibling competition through genocide. Small, restricted populations would be quite vulnerable to cosmically induced climate changes. The tentative scenario for macroevolution is a competition over millions of years for Gibbs free energy (the energy available to do useful work) interspersed by periodic climate perturbations requiring genus-level adaptations to fill newly created niches. The genus Homo originated about 2.8 Ma. We are past due for the end of the 1.2 Myr long-eccentricity periodicity and about right for a 2.4 Myr grand eccentricity periodicity (not yet come to pass). We are competing for increasingly limited negentropy and heading for an imminent major climate change. The hominids remaining, the gorillas, orangutans, chimpanzees, and bonobos, are clearly better adapted to a hot-house regime. It is important to support these apparently advanced, ecologically admirable members of the hominid lineage if we want a human-like perspective to exist in the next 1.2 to 2.4 Myr interval of cosmic climate perturbation.
5. Focused discussion on bioinformatics research
Ai-assisted tools were used for specialized reasoning and conceptual development. The text was written by the author based on evaluation of computerized analysis of the data. Given the present concern about overreliance on imperfect and unoriginal AIs for generating publications, the author states that he generated the initial, seed ideas, persisted in following profitable revelatory threads during analysis and synthesis, and he alone wrote this paper. With due acknowledgement of the biases, faults, blind spots, and other limitations of AI, especially early models, its use is here considered of immense aid in conceptualizing (fanning the human spark), interpreting (fitting new theory into the established edifice of science), and mentoring (indefatigable explanation of knotty elements of theory) in multidisciplinary research [32]. The result rides entirely on that which is new to human understanding of natural processes.
The advent of Artificial Intelligences is like a massive wave upon which careful scientists may surf to abundant new discoveries. Four helpful suggestions and caveats follow:
- Two online computer services were used. Microsoft Copilot apparently featuring ChatGPT 5.6 [33] and Gemini 3.7 Flash [34]. ChatGPT 5.6 is touted as an advanced reasoning model, in which “reason” is a keyword for invoking the model and where a “thinking” message from the AI signals multi-step mathematics derivations, advanced physics reasoning, statistical modeling, and research exploration. Gemini 3.7 is better than GPT models at interpreting and generating graphs and diagrams, long-context STEM (Science, Technology, Engineering, Mathematics) documents needing a large cache, and mixed text and visual reasoning.
In the present study AI ChatGPT insisted that the Begun data set did not show evidence of periodicity, only of frequency. AI Gemini, after reviewing the draft, asserted that indeed the data showed periodicity, and provided three statistical tests to prove it (see above). The reason for consulting a second AI was the unease of the author who observed to Gemini that the Begun [23] data set had “little variation in absolute presence” and periodicity was therefore implied. This initiated Gemini’s statistical analysis correcting ChatGPT’s assessment.
It is demonstrated, then, that one AI can vet another AI for the betterment of a publication, including correcting not just possible mistakes, inventions and misapprehensions but also in matters of (simulated) judgement. Two AIs are then better than one in complex research, particularly since journals are beginning to use AIs to review submitted papers to speed the process and to address new, multidisciplinary fields with as yet few practitioners.
- Although an AI is basically a machine like a pocket calculator, chatting with it politely ensures self-discipline and develops a framework for clear thinking. The AI may present the results in impressively clear, well-organized prose, but you should recast the report of the research in your own words, no matter how stilted and possibly ill-balanced, to demonstrate to yourself and your readers that you understand the data, methods, interpretation, and significance of the findings.
- Like any computer-enabled statistical software, there is no need to recalculate the internal algorithmic results from recent-model AIs. Also, the future is multidisciplinary, and AIs make well-versed mentors. In multidisciplinary research, you must learn enough to distinguish what it is you do not know from potential new science. Even the most outré hypotheses must not be disregarded—even if they smack of a “New Astrology.”
- I expect that scientists using AI must now compete in the marketplace of ideas with other scientists using AI. There can be no arbitrary or prejudicial rejection of novel concepts and perspectives that comprise good theory when generated by whomever or whatever. With the theory-based mentoring of “deep reasoning” AIs—these now fully adept at mathematical calculations and resistant to hallucinations—one should expect great advances in newly addressable multidisciplinary endeavors. Those interested in deep reasoning computer services might access the GlobalGPT Web site for lists, descriptions and costs of specialized AIs.
Funding
This research received no external funding.
Data availability statement
All data used in this study are presented in the text or references. Python scripts are available from the author.
Acknowledgments
The Missouri Botanical Garden is thanked for its continued support of advanced systematic study.
Artificial intelligence use
Details of AI use are in Section 5 above as essential for the multidisciplinary nature of this research.
Conflict of Interest
The author declares no conflict of interest.
References
- Vrba ES. Environment and evolution: Alternative causes of the temporal distribution of evolutionary events. S Afr J Sci 81 (1985): 229-236.
- Vrba ES. Turnover-pulses, the Red Queen, and mutagenic radiation. Am J Sci 293-A (1993): 418-452.
- Vrba ES. The fossil record of African antelopes (Mammalia, Bovidae) in relation to human evolution and paleoclimate. In: Vrba ES, Denton GH, Partridge TC, et al, editors. Paleoclimate and evolution, with emphasis on human origins. New Haven: Yale University Press (1995): 385-424.
- Kerr RA. New mammal data challenge evolutionary pulse theory. Science 273 (1996): 431-432.
- Zander RH. Structural monophyly abstractions-3. Res Botanica Technical Report 2026 (2026): 1-32.
- Zander RH. Reformulation of the foundations of taxonomy using evolutionary mechanics. Taxonomy 6 (2026): 1-41.
- Zander RH. Minimally monophyletic genera are the cast-iron building blocks of evolution. Ukr Bot J 81 (2024): 128-140.
- Zander RH. Fractal evolution, complexity and systematics. St. Louis: Zetetic Publications (2023).
- Jauregui-Lazo J, Brinda JC, GoFlag Consortium, et al. The phylogeny of Syntrichia: An ecologically diverse clade of mosses with an origin in South America. Am J Bot 110 (2023): e16103.
- Ignatov MS, Maslova EV. Fossil mosses: What do they tell us about moss evolution? Bryophyte Diversity Evolution 43 (2021): 72-97.
- Laenen B, Shaw B, Schneider H, et al. Extant diversity of bryophytes emerged from successive post-Mesozoic diversification bursts. Nat Commun 5 (2014): 5134.
- Raup DM, Sepkoski JJ Jr. Periodicity of extinctions in the geologic past. Proc Natl Acad Sci U S A 81 (1984): 801-805.
- Raup DM, Sepkoski JJ Jr. Periodic extinction of families and genera. Science 231 (1986): 833-836.
- Zander RH. A contribution to understanding the natural processes underlying biodiversity. Eur J Bot (2026).
- Muller RA. Nemesis, the Death Star. New York: Heinemann (1989).
- Rampino MR. The temporal characteristics of the geologic record: Global correlations and similar multi-million-year cycles of major geologic events with potential internal-Earth versus astronomical pacing. Evolving Earth 4 (2026): 100116.
- Rampino MR, Haggerty BM. The “Shiva Hypothesis”: Impacts, mass extinctions, and the galaxy. Earth Moon Planets 72 (1996): 441-460.
- Laskar J, Robutel P, Joutel F, et al. A long-term numerical solution for the insolation quantities of the Earth. Astron Astrophys 428 (2004): 261-285.
- Laskar J, Fienga A, Gastineau M, et al. La2010: A new orbital solution for the long-term motion of the Earth. Astron Astrophys 532 (2011): A89.
- Liebrand D, et al. Evolution of the early Antarctic ice sheet and deep-water circulation in the Eocene-Oligocene transition. Earth Planet Sci Lett 450 (2016): 1-11.
- Westerhold T, Marwan N, Drury AJ, et al. An astronomically dated record of Earth’s climate and its predictability over the last 66 million years. Nature 583 (2020): 240-244.
- Zeebe RE, Lourens LJ. Solar system chaos and the Paleocene-Eocene boundary age. Science 365 (2019): 926-929.
- Begun DR. Fossil record of Miocene hominoids. In: Henke W, Tattersall I, editors. Handbook of paleoanthropology. 2nd ed. Heidelberg: Springer (2015): 1261-1332.
- Almécija S, Alba DM, Moyà-Solà S. Pierolapithecus and the functional morphology of Miocene ape hand phalanges: Paleobiological and evolutionary implications. J Hum Evol 57 (2009): 284-297.
- Almécija S, Alba DM, Moyà-Solà, et al. Orang-like manual adaptations in the fossil hominoid Hispanopithecus laietanus: First steps towards great ape suspensory behaviours. Proc R Soc B Biol Sci 274 (2007): 2375-2384.
- Lovejoy CO. Comment: An early ape shows its hand. Proc R Soc B Biol Sci 274 (2007): 2373-2374.
- Grabowski M, Jungers WL. Evidence of a chimpanzee-sized ancestor of humans but a gibbon-sized ancestor of apes. Nat Commun 8 (2017): 855.
- Verhaegen M, Munro S, Bonne K, et al. A hypothesis of ape and human evolution based on comparative biology and plate tectonics. Acad Biol 4 (2026).
- Zander RH. Biodiversity resilience in terms of evolutionary mass, velocity and force. Sustainability 17 (2025): 8272.
- Schwartz JH. Barking up the wrong ape—Australopiths and the quest for chimpanzee characters in hominid fossils. Coll Anthropol 28 (2004): 87-101.
- Boulila S, Haq BU, Hara N, et al. Potential encoding of coupling between Milankovitch forcing and Earth's interior processes encoded in the Phanerozoic eustatic sea-level record. Earth Sci Rev 220 (2021): 103727.
- Zander RH. Artificial intelligence as ideational engine. Res Botanica Technical Report (2026): 1-4.
- GlobalGPT. GPT-5.6: Frontier intelligence that scales with your ambition. (2026).
- Gemini (Gemini 3.7 Flash version) [Large language model]. (2026).