Jon F. Pennycuff1, Dema Jaber2, Scott Hetzel3, Perry J. Pickhardt4, Giuseppe V. Toia5*
1Department of Obstetrics and Gynecology, Division of Female Pelvic Medicine and Reconstructive Surgery, University of Wisconsin School of Medicine and Public Health, Madison, Wisconsin, USA
2University of Wisconsin School of Medicine and Public Health, Madison, Wisconsin, USA
3Institute for Clinical and Translational Research, University of Wisconsin–Madison, Madison, Wisconsin, USA
4Department of Radiology, University of Wisconsin School of Medicine and Public Health, Madison, Wisconsin, USA
5Department of Radiology and Department of Medical Physics, University of Wisconsin School of Medicine and Public Health, Madison, Wisconsin, USA
*Corresponding Author: Giuseppe V Toia, Department of Radiology and Department of Medical Physics, University of Wisconsin School of Medicine and Public Health, Madison, Wisconsin, USA
Received: 12 May 2026; Accepted: 18 May 2026; Published: 30 September 2026
Background: Minimally invasive sacrocolpopexy is cited as the gold standard for treatment of apical pelvic organ prolapse. Inaccessibility of the sacral promontory has been associated with conversion to open sacrocolpopexy. It is not known if body mass index (BMI) or other biometrics are associated with sacral accessibility. The objective of this study was to investigate if imaging-derived biomarkers are correlated with pre-sacral fat thickness and volume as measured on CT imaging.
Methods: This was a cross-section cohort study. CT-derived biomarkers including presacral fat thickness (PT), presacral fat volume (PV), waist circumference, hip circumference, and thigh circumference were measured radiologically. Clinicodemographic information including age, race, BMI, and pertinent medical history was extracted from the electronic medical record. Descriptive, univariate, and multivariate statistics were performed.
Results: 143 women were included in the study. Mean BMI was 27.7 kg/m2 (SD 6.7). Mean PT was 16.2 mm (SD 6.5), and mean PV was 18.0 mL (SD 7.0). On univariate analysis, higher BMI, waist circumference, hip circumference, and thigh circumference were associated with larger PT. Age, BMI, hip circumference, waist circumference, lipid disorder, and thyroid disorder were positively correlated with larger PV. On multivariate analysis, higher BMI was associated with PT (p < 0.001), and larger waist circumference and presence of thyroid disorder were associated with larger PV (p = 0.034).
Conclusion: Our study found that increasing BMI was associated with increasing PT. Increasing waist circumference and thyroid disorders were associated with increasing PV.
Computed Tomography; CT Biomarkers; Pelvic Floor Dysfunction; Presacral Fat
Computed Tomography articles; CT Biomarkers articles; Pelvic Floor Dysfunction articles; Presacral Fat articles
Introduction
Over 40% of American adults are obese [1]. Obesity is a risk factor for pelvic organ prolapse as well as progression of pelvic organ prolapse [2,3]. Abdominal sacrocolpopexy, described by Lane in 1962 [4], is often cited as the gold standard for treatment of apical pelvic organ prolapse given its high success rate [5]. Compared to open sacrocolpopexy, minimally invasive sacrocolpopexy, has been shown to have similar outcomes but with decreased pain, less blood loss, less risk of surgical site infection, and earlier return to function [6-9]. This is particularly important for obese patients as rates of infection and estimated blood loss are higher among obese women undergoing sacrocolpopexy [10]. Nonetheless, obesity is a risk factor for conversion from minimally invasive route to open route [10]. While the published risk for conversion to open sacrocolpopexy is approximately 2-3%, this may be as high as 5% for obese or morbidly obese patients [6-11] with obese women being 3.3 times more likely to undergo conversion [11]. Obese women may be less likely to be offered sacrocolpopexy as a treatment for their vaginal vault prolapse due to perceived difficulty of the surgery [12].
There are many reasons why a minimally invasive approach may be more difficult in obese patients including increased size of the anterior abdominal wall, suboptimal visualization and exposure, and difficulties with ventilation during abdominal insufflation [13]. While it has been reported that paying particular attention to body mass index (BMI) could reduce the frequency of conversion, BMI alone may not accurately explain the nuances of body composition and morphology that lead to surgical difficulty necessitating conversion [14].
Dissection of the presacral space is inherently difficult as this space contains many vulnerable structures including the common iliac vessels, the presacral vessels, and the hypogastric nerve. Inaccessibility of the sacral promontory has been associated with conversion to open sacrocolpopexy [15]. It is not known if BMI or other biometrics are associated with sacral accessibility. Prior work has predicted the difficulty of pelvic rectal cancer surgery using objective preoperative measures based on imaging [16]. For sacrocolpopexy, however, pre-operative imaging is generally not obtained. Thus, a non-invasive, clinical prediction model could help benefit the surgeon to stratify which dissection may be more difficult.
The objective of this study was to investigate if anthropomorphic biomarkers, such as BMI, abdominal circumference, waist circumference, and thigh circumference as well as clinical co-morbidities were correlated with pre-sacral fat (thickness and volume) as measured on CT imaging.
Methods
This cross-sectional study was approved by our Institutional Review Board and compliantly adheres to the Declaration of Helsinki. We searched the PACS (Picture Archiving and Communication System) for CT abdomen pelvic exams from female patients over a five-year period (January 2017 to January 2022) with radiology reports containing any of the following terms: pelvic floor dysfunction, pelvic floor prolapses, cystocele, apical prolapse, cervical prolapse, vaginal prolapse, rectal prolapse, and rectocele. The electronic medical record was cross-checked to assess for a diagnosis of pelvic floor dysfunction either in the patients’ active or medical problem list. In total 143 female patients’ medical records with a corresponding single instance CT scan were analyzed. From each patient’s medical record, we extracted clinicodemographic information including patient age (at time of CT scan), race, BMI, and pertinent medical and surgical history (lipid disorder, hypertension, diabetes, thyroid disorder, prior hysterectomy). Body mass index was stratified into underweight (< 18.5), normal (18.5-24.9), overweight (25.0-29.9) and obese (≥ 30.0) categories.
Presacral fat thickness (PT) was measured on axial CT images by first finding the level of the sacral promontory. At this level, a single line was manually drawn tangent to the anterior border of the external or common iliac arteries. Given that the common iliac bifurcates with some level of craniocaudal variability, either the common or external iliac arteries were identified for this step. Next, an anteroposterior-oriented line was manually drawn perpendicularly from the tangent line to the anterior aspect of the sacral promontory cortex (approximately at the level of L5-S1). The length of the perpendicular line was measured in mm and taken to be PT. The PT measurement technique is exemplified in Figure 1.
Presacral fat volume (PV) was measured manually using advanced volumetric visualization software (Vitrea, Canon Medical Systems; Minnetonka, MN). First, each subject’s axial CT scan data was forwarded to an independent 3D workstation server from PACS. Next, we identified the sacral promontory on both axial and sagittal planes. The superior aspect of the PV was defined on the axial plane at the level of the sacral promontory using a freehand sculpted region of interest as follows: the anterior border at the anterior aspect of the common iliac or external iliac arteries, the posterior border at the anterior aspect of the sacral promontory cortex, and the lateral borders at the lateral aspect of the S1 neural foramina. Next, we identified the inferior-most axial slice containing the S3 vertebral body. The inferior aspect of the PV was defined on the axial plane at the level of the inferior S3 vertebral body using a freehand sculpted region of interest as follows: the anterior border using a transverse line just posterior to any loops of bowel, posterior border at the anterior cortex of the S3 vertebral body, and the lateral borders at the lateral aspects of the S3 neural foramina. The intervening volume (mL) between the two (superior and inferior) regions of interest were automatically interpolated by the software and taken to be PV. Any muscle tissue was automatically subtracted from the final region of interest using readily available tissue subtraction tools.
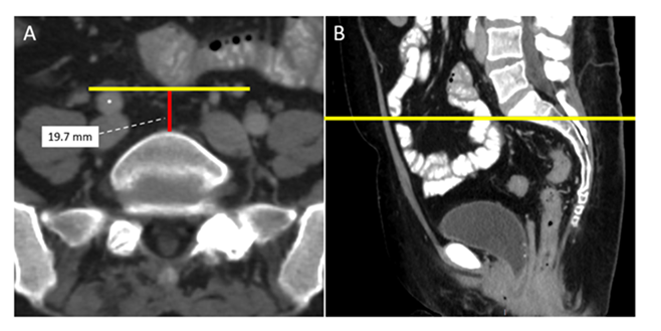
Figure 1: Presacral fat thickness (PT) measurement technique. Axial CT image (A) at the level of the sacral promontory was first identified. Next, a transverse line (yellow) was drawn tangent to the anterior aspect of the iliac arteries, in this example, identified as the right common iliac artery (*). A perpendicular line (red) drawn between the transverse line and the sacral promontory was taken to be PT. Sagittal CT image (B) at the level of the sacral promontory (yellow line).
All measurements were performed by one of the authors under the direct supervision of a fellowship-trained abdominal radiologist with 5 years of post-training experience. The PV measurement technique is exemplified in Figure 2.
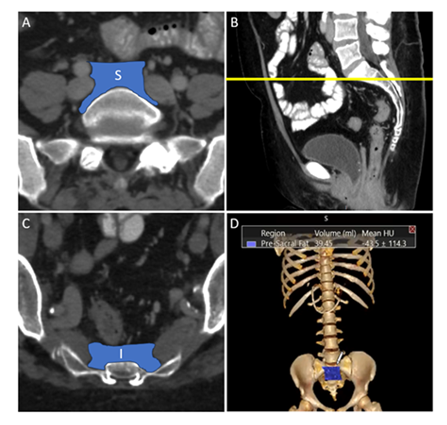
Figure 2: Presacral fat volume (PV) measurement technique. Axial CT image at the sacral promontory (A) with confirmatory sagittal CT image (B) through the sacral promontory (yellow line) showing the superior region of interest (S). Axial CT image at the level of the inferior aspect of S3 vertebral body (C) showing the inferior region of interest (I). 3D reconstructed interpolated volume image (D) with superimposed PV of interest (blue polygon) with automatically measured volume calculations.
Since this study was retrospective, we used each subject’s CT scan to estimate common non-invasive anthropomorphic biomarkers of interest, which included waist, hip, and thigh circumference.
Waist circumference was measured using a lasso measurement tool on axial CT images at the level corresponding to narrowest transverse diameter on CT coronal scout view, commonly at the level of the umbilicus. Hip circumference was measured using a lasso measurement tool on axial CT images at the level corresponding to the widest transverse diameter identified on CT coronal scout view.
Thigh circumference required a slightly modified technique, as the institutional protocol for CT abdomen pelvis exams defined the inferior scanning boundary as the proximal femur and excluded the inferior thigh. For thigh circumference, we first identified the inferior most axial CT slice and then measured a transverse diameter of the right thigh. A simple lasso circumference could not be used for thigh circumference, as the gluteal muscular was often still within field of view posteriorly, compromising measurements. Thus, we measured the thigh diameter and used a circular area measurement equation (area = π *radius2) to estimate thigh circumference. All circumferences were measured in mm. The anthropomorphic biomarker measurement techniques are summarized in Figure 3.
Demographic and clinical variables for the cohort of patients were summarized by mean (SD) or N (%) where appropriate. Univariable associations with possible predictor variables were assessed via Pearson’s correlation coefficient for continuous variables, t-tests for binary variables, and ANOVA for multi-level factor variables for both PT and PV. Any variable with a univariable p-value < 0.10 was considered a candidate variable in a stepwise AIC linear regression model building procedure. Threshold for inclusion into the final multivariable model was a significant improvement in AIC by a p-value < 0.05. All analyses were conducted in R version 4.1 (R Core Team; Vienna Austria).
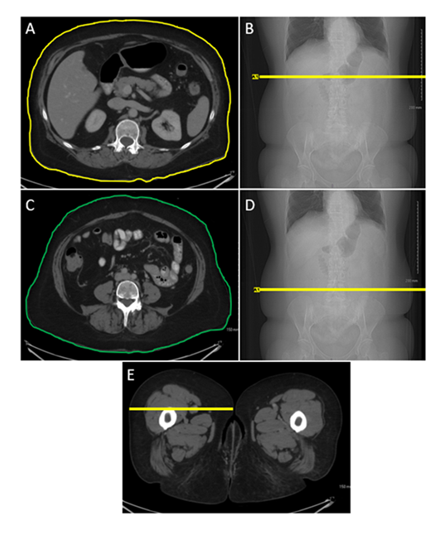
Figure 3: Example anthropomorphic measurements using CT. Waist circumference: Axial CT image at the narrowest diameter of the abdomen (A) as initially identified on coronal scout image (B). The contoured yellow line delineates the waist circumference. Hip circumference: Axial CT at the widest abdominopelvic diameter inferior to the waist measurement (C), as initially identified on coronal scout image (D). The contoured green line delineates hip circumference. Thigh circumference: Axial CT at the inferior-most slice in field of view (E) showing a transverse diameter of the right thigh (yellow line) which was measured and used to estimate thigh diameter to further calculate circumference.
Results
A total of 143 women who had previously undergone abdominopelvic CT were identified and included in the study. Table 1 shows the demographic and clinical data for all participants in the study. Mean BMI was 27.7 kg/m2 (SD 6.7). Seven (4.9%) women were underweight (BMI <18.5 kg/m2), 51 (35.7%) women were normal weight (BMI 18.5 ≤ 25 kg/m2), 35 (24.5%) were overweight (BMI 25 ≤ 30 kg/m2), and 49 (34.3%) were obese (BMI 30 or above kg/m2). Most of the study cohort was white [n=128 (90.8%)].
Table 1: Demographic and Clinical Data.
|
Age (years) |
57.4 (14.6) |
|
Race |
|
|
White |
128 (90.8%) |
|
Black |
9 (8.4%) |
|
Asian |
2 (1.4%) |
|
Native American/Alaskan Native |
2 (1.4%) |
|
Unknown/Not Reported |
2 (1.4%) |
|
BMI |
27.7 (6.7) |
|
Hypertension |
63 (44.1 %) |
|
Lipid Disorder |
72 (50.7 %) |
|
Diabetes mellitus |
18 (12.7 %) |
|
Thyroid disease |
41 (28.7%) |
|
History of hysterectomy |
81 (49.0 %) |
Data presented as N (%) or mean (SD)
One patient (0.7%) had a missing PT, and a different single patient had a missing PV due to image transfer error. Mean PT was 16.2 mm (SD 6.5) and mean PV was 18.0 mL (SD 7.0). Mean waist, hip, and thigh circumference were 98.6 cm (SD 14.7), 104.3 cm (SD 12.7), and 64.1 cm (SD 9.4), respectively. As shown in Figure 4, there was no correlation between PT and PV (R2 = 0.003).
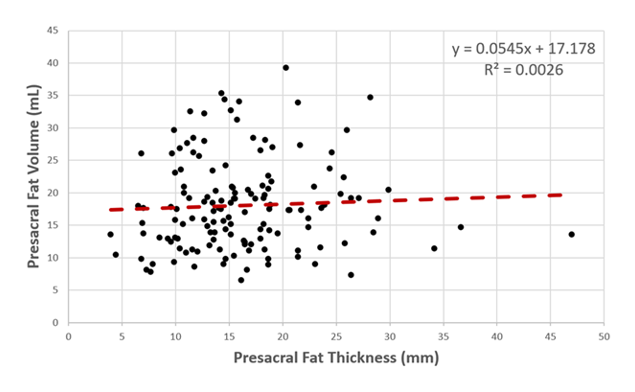
Figure 4: Scatterplot displaying correlation between presacral fat thickness (mm) and presacral fat volume (mL). The R2 value showed no linear correlation between presacral fat thickness and volume.
On univariate analysis, BMI, waist circumference, hip circumference, and thigh circumference were associated with larger PT (Table 2). There was a positive correlation between BMI and PT of 0.32 (95% CI: 0.17- 0.46; p <0.001). Likewise, there was a positive correlation between each of waist, hip, and thigh circumference and PT. All correlations were relatively similar. Nominally waist circumference was the largest at 0.22 (0.05-0.37; p = 0.011), then hip circumference at 0.20 (0.03-0.35; p = 0.02), and then thigh circumference at 0.17 (0.01-0.33; p = 0.044).
Table 2: Univariate Associates with Presacral Fat Thickness.
|
Variable |
Estimate (mm) |
P-value |
|
Age |
-0.02 (-0.19 - 0.14) |
0.776 |
|
BMI |
0.32 (0.16 - 0.46) |
< 0.001 |
|
Thigh Circumference |
0.17 (0.01 - 0.33) |
0.044 |
|
Hip Circumference |
0.20 (0.03 - 0.35) |
0.02 |
|
Waist Circumference |
0.22 (0.05 - 0.37) |
0.011 |
|
Lipid Disorder |
No: 16.1 (7.3) |
0.914 |
|
Yes: 16.3 (5.7) |
||
|
Hypertension |
No: 15.7 (5.7) |
0.342 |
|
Yes: 16.8 (7.4) |
||
|
Thyroid Disorder |
No:15.5 (5.5) |
0.095 |
|
Yes: 17.9 (8.3) |
||
|
Diabetes |
No: 16.2 (6.6) |
0.854 |
|
Yes: 16.0 (6.0) |
||
|
Hysterectomy |
No: 15.7 (6.7) |
0.428 |
|
Yes: 16.6 (6.3) |
* Estimate is either Pearson correlation coefficient (95% CI) or mean (SD).
^ P-value is either from a Pearson single correlation test, t-test, or ANOVA.
Bold text denotes statistical significance.
On univariable analysis, age, BMI, waist circumference, hip circumference, presence of lipid disorder, and presence of thyroid disorder were associated with larger PV (Table 3). The correlation between age and PT was estimated to be 0.18 (95% CI: 0.01-0.33; p=0.034). For BMI, the correlation was 0.17 (0.00-0.32; p = 0.046). The correlation between waist circumference and PT (0.25 [0.09-0.40]; p=0.003) was slightly higher than the correlation between hip circumference and PT (0.22 [0.05-0.37]; p=0.010].
Table 3: Univariate Associates with Presacral Fat Volume.
|
Variable |
Estimate* |
P-value^ |
|
Age |
0.18 (0.01 - 0.33) |
0.034 |
|
BMI |
0.17 (0.00 - 0.32) |
0.046 |
|
Thigh Circumference |
0.10 (-0.07 - 0.26) |
0.244 |
|
Hip Circumference |
0.22 (0.05 - 0.37) |
0.01 |
|
Waist Circumference |
0.25 (0.09 - 0.40) |
0.003 |
|
Lipid Disorder |
No: 16.7 (6.2) |
0.027 |
|
Yes: 19.3 (7.5) |
||
|
Hypertension |
No: 17.2 (6.8) |
0.105 |
|
Yes: 19.1 (7.2) |
||
|
Thyroid Disorder |
No: 16.4 (6.2) |
< 0.001 |
|
Yes: 22.1 (7.4) |
||
|
Diabetes |
No: 17.7 (6.6) |
0.167 |
|
Yes: 20.8 (8.8) |
||
|
Hysterectomy |
No: 17.2 (7.1) |
0.229 |
|
Yes: 18.7 (6.9) |
* Estimate is either Pearson correlation coefficient (95% CI) or mean (SD).
^ P-value is either from a Pearson single correlation test, t-test, or ANOVA.
Bold text denotes statistical significance.
On multivariate analysis, body mass index was positively associated with greater PT (β=0.31, CI 0.16- 0.47; p < 0.001); larger waist circumference (β=0.08, CI 0.01-0.15; p<0.034) and presence of thyroid disorder (β=5.1, CI 2.6-7.6 cm; p<0.001) were associated with greater PV (table 4).
Table 4: Multivariate Associates with Presacral Fat.
|
Variable |
Coefficient (95% CI) |
P-value |
|
Presacral Fat Thickness |
||
|
BMI |
0.31 (0.16 – 0.47) |
< 0.001 |
|
Presacral Fat Volume |
||
|
Presence of Thyroid Disorder |
5.1 (2.6 – 7.6) |
< 0.001 |
|
Waist Circumference (cm) |
0.08 (0.01 – 0.16) |
0.034 |
Bold text denotes statistical significance.
Discussion
Our study found a positive correlation between CT-derived presacral fat thickness and BMI, waist circumference, hip circumference, and thigh circumference using univariate analysis with BMI being the dominant predictor through multivariate analysis. We also showed a positive correlation between CT-derived presacral fat volume and age, BMI, hip and thigh circumference, and presence of thyroid disorder using univariable analysis with thyroid disorder and waist circumference showing a positive correlation using multivariate analysis.
Our study was the second to assess CT-derived PT as a biomarker for presacral fat. A study by Agarwal et al. similarly found a positive correlation between BMI and CT-derived PT using a similar measurement technique and multivariate analysis approach [17]. Despite our studies having a similar age distribution and hypertension population, their work showed age and hypertension to also be significant factors associated with larger PT which we did not observe. Our study had fewer subjects (n=143) compared to theirs (n=241), a possible contributing factor. Notably our study selected patients with a known diagnosis of pelvic floor dysfunction whereas the study by Agarwal et al. selected patients previously imaged for trauma evaluation [17]. Thus, our sample populations differ from one another, which may, at least partially, explain the contrasting results. While our studies together further support a positive correlation between BMI and PT, the effect of age and hypertension is less clear.
This study was the first to assess CT-derived PV as a surrogate marker for presacral fat. We chose to measure volume in addition to presacral fat thickness because it may more accurately represent the amount of adipose tissue in the presacral space that a surgeon would encounter during sacrocolpopexy. Fat deposition has been shown to vary between patients [18]. We hypothesized that despite having a large PT, it may not be fully representative of the fat content in the presacral space. This is supported by Figure 4, which showed no linear correlation (R2 = 0.003) between PT and PV.
The association of PV with the presence of thyroid disorder was an interesting finding. We acknowledge that this study did not further stratify thyroid disorder (i.e., hyperthyroidism or hypothyroidism). A plausible hypothesis for this finding is that perhaps many of these patients had hypothyroidism, a disorder which potentiates body fat deposition throughout the body. Prior work has shown that BMI and anthropomorphic biomarkers, such as the ones studied here are larger, in patients with hypothyroidism [19].
The obesity epidemic is increasing worldwide. 78% of adults in the US will be overweight or obese by 2030, and over half of the world’s population will be overweight or obese by 2035 [20]. Obesity has been shown to be a risk factor for primary pelvic organ prolapse and recurrence after prolapse surgery [21,22]. While the lifetime risk of prolapse surgery is 12.6%, this risk may be greater with the increasing prevalence of overweight and obesity [23]. Our study supports a correlation between common anthropomorphic biomarkers such as waist circumference with PV, but we acknowledge that our study cohort was not large enough for full clinical validation and adoption. While hip and thigh circumference were both positively correlated with PT and PV using univariate analysis, our sample size may not have been large enough to show further conclusions on multivariate analysis. Nonetheless, these results entertain the possibility that non-invasive anthropomorphic biomarkers are associated with presacral fat, understanding that most patients with pelvic floor disorders do not receive a CT exam as part of standard of care clinical work-up.
The learning curve for minimally-invasive sacrocolpopexy has been shown to be 30 – 60 cases with proficiency occurring after 80 – 90 cases [24-26]. Dissection of the sacral promontory is the highest risk portion of sacrocolpopexy, as the surgeon must identify the anterior longitudinal ligament without causing injury to the common iliac arteries or veins, middle sacral artery, sacral venous plexus, or the hypogastric nerve. A study by Claerhout et al. examined the learning curve for each portion of sacrocolpopexy. The authors found that presacral dissection did not become more efficient over time and that the time needed for dissection did not significantly differ between trainee surgeons and attending surgeons [26]. The authors felt that this was explained by patient’s individual anatomy rather than surgeon experience. Thus, developing a technique for predicting the difficulty of the presacral dissection could help with pre-surgical planning and helping to guide surgeons-in-training and surgeons early in their career as they become more comfortable with the procedure.
This study was conducted under the supervision of a single attending radiologist to ensure that measurements were consistent and included patients with known diagnoses of pelvic floor disorders to ensure that PT and PV would be most predictive to those encountered during sacrocolpopexy. This multidisciplinary study between radiology and reconstructive pelvic surgery is consistent with previously published data [16]. There is also a growing body of radiology literature regarding the use of radiologic imaging (i.e., opportunistic screening) to extract unrelated data and physiological information [27, 28].
This study had limitations. It was performed at a single institution with a majority white population and thus may not be generalizable to all populations. Additionally, our study does not provide insight into whether increasing PT or PV is associated with increasing difficulty during the presacral dissection at the time of sacrocolpopexy. Our sample population did not account for patients who may have had other pelvic surgeries at the time of the CT scan, which may confound some of our results. As this was a cross-sectional study, our sample population did not have a control group, and thus any conclusions about how BMI or anthropomorphic biomarkers differ between pelvic floor dysfunction patients and healthy controls cannot be made. Lastly, we used CT as a surrogate measurement for waist, hip, and thigh circumference. While the techniques employed tried to account for measurement consistency, we acknowledge that this can be a source of error, especially since patients are supine during CT exams, a position which could distort body contour.
Pelvic surgery is inherently difficult due to several factors such as complex anatomy, confines of the bony pelvis, depth, and visualization. While BMI or certain anthropomorphic biomarker thresholds are not contraindications to surgery, they may give pause to the surgeon to reflect on how they may contribute to the difficulty or safety of the planned surgery. Our finding that increasing waist circumference was associated with increasing presacral fat volume is an interesting result that merits further investigation. Further studies evaluating if increasing BMI, presacral fat thickness, and presacral fat volume are associated with more difficult surgery or peri-operative complications are warranted.
Conclusion
This study found that increasing BMI was associated with increasing PT. and that increasing waist circumference and thyroid disorders were associated with increasing PV. The correlation between BMI and presacral fat suggests that further work is warranted to understand whether the relationship can be used to predict pelvic floor surgery operative difficulty and patient outcomes.
Reference
- National Institutes of Health. National Institute of Diabetes and Digestive and Kidney Disease. Overweight and Obesity Statistics (2024).
- Hendrix SL, Clark A, Nygaard I, et al. Pelvic organ prolapses in the women’s health initiative: gravity and gravidity. Am J Obstet Gynecol 186 (2002): 1160-116.
- Bradley CS, Zimmerman MB, Qi Y, et al. Natural history of pelvic organ prolapse in postmenopausal women. Obstet Gynecol 109 (2007): 848-854.
- Lane FE. Repair of posthysterectomy vaginal vault prolapse. Obstet Gynecol 20 (1962): 72-77.
- Maher C, Feiner B, Baessler K, et al. Surgery for women with apical vaginal prolapse. Cochrane Database Syst Rev 10 (2016): CD012376.
- Thubert T, Naveau A, Letohic A, et al. Outcomes and feasibility of laparoscopic sacrocolpopexy among obese versus non-obese women. Int J Gynaecol Obstet 120 (2013): 49-52.
- Campbell P, Cloney L, Jha S. Abdominal versus laparoscopic sacrocolpopexy: a systematic review and meta-analysis. Obstet Gynecol Surv 71 (2016): 435-442.
- Freeman RM, Pantazis K, Thomson A, et al. A randomised controlled trial of abdominal versus laparoscopic sacrocolpopexy for the treatment of post- hysterectomy vaginal vault prolapse: LAS study. Int Urogynecol J 24 (2013): 377-384.
- Linder BJ, Occhino JA, Habermann EB, et al. A National Contemporary Analysis of perioperative outcomes of open versus minimally invasive Sacrocolpopexy. J Urol 200 (2018): 862-867.
- Wen Q, Zhao Z, Wen J, et al. Impact of obesity on operative complications and outcome after sacrcolpopexy: a systematic review and meta-analysis. Eur J Obstet Gynecol Reprod Bio 258 (2021): 309-316.
- Campas P, Suarthana E, Larouche M. Conversion rate of laparoscopic or robotic to open sacrocolpopexy: are there associated factors and complicatIons. Int Urogynecol J 32 (2021): 2249-2256.
- Mahoney C, Scott G, Dwyer L, et al. Laparoscopic sacrocolpopexy posthysterectomy: intraoperative feasibility and safety in obese women compared with women of normal weight. Int Urogynecol J 30 (2019): 2041-2048.
- Committee on Gynecologic Practice. Committee Opinion No. 619. Gynecologic surgery in the obese woman. Obstet Gynecol 125 (2015): 274-278.
- Gadonneix P, Ercoli A, Salet-Lizee D, et al. Laparoscopic sacrocolpopexy with two separate meshes along the anterior and posterior vaginal walls for multicompartment pelvic organ prolapse. J Am Assoc Gynecol Laparosc 11 (2004): 29-35.
- van Zanten F, Schraffordt Koops SE, O'Sullivan OE, et al. Robot-assisted surgery for the management of apical prolapse: a bi-centre prospective cohort study. BJOG 126 (2019): 1065-1073.
- Iqbal A, Khan A, George TJ, et al. Objective Preoperative Parameters Predict Difficult Pelvic Dissections and Clinical Outcomes. J Surg Res 232 (2018): 15-25.
- Agrawal A, Abayazeed A, Francis SL, et al. Correlation of Computed Tomography Measured Presacral Thickness with Body Mass Index. Surg Technol Int 26 (2015): 164-168.
- Lee SJ, Liu J, Yao J, et al. Fully automated segmentation and quantification of visceral and subcutaneous fat at abdominal CT: application to a longitudinal adult screening cohort. Br J Radiol 91 (2018): 20170968.
- Dipankar SP, Mali BY, Borade NG, et al. Estimation of Lipid Profile, Body Fat Percentage, Body Mass Index, Waist to Hip Ratio in Patients with Hypothyroidism and Hyperthyroidism. Phys Pharm Adv 2 (2012): 330-336.
- Koliaki C, Dalamaga M, Liatis S. Update on the Obesity Epidemic: After the Sudden Rise, Is the Upward Trajectory Beginning to Flatten? Curr Obes Rep 12 (2023): 514-527.
- Giri A, Hartmann KE, Hellwege JN, et al. Obesity and pelvic organ prolapse: a systematic review and meta-analysis of observational studies. Am J Obstet Gynecol 217 (2017): 11-26.
- Ringel NE, Lenger SM, High R, et al. Effects of Obesity on Urogynecologic Prolapse Surgery Outcomes: A Systematic Review and Meta-analysis. Obstet Gynecol 143 (2024): 539-549.
- Wu JM, Matthews CA, Conover MM, et al. Lifetime risk of stress urinary incontinence or pelvic organ prolapse surgery. Obstet Gynecol 123 (2014): 1201-1206.
- Linder BJ, Anand M, Weaver AL, et al. Assessing the learning curve of robotic sacrocolpopexy. Int Urogynecol J 27 (2016): 239-246.
- Claerhout F, Roovers JP, Lewi P, et al. Implementation of laparoscopic sacrocolpopexy—a single centre’s experience. Int Urogynecol J Pelvic Floor Dysfunct 20 (2009): 1119-1125.
- Claerhout F, Verguts J, Werbrouck E, et al. Analysis of the learning process for laparoscopic sacrocolpopexy: identification of challenging steps. Int Urogynecol J 25 (2014): 1185-1191.
- Pickhardt PJ, Summers RM, Garrett JW, et al. Opportunistic Screening: Radiology Scientific Expert Panel. Radiology 307 (2023): e222044.
- Pickhardt PJ, Graffy PM, Zea R, et al. Utilizing Fully Automated Abdominal CT-Based Biomarkers for Opportunistic Screening for Metabolic Syndrome in Adults Without Symptoms. AJR Am J Roentgenol 216 (2021): 85-92.