Yuk-Tai Tsoi*, Kwok-Chu Chan, Chun-Kuen Cheung, Wai-Ling Cheung, Yiu-Chung Yip
Government Laboratory, Analytical and Advisory Services Division, 7/F, Ho Man Tin Government Offices, 88 Chung Hau Street, Ho Man Tin, Kowloon, Hong Kong Special Administrative Region, China
*Corresponding author: Yuk-Tai Tsoi, Government Laboratory, Analytical and Advisory Services Division, 7/F, Ho Man Tin Government Offices, 88 Chung Hau Street, Ho Man Tin, Kowloon, Hong Kong Special Administrative Region, China
Received: 24 August 2026; Accepted: 29 August 2026; Published: 16 September 2026
DOI: 10.26502/jfsnr.2642-110000199
ShareDetermination of the elemental contents in food is crucial for ensuring compliance with government regulations regarding food safety
and nutritional quality. This study presents an eco-friendly microwaveassisted digestion method for the determination of both toxic elements (arsenic, cadmium, chromium, lead and mercury) and nutritional elements (calcium, copper, iron, manganese, sodium and zinc) in diverse foodstuffs by inductively coupled plasma mass spectrometry and inductively coupled plasma optical emission spectrometry. The present method employed 2.5 mL of concentrated nitric acid (HNO3) in combination with 2.5 mL of 30% hydrogen peroxide (H2O2) under new microwave-assisted digestion conditions, significantly reducing acid waste production by half when compared to 5 mL of concentrated HNO3 typically used according to international standards. To demonstrate the method's quality assurance in measurements, validation was carried out by using various certified reference materials (e.g. NRC CRM DORM-5, NRC CRM SPIN-1, NIST SRM 1869 and NIST SRM 2387) as well as quality control (QC) materials from proficiency testing providers (e.g. FAPAS QC materials such as avocado puree, offal (liver), powdered rice, soya flour, sunflower seeds and vegetable oil). The analytical method achieved satisfactory scores across multiple analytical metrics, including a Complex Modified Green Analytical Procedure Index (ComplexMoGAPI) score of 66 points, a Blue Applicability Grade Index (BAGI) score of 77.5 points, and a Red Analytical Performance Index (RAPI) score of 82.5 points, indicating its eco-friendliness, wide applicability, and impressive analytical performance respectively, alongside recoveries ranging from 92% to 112% for the certified reference materials and QC materials, demonstrating its practicality for testing of a variety of food matrices.
Eco-friendly microwave-assisted digestion, Multi-element detection, Food samples, ICP-MS and ICP-OES, Green analytical chemistry,White analytical chemistry
Eco-friendly microwave-assisted digestion articles; Multi-element detection articles; Food samples articles; ICP-MS and ICP-OES articles; Green analytical chemistry articles; White analytical chemistry articles.
Introduction
Food safety is a critical concern for the society, as it directly impacts the health and well-being of consumers. One major issue in food safety is the presence of heavy metals in food and its products [1]. Metallic contaminants, such as arsenic, cadmium, mercury and lead, are commonly found in various food sources, and their excessive presence poses serious health risks [2]. Conversely, ensuring an adequate supply of essential mineral nutrients, like iron, calcium and zinc, particularly in infant formulas, is vital for supporting human growth and development [3]. To safeguard food safety and nutritional quality, government agencies have established regulatory limits based on guidelines from international organisations, such as CODEX Alimentarius Commission [4,5]. Consequently, robust and reliable analytical methods with good quality assurance in measurements are essential for monitoring compliance and protecting consumer health. Currently, various official standard methods are available for determining metals in food, such as BS EN ISO 21424:2020 from International Organization for Standardization (ISO) [6] and Section 4.7 of the Elemental Analysis Manual published by United States Food & Drug Administration (FDA) [7].
Green Analytical Chemistry (GAC) is an emerging field that aims to incorporate green chemistry principles into analytical methodologies [8] to minimize the generation of hazardous substances and human health risks associated with chemical analyses [9]. The framework for developing environmentally sustainable analytical methods is guided by twelve defined GAC principles [10], which include minimizing reagent use, reducing waste generation, employing safer chemicals, enhancing energy efficiency, promoting method integration, automation, and miniaturization. In this context, IUPAC recently initiated a project to evaluate the greenness of the sample preparation methods in 174 official standard methods, including standard methods in CEN, ISO and pharmacopoeia [11]. The project revealed that about two-thirds of the standard methods evaluated did not comply with the GAC principles. This underscores the urgent need to reduce environmental hazards in sample preparation processes while maintaining analytical performance and applicability.
This study aims to develop and validate an eco-friendly method for determining metals in general foodstuffs. The analytical method developed follows GAC principles, demonstrates high applicability, and maintains good analytical performance with its quality assurance in measurements across various food matrices.
Materials and Methods
Chemicals and solutions
Concentrated nitric acid (TraceMetalTM, HNO3) and 30% hydrogen peroxide (OptimaTM, H2O2) were purchased from Fisher Scientific (Loughborough, UK). Ultrapure water was obtained from a Milli-Q water generator (Millipore, Bedford, MA, USA).
Individual stock standard solutions (1000 µg/mL) for analytes (arsenic (As), cadmium (Cd), calcium (Ca), chromium (Cr), copper (Cu), iron (Fe), lead (Pb), manganese (Mn), mercury (Hg), sodium (Na) and zinc (Zn)) as well as internal standards (bismuth (Bi), germanium (Ge), indium (In), iridium (Ir) and lutetium (Lu)) and gold (Au, added for stabilisation of mercury) were purchased from High-Purity Standards (North Charleston, South Carolina, USA).
Test samples and AOAC food triangle
In this study, a total of eleven samples, consisting of either certified reference materials (CRM) produced by National Metrology Institutes (NMI) or QC materials from proficiency testing providers, were selected based on the nine sectors of the AOAC food triangle [12]. This approach demonstrates method performance across diverse food matrices. Using CRMs and QC materials in method validation could ensure the validation results fulfilled the quality assurance in measurements. The details of materials used are shown in tables S1a to S1c. The AOAC food triangle categorises foods by major composition, with expectation that foods within a sector will behave similarly under consistent analytical conditions [13].
Microwave-assisted digestion
The microwave-assisted digestion procedures for food samples were as follows: 0.5 g of sample was weighed into the microwave vessel (CEM iPrep vessel, North Carolina, USA). Subsequently, 2.5 mL of conc. HNO3 and 2.5 mL of 30% H2O2 were added into the vessel. If foaming or a reaction occurred, the vessel would be temporarily placed in a fume hood until the reaction subsided. After sealing the vessel, a microwave-assisted digestion programme in the microwave system (CEM MARS 6, North Carolina, USA) was executed. There were two steps in the digestion programme. Firstly, the power of the microwave system was set at 1200 W. The temperature was raised to 150 °C with a ramping time of 25 minutes and held for 4 minutes. Secondly, the power of the microwave system was set at 1800 W. The temperature was further raised to 210 °C with a ramping time of 5 minutes and held for 12 minutes. Following cooling to room temperature, a mixed internal standard solution (500 ug/L of Bi, Ge, In and Ir, 10 mg/L of Lu, and 50 mg/L of Au for stabilisation of mercury) was introduced into each vessel. The sample solution was transferred to a 50 mL volumetric flask and made up to the mark with deionised water. For determination of As in high fat samples (e.g. vegetable oil in Sector 1 of AOAC triangle), the sample solution should be further diluted five times prior to analysis.
Inductively coupled plasma mass spectrometry (ICP-MS) and inductively coupled plasma optical emission spectrometry (ICP-OES)
The analyses of As, Cd, Cr, Cu, Fe, Hg, Mn, Pb and Zn in food samples were performed by ICP-MS (Perkin Elmer 300X, Connecticut, USA and Agilent 8900, California, USA). The isotopes (m/z) for monitoring and quantification were 53Cr, 55Mn, 57Fe, 63Cu, 66Zn, 75As, 111Cd, 202Hg and 208Pb. The signal intensity of 208Pb is represented as the sum of the intensities for the m/z values of 206, 207 and 208. The residual carbon content was monitored by measuring the 12C counts in sample solutions. Typical ICP-MS conditions are shown in tables S2a and S2b.
The analyses of Ca and Na in food samples were performed by ICP-OES (Spectro Arcos, Kleve, Germany). The wavelengths for monitoring and quantification were Ca (317.933 nm) and Na (589.592 nm). Typical ICP-OES settings are given in table S2c.
Argon (99.9992%, Air Product, Hong Kong China) was served as plasma gas, auxiliary gas, and nebulizer gas in ICP-MS and ICP-OES, while helium gas (99.999%, Linde, Hong Kong China) was employed as collision gas for gas mode analysis in ICP-MS. Quantitative analysis mode was used for measurements by ICP-MS and ICP-OES. Digestion blanks were performed in each analysis to monitor any cross-contamination in food samples. Calibration standard checks were regularly analysed during the analytical sequence (one continuous calibration check per ten measurements) to monitor any drift in both ICP-MS and ICP-OES measurements.
Method validation
Method validation was performed in respect of selectivity, linearity, trueness, precision and limit of quantification (LOQ), adhering to the Eurachem guidelines [14]. Various analytical metrics were utilised to evaluate the greenness, applicability and analytical performance of the analytical method developed.
Selectivity and identification
The isotopes selected for monitoring and quantification in ICP-MS analysis were 53Cr, 55Mn, 57Fe, 63Cu, 66Zn, 75As, 111Cd, 202Hg and 208Pb. The signal intensity of 208Pb is represented as the sum of the intensities for the m/z values of 206, 207 and 208. Isotopes selected for ICP-MS analysis were chosen to avoid isobaric interferences, for example, avoiding 64Zn interference from 64Ni, and 114Cd interference from 114Sn. Besides, helium mode was employed to eliminate the effects of polyatomic interferences, particularly 40Ar35Cl to 75As and 40Ar23Na to 63Cu.
For quantification of Ca and Na by ICP-OES, two wavelengths for each analyte, namely 317.933 nm and 315.887 nm for Ca, and 589.592 nm and 588.995 nm for Na were monitored. This was to ensure elimination of spectral interferences.
In order to correct for signal drifts during ICP-MS and ICP-OES measurements, internal standards were added to sample solutions. Bi, Ge, In and Ir were used for ICP-MS measurement, while Lu was used for ICP-OES measurement.
Trueness and precision
Trueness and precision were evaluated through replicate analyses of CRMs and QC materials, assessing recovery and relative percent difference (RPD)/relative standard deviation (RSD). The AOAC triangle guided the selection of test samples, ensuring comprehensive food matrices across the nine sectors and validating accuracy against certified values and acceptable ranges.
Linearity
Calibration curves were constructed using varying concentrations of analytes (tables S3a and S3b), with relative intensity ratios of analytes to internal standards plotted against analyte concentrations. Calibration blanks containing appropriate amounts of internal standards in 5% HNO3 were prepared to establish calibration curves for ICP-MS and ICP-OES measurements. By linear regression analysis, a correlation coefficient (r) of 0.9975 or greater was considered acceptable.
Limit of quantification
The limit of quantification (LOQ) was determined by analysing 10 blank matrix samples which were spiked at the levels given in table S4. Satisfactory recoveries of spikes at the LOQ levels were achieved (i.e. 100% ± 10%).
Evaluation of greenness, analytical performance and applicability of the method
Analytical metrics including Analytical Eco-Scale [15], MoGAPI [16] and ComplexMoGAPI [17] were used to evaluate the greenness of the analytical method. Besides, BAGI [18] and RAPI [19] were applied to evaluate the applicability and analytical performance of the method respectively.
Results and Discussion
Optimisation of microwave-assisted digestion conditions
In this study, we aimed to develop an environmentally friendly method that minimizes the use of acids during the digestion process while ensuring its applicability across a diverse range of food matrices. We used a novel microwave digestion system equipped with high performance digestion vessels and employed new microwave-assisted acid digestion conditions, utilising a minimal quantity of concentrated HNO3 and 30% H2O2 under a microwave digestion programme that was set to attain a temperature of 210 oC. It was imperative to note that the maximum attainable temperature for conventional digestion vessels was restricted to 180 oC, exceeding this limit would result in damage to the vessels. Our findings indicated that satisfactory results could be achieved by reducing the quantity of concentrated HNO₃ to half of the standard amount typically reported in literature and international guidelines (for instance, 5 mL of concentrated HNO3 is specified in BS EN ISO 21424:2020 [6]). To maintain digestion efficiency, the addition of a modest volume of 30% H2O2 (i.e. 2.5 mL) to the digestion solution was proved to be essential. To validate the efficiency of our method, we compared the results obtained under our digestion conditions (2.5 mL of concentrated HNO3 and 2.5 mL of 30% H2O2) with those derived from the conventional use of 5 mL of concentrated HNO₃. The results for three FAPAS QC materials are presented in table S5. Employing our modified digestion conditions, we achieved satisfactory recoveries for the three FAPAS QC materials, with recovery rates for various analytes ranging from 96% to 101%. Furthermore, the outcomes under the modified digestion conditions were comparable to those obtained using 5 mL of concentrated HNO3, demonstrating that the reduced acid volume was sufficient for effective sample digestion.
In addition to the acid volume, digestion temperature is a critical parameter for optimising the digestion conditions. Given that samples with high fat content are particularly prone to incomplete digestion, we selected a vegetable oil FAPAS QC material (T07533QC) for our investigation. We monitored the ¹²C signal counts of ICP-MS for the samples as well as the standard solutions at two different digestion temperatures, specifically 210 °C and 180 °C, to assess the residual carbon content in the solutions [21]. Our results indicated that a higher than typical digestion temperature, specifically 210 °C, was crucial for effective sample digestion under our optimised conditions. We observed that the 12C signal counts at the 180 °C digestion temperature were approximately 1.8 times higher than those at the 210 °C digestion temperature (1.65 × 10⁶ counts versus 9.2 × 10⁵ counts), suggesting that digestion at 180 °C might not be complete. Table S6 compares the results of the FAPAS T07533QC material (vegetable oil) across different analytes using the two digestion temperatures. Good recovery rates were achieved for all analytes digested at 210 °C. Although satisfactory recoveries were noted for Cu, Fe, and Pb digested at 180 °C, an unexpectedly high recovery rate of 111% was recorded for As under the same digestion conditions. This phenomenon is attributed to the carbon-induced signal enhancement effect described in the literature [20]. The carbon-induced signal enhancement of hard-to-ionize elements whose first ionization energies (IEs) are between approximately 8 and 12 eV, such as As (the IE of As is 9.79 eV), is a well-documented phenomenon. These findings collectively suggested that a digestion temperature of 210 °C was necessary to achieve complete sample digestion under our optimised digestion conditions.
Optimisation of ICP-MS and ICP-OES conditions
Daily performance checks were conducted for both ICP-MS and ICP-OES measurements to ensure compliance with the manufacturer's specifications, thereby optimising the instrumental conditions for each analysis. Additionally, the helium flow rate for ICP-MS was refined by monitoring the ratio of chlorinated oxygen (ClO) to cobalt (Co) counts (mass-to-charge ratio 51 versus 59). Maintaining a ratio of 2% or less is essential to ensure the efficiency of the collision cell.
Method validation
Following the optimisation of microwave-assisted digestion conditions, we assessed the accuracy and precision of the method by analysing CRMs and QC materials as shown in table S1. The results for toxic and nutritional elements are summarised in tables 1 and 2 respectively. Our eco-friendly digestion method demonstrated satisfactory performance in terms of both accuracy and precision across all CRMs and QC materials. Notably, all results from the selected food matrices, spanning Sectors 1 to 9 of the AOAC triangle, fell within the acceptable ranges specified for their respective CRMs or QC materials. Recoveries ranged from 92% to 112%, with the RPD/RSD being not more than 5%. We used NIST SRM 2387 Peanut butter to demonstrate the intermediate precision study, the RSD for all six elements in between days’ results were not more than 4% as shown in table S7. These findings indicated that our method was well-suited for the analysis of elements in a diverse array of food matrices.
|
Analyte |
Mean value and recovery |
|||||||
|
Vegetable oil |
Avocado puree |
Sunflower seeds |
Offal (liver) |
Powdered rice |
Spinach powder |
Soya flour |
Fish protein |
|
|
FAPAS T07533QC |
FAPAS T07566QC |
FAPAS T07567QC |
FAPAS T07446QC |
FAPAS T07553QC |
NRC CRM SPIN-1 |
FAPAS T07458QC |
NRC CRM DORM- 5 |
|
|
(n = 3) |
(n = 2) |
(n = 2) |
(n = 2) |
(n = 3) |
(n = 3) |
(n = 2) |
(n = 3) |
|
|
As |
913 µg/kg; |
NA |
132 µg/kg; |
846 µg/kg; |
227 µg/kg; |
0.781 mg/kg; |
774 µg/kg; |
13.6 mg/kg; |
|
104% |
105% |
99% |
105% |
112% |
101% |
102% |
||
|
(RPD = 3.2 %) |
(RPD = 0.2 %) |
(RPD = 0.3 %) |
(RSD = 1.6 %) |
(RSD = 2.0 %) |
(RPD = 2.8 %) |
(RSD = 2.0 %) |
||
|
Cd |
NA |
59.2 µg/kg; |
287 µg/kg; |
685 µg/kg; |
96.2 µg/kg; |
0.243 mg/kg; |
450 µg/kg; |
0.150 mg/kg; |
|
103% |
103% |
101% |
103% |
92% |
101% |
101% |
||
|
(RPD = 0.4 %) |
(RPD = 2.1 %) |
(RPD = 0.4 %) |
(RSD = 3.4 %) |
(RSD = 1.5 %) |
(RPD = 1.6 %) |
(RSD = 1.7 %) |
||
|
Cr |
NA |
NA |
NA |
NA |
NA |
NA |
NA |
0.485 mg/kg; |
|
94% |
||||||||
|
(RSD = 1.8 %) |
||||||||
|
Hg |
NA |
NA |
44.0 µg/kg; |
NA |
122 µg/kg; |
NA |
NA |
0.307 mg/kg; |
|
105% |
100% |
97% |
||||||
|
(RPD = 5.0 %) |
(RSD = 1.3 %) |
(RSD = 0.8 %) |
||||||
|
Pb |
296 µg/kg; |
60.7 µg/kg; |
118 µg/kg; |
442 µg/kg; |
184 µg/kg; |
2.30 mg/kg; |
555 µg/kg; |
0.059 mg/kg; |
|
96% |
99% |
102% |
97% |
98% |
99% |
101% |
102% |
|
|
(RPD = 1.2 %) |
(RPD = 0.4 %) |
(RPD = 5.2 %) |
(RPD = 0.6 %) |
(RSD = 1.5 %) |
(RSD = 2.6 %) |
(RPD = 0.2 %) |
(RSD = 1.3 %) |
|
Table 1: Results for toxic elements (As, Cd, Cr, Hg and Pb) in CRMs and QC materials.
|
Analyte |
Mean value and recovery |
||
|
Infant/adult formula |
Peanut butter |
Vegetable oil |
|
|
NIST SRM 1869 |
NIST SRM 2387 |
FAPAS T07533QC |
|
|
(n = 3) |
(n = 3) |
(n = 3) |
|
|
Ca |
4564 mg/kg; |
410 mg/kg; |
NA |
|
100% |
100% |
||
|
(RSD = 1.2 %) |
(RSD = 0.4 %) |
||
|
Cu |
18.0 mg/kg; |
4.62 mg/kg; |
526 µg/kg; |
|
95% |
94% |
96% |
|
|
(RSD = 0.6 %) |
(RSD = 0.7 %) |
(RSD = 0.7 %) |
|
|
Fe |
161 mg/kg; |
15.6 mg/kg; |
792 µg/kg; |
|
98% |
95% |
99% |
|
|
(RSD = 1.1 %) |
(RSD = 1.1 %) |
(RSD = 2.6 %) |
|
|
Mn |
44.8 mg/kg; |
15.4 mg/kg; |
NA |
|
97% |
96% |
||
|
(RSD = 1.6 %) |
(RSD = 1.6 %) |
||
|
Na |
1895 mg/kg; |
4922 mg/kg; |
NA |
|
101% |
101% |
||
|
(RSD = 0.5 %) |
(RSD = 1.4 %) |
||
|
Zn |
144 mg/kg; |
26.6 mg/kg; |
NA |
|
100% |
101% |
||
|
(RSD = 0.1 %) |
(RSD = 1.3 %) |
||
Table 2: Results for nutritional elements (Ca, Cu, Fe, Mn, Na and Zn) in CRMs and QC materials.
Evaluation of greenness, analytical performance and applicability of the method
To effectively and objectively assess the environmental sustainability of the analytical procedures, various greenness metrics have been developed [22]. Recently, a new concept known as White Analytical Chemistry (WAC) has emerged as an extension of Green Analytical Chemistry (GAC) [23]. WAC encompasses not only environmental considerations but also analytical and practical aspects, offering a more comprehensive framework for evaluating the sustainability of an analytical method. In this study, we applied the WAC approach to evaluate the present analytical method. We utilised various analytical metrics, including the Analytical Eco-Scale [15], MoGAPI [16] and ComplexMoGAPI [17] for assessing method greenness, alongside BAGI [18] and RAPI [19] for evaluating the applicability and analytical performance of the method respectively.
Analytical Eco-Scale
The Analytical Eco-Scale assesses the environmental sustainability of an analytical method by evaluating its ecological impacts to the environment [15]. This evaluation employs penalty points as assessment criteria. The analytical eco-score is derived by subtracting the total penalty points from a maximum score of 100. An analytical process yielding a score of 75 points or higher is classified as excellent green. Scores ranging from 50 to 74 points are considered acceptable green, while scores below 50 points are categorised as inadequate green.
In the context of our validated method, a total of twelve penalty points were deducted due to the reagents used, including HNO3, H2O2 and multi-element standards (four penalty points for each). Additionally, two penalty points were deducted for energy consumption attributed to ICP-MS/ICP-OES and microwave oven. Six penalty points were deducted for chemical waste generation and treatment, given that over 10 g of chemical waste was initially generated during the analytical process, and subsequently treated by waste collectors. Consequently, the final score for our method was 80 points, falling within the excellent green classification.
Modified green analytical procedure index (MoGAPI) and complex modified green analytical procedure index (ComplexMoGAPI)
The Green Analytical Procedure Index (GAPI) evaluates the environmental hazards associated with the entire analytical methodology through the use of five coloured pentagrams, covering sampling, type of method, sample preparation, solvents and reagents, and instrumentation respectively [24]. These five pentagrams are subdivided into 15 sections, each corresponding to an aspect of the method. Each section is coloured as green, yellow or red to represent low, medium and high environmental impact respectively. The Modified GAPI (MoGAPI) integrates the visual impact of GAPI with a precise total score derived from the Analytical Eco-Scale [16]. The total score from the MoGAPI assessment is visually represented on a pictogram, with a colour scale surrounding the pentagrams indicating the overall evaluation of the method. The classification remains consistent with that of the Analytical Eco-Scale.
In the ComplexMoGAPI framework, an additional hexagonal segment is introduced to the original GAPI diagram to represent activities conducted prior to sample preparation and final analysis [17,25]. The supplementary hexagon facilitates an assessment of sustainability across various parameters, including production yield and conditions, reagents and solvents, instrumentation, and workup and purification. Consistent with the Analytical Eco-Scale, a method scoring above 75 points is classified as excellent green, while scores between 50 and 74 points are regarded as acceptable green, and scores below 50 points indicate inadequate green.
Utilizing the MoGAPI and ComplexMoGAPI models, our method achieved scores of 64 points and 66 points respectively, both of which are classified as acceptable green. The corresponding pictograms with evaluation scores are illustrated in figures 1a and 1b respectively. A comprehensive evaluation of each category within the MoGAPI and ComplexMoGAPI is provided in table 3 respectively.
|
Category |
Evaluation details in the MoGAPI pentagrams |
|
Sample preparation |
|
|
1 - Collection: |
Off-line |
|
2 - Preservation: |
Chemical or physical |
|
3 - Transport: |
Required |
|
4 - Storage: |
Under normal conditions |
|
5 - Type of method: |
Simple procedures, e.g., filtration, decantation |
|
6 - Scale of extraction: |
Not applicable |
|
7 - Solvents/reagents used: |
Non-green solvents/reagents used |
|
8 - Additional treatment: |
Advanced treatments (derivatization, mineralization, etc.) |
|
Reagent and solvents |
|
|
9 - Amount: |
< 10 mL (< 10 g) |
|
10 - Health hazard: |
Serious injury on short-term exposure, known or suspected small animal carcinogen; National Fire Protection Association (NFPA) health hazard score = 4 |
|
11 - Safety hazard: |
Highest NFPA flammability or instability score of 2 or 3, or a special hazard is used |
|
Instrumentation |
|
|
12 - Energy: |
≤0.1 kWh per sample |
|
13 - Occupational hazard: |
Emission of vapours to the atmosphere |
|
14 - Waste: |
1–10 mL (1–10 g) |
|
15 - Waste treatment: |
Degradation, passivation |
|
16 - QUANTIFICATION: |
Yes |
|
Category |
Evaluation details in the ComplexMoGAPI hexagonal segment |
|
Yield and conditions |
|
|
I - Yield: |
>89% |
|
II - Temperature/time: |
Room temperature, >1 h, Heating, <1 h, Cooling to 0°C |
|
Relation to green economy |
|
|
III - Number of rules met: |
3-4 |
|
Reagent and solvents |
|
|
IVa - Health hazard: |
Serious injury on short-term exposure, known or suspected small animal carcinogen; NFPA health hazard score = 4 |
|
IVb - Safety hazard: |
Highest NFPA flammability or instability score of 2 or 3, or a special hazard is used |
|
Instrumentation |
|
|
Va - Technical setup: |
Additional setups/semi-advanced instruments used |
|
Vb - Energy: |
≤0.1 kWh per sample |
|
Vc - Occupational hazard: |
Emission of vapours to the atmosphere |
|
Workup and purification |
|
|
VIa - Workup and purification of the end product: |
None or simple processes |
|
VIb - Purity: |
Not applicable |
Table 3: Detailed evaluation results of MoGAPI and ComplexMoGAPI for our method.
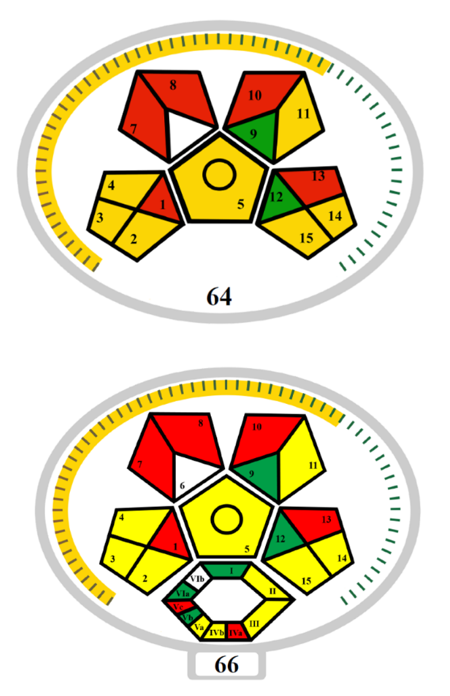
Figure 1: Pictograms of MoGAPI (a) and ComplexMoGAPI (b) showing the assessment scores for the analytical method developed.
Blue applicability grade index (BAGI)
The Blue Applicability Grade Index (BAGI) serves as a tool for assessing the practicality of an analytical method [18]. BAGI evaluates ten main attributes to generate a pictogram and a score that reflects the applicability and practicality of the method. The main attributes considered in BAGI include type of analysis, number of analytes determined simultaneously, analytical technique, number of samples treated simultaneously, sample preparation, number of samples analysed per hour, type of reagents and materials, preconcentration, degree of automation, and amount of sample. A total score of 60 or above is classified as “practical”.
In our assessment, a BAGI score of 77.5 points was attained, categorising our method as practical. The associated pictogram displaying the evaluation scores is depicted in figure 2. A detailed evaluation of each attribute within the BAGI is presented in table 4.
|
Criterion |
Evaluation details in the BAGI pictograms |
|
1. Type of analysis |
Quantitative and confirmatory |
|
2. Multi- or single-element analysis |
Multi-element analysis for 6-15 compounds of the same chemical class or 2-15 compounds of different chemical classes |
|
3. Analytical technique |
Sophisticated instrumentation (LC-MS, GC-MS, ICP-MS, homemade interfaces, homemade automatic systems, etc.) |
|
4. Simultaneous sample preparation |
13-95 |
|
5. Sample preparation |
Multi step sample preparation required (e.g. LLE, SPE and/or derivatization) |
|
6. Samples per h |
5-10 |
|
7. Reagents and materials |
Common commercially available reagents (methanol, acetonitrile, HNO3, nitrogen or other common gasses, etc.) |
|
8. Preconcentration |
No preconcentration required. Required sensitivity and /or legislation criteria are met directly. |
|
9. Degree of automation |
Semi-automated with common devices (e.g. HPLC autosampler) |
|
10. Amount of sample |
<100 μL (or mg) bioanalytical samples; <10 mL (or g) food/environmental |
Table 4: Detailed evaluation results of BAGI for our method.
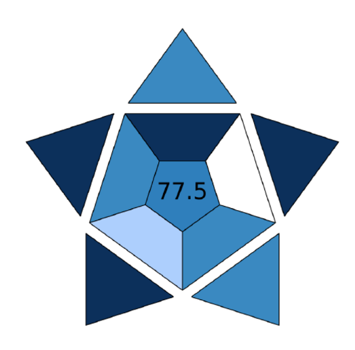
Figure 2: Pictogram of BAGI showing the assessment scores for the analytical method developed.
Red analytical performance index (RAPI)
The Red Analytical Performance Index (RAPI) is a tool designed to evaluate the performance of analytical methods, emphasising factors such as accuracy, precision, sensitivity, and robustness, thereby complementing other greenness assessment tools [19]. RAPI is aligned with established validation guidelines and good laboratory practices, incorporating a variety of versatile criteria to present a comprehensive overview of performance. Additionally, it conveys information in a straightforward graphical manner.
Our method achieved an RAPI score of 82.5 points. The associated pictogram illustrating the evaluation scores is shown in figure 3. A detailed evaluation of each criterion within the RAPI is provided in table 5.
|
Criterion |
Evaluation details in the RAPI pictograms |
|
|
Repeatability |
Concentration (%) |
c ≤ 0.0001% (1 ppm) |
|
RSD (%) |
< 4.0 |
|
|
Intermediate precision |
Concentration (%) |
c ≤ 0.0001% (1 ppm) |
|
RSD (%) |
< 8.0 |
|
|
Reproducibility |
Concentration (%) |
Not applicable* |
|
RSD (%) |
||
|
Trueness |
Concentration (%) |
c ≤ 0.0001% (1 ppm) |
|
Bias/error (%) |
< 10.0, confirmed with CRMs |
|
|
Recovery & matrix effect |
Concentration (%) |
c ≤ 0.0001% (1 ppm) |
|
Recovery (%) |
> 90, < 107; acceptable ME |
|
|
LOQ (% of expected mean analyte concentration in the matrix) |
LOQ < 1% |
|
|
Working range |
Wider than 100×LOQ |
|
|
Simplified linearity estimation |
R^2 > 0.99 |
|
|
Ruggedness/robustness |
Demonstrated for 2 factors |
|
|
Selectivity |
Demonstrated for 5 or more potential interferents |
|
Note: *According to Appendix F: Guidelines for Standard Method Performance Requirements of Official Methods of Analysis of AOAC INTERNATIONAL (22nd edition) 27, for evaluating the reproducibility of a quantitative method, it is necessary to recruit 10-12 collaborators. It must have eight valid data sets. Two blind duplicate replicates at five concentrations for each analyte/matrix combination should be provided to each collaborator.
Table 5: Evaluation results of RAPI for the reported method.
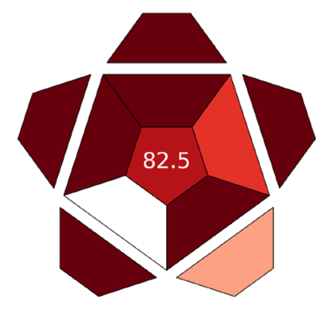
Figure 3: Pictogram of RAPI shown the assessment scores for the analytical method developed.
Comparison with other methods
Recently, a comprehensive assessment study of the greenness and practicality of a total of 16 methods for the determination of metals was conducted [26]. In this work, we compared the analytical metric scores attained by our method with those obtained by the methods reported in the assessment study. For MoGAPI, our method attained a score of 64, which was comparable to the highest score reported in the assessment study. For BAGI, our score of 77.5 did not represent the highest value found in the literature, our method was nonetheless deemed practical, significantly exceeding the threshold of 60 points which are considered to indicate good practicality. More importantly, our eco-friendly method demonstrated its wide applicability to all the food matrices being examined.
Conclusion
We have developed an eco-friendly microwave-assisted digestion method for the determination of toxic elements (arsenic, cadmium, chromium, lead, and mercury) and nutritional elements (calcium, copper, iron, manganese, sodium, and zinc) across a variety of food samples utilising ICP-MS and ICP-OES. The quantity of concentrated nitric acid used has been reduced to half compared to existing international standards, resulting in a corresponding decrease in acid waste production. The methodology has been validated across a diverse array of food matrices, with reference to the nine sectors of the AOAC food triangle. Recovery results for various CRMs and QC materials fell within the acceptable ranges for the respective CRMs/QC materials which ensure the quality assurance of the method. Furthermore, for precision analysis, the RPD/RSD obtained from replicate analyses of test samples were found to be not more than 5%. Satisfactory scores were achieved across various analytical metrics, including the Analytical Eco-Scale, MoGAPI, ComplexMoGAPI, BAGI, and RAPI. The robust validation results in respect of accuracy and precision, together with satisfactory scores for the analytical metrics, demonstrated that our method was applicable to general foodstuffs with commendable analytical performance.
Author contributions
Yuk-Tai Tsoi: Conceptualization, Data curation, Methodology, Supervision, Validation, Writing – original draft; Kwok-Chu Chan: Conceptualization, Methodology, Supervision, Validation, Writing – review & editing; Chun-Kuen Cheung: Data curation, Validation; Wai-Ling Cheung: Data curation, Validation; Yiu-Chung Yip: Conceptualization, Methodology, Project administration, Writing – review & editing.
Statements and Declarations
Conflict of interest
The authors declare that there are no competing interests relevant to the content of this article.
Data availability
The authors confirm that the data supporting the findings of this study are available within the article and its supplementary information (SI). Tables S1a to S1c, S2a to S2c, S3a to 3b, S4 to S7 are provided in SI. Data will be made available on request.
Acknowledgments
The authors wish to express their sincere gratitude to Dr. Wai-On Lee, Dr. Tsz-Chun Cheung and Mr. Chi-Shing Ng of the Government Laboratory of the HKSAR for their unwavering support. The views expressed in this paper do not necessarily reflect those of the Government of the HKSAR, and the mention of trade names or commercial products does not imply endorsement or recommendation for use.
References
- World Health Organization of the United Nations. Fact sheets - Food safety (4 October 2024). World Health Organization of the United Nations (2025).
- Scutaraşu EC, Trincă LC. Heavy Metals in Foods and Beverages: Global Situation, Health Risks and Reduction Methods. Foods 12 (2023): 3340.
- Gharibzahedi SMT, Jafari SM. The importance of minerals in human nutrition: Bioavailability, food fortification, processing effects and nanoencapsulation. Trends in Food Science & Technology 62 (2017): 119-132.
- Codex Alimentarius. CXS 193-1995 (2024) General Standard for Contaminants and Toxins in Food and Feed, Amended in 2024. Food and Agriculture Organization and World Health Organization of the United Nations.
- Codex Alimentarius. CXS 72-1981 Standard for Infant Formula and Formulas for Special Medical Purposes Intended for Infants, Amended in 2024. Food and Agriculture Organization and World Health Organization of the United Nations (2024).
- International Organization for Standardization. BS EN ISO 21424:2020, Milk, milk products, infant formula and adult nutritionals – Determination of minerals and trace elements – Inductively coupled plasma mass spectrometry (ICP-MS) method. International Organization for Standardization.
- United States Food & Drug Administration. Section 4.7, Version 1.3 (2025), Elemental Analysis Manual, Inductively Coupled Plasma-Mass Spectrometric Determination of Arsenic, Cadmium, Chromium, Lead, Mercury, and Other Elements in Food Using Microwave Assisted Digestion. United States Food & Drug Administration.
- Anastas PT. Green Chemistry and the Role of Analytical Methodology Development. Critical Reviews in Analytical Chemistry 29 (1999): 167-175.
- Armenta S, Garrigues S, de la Guardia M. Green Analytical Chemistry. Trends in Analytical Chemistry 27 (2008): 497-511.
- Gałuszka A, Migaszewski Z, Namieśnik J. The 12 principles of green analytical chemistry and the SIGNIFICANCE mnemonic of green analytical practices. Trends in Analytical Chemistry 50 (2013): 78-84.
- Benedé JL, Cagliero C, Nemutlu E, et al. Greenness assessment of 174 CEN, ISO, and pharmacopoeia standard methods and their sub-methods used for environmental, food, trace element and pharmaceutical analyses. Advances in Sample Preparation 14 (2025): 100180.
- Wolf WR, Andrews KW. A system for defining reference materials applicable to all food matrices. Fresenius Journal of Analytical Chemistry 352 (1995): 73-76.
- Phillips MM, Sharpless KE, Wise SA. Standard reference materials for food analysis. Analytical and Bioanalytical Chemistry 405 (2013): 4325-4335.
- Cantwell H, ed. Eurachem Guide: The Fitness for Purpose of Analytical Methods – A Laboratory Guide to Method Validation and Related Topics. 3rd (2025).
- Gałuszka A, Konieczka P, Migaszewski ZM, et al. Analytical Eco-Scale for assessing the greenness of analytical procedures. TrAC Trends in Analytical Chemistry 37 (2012): 61-72.
- Mansour FR, Płotka-Wasylka J, Locatelli M. Modified GAPI (MoGAPI) Tool and Software for the Assessment of Method Greenness: Case Studies and Applications. Analytica 5 (2024): 451-457.
- Mansour FR, Omer KM, Płotka-Wasylka J. A total scoring system and software for complex modified GAPI (ComplexMoGAPI) application in the assessment of method greenness. Green Analytical Chemistry 10 (2024): 100126.
- Manousi N, Wojnowski W, Płotka-Wasylka J, et al. Blue applicability grade index (BAGI) and software: a new tool for the evaluation of method practicality. Green Chemistry 25 (2023): 7598-7604.
- Nowak PM, Wietecha-Posłuszny R, Pawliszyn J. Red analytical performance index (RAPI) and software: the missing tool for assessing methods in terms of analytical performance. Green Chemistry 27 (2025): 5546-5553.
- Ariga T, Zhu Y, Inagaki K. Study on carbon-induced signal enhancement in inductively coupled plasma mass spectrometry: an approach from the spatial distribution of analyte signal intensities. Journal of Analytical Atomic Spectrometry 34 (2019): 1865-1874.
- Amaral CDB, Amais RS, Fialho LL, et al. Determination of carbon in digested samples and amino acids by inductively coupled plasma tandem mass spectrometry. Microchemical Journal 122 (2015): 29-32.
- Yin L, Yu L, Guo Y, et al. Green analytical chemistry metrics for evaluating the greenness of analytical procedures. Journal of Pharmaceutical Analysis 14 (2024): 101013.
- Nowak PM, Wietecha-Posłuszny R, Pawliszyn J. White Analytical Chemistry: An approach to reconcile the principles of Green Analytical Chemistry and functionality. Trends in Analytical Chemistry 138 (2021): 116223.
- Płotka-Wasylka J. A new tool for the evaluation of the analytical procedure: Green Analytical Procedure Index. Talanta 181 (2018): 204-209.
- Płotka-Wasylka J, Wojnowski W. Complementary green analytical procedure index (ComplexGAPI) and software. Green Chemistry 23 (2021): 8657-8665.
- Bhalodia A, Desai S. Comprehensive assessment of greenness of ICP-OES methods for determination of metals. Green Analytical Chemistry 12 (2025): 100222.
- Latimer GW Jr, ed. Appendix F: Guidelines for Standard Method Performance Requirements. Official Methods of Analysis of AOAC International. 22nd New York: AOAC Publications (2023).