Konstantinos Francis1*, Ioannis Vogindroukas2, Nikolaos Petridis3
1“Heba” Clinic for Autism & Communication Disorders, Kuwait Centre for Mental Health, Kuwait.
2Department of Educational and Social Policy, University of Macedonia, Greece.
3Department of Psychology, Anatolia University, Greece.
*Corresponding Author: Konstantinos Francis, MD, PhD, Consultant Child & Adolescent Psychiatrist, “Heba” Clinic for Autism & Communication Disorders, Kuwait Centre for Mental Health, Kuwait.
Received: 29 July 2026; Accepted: 04 August 2026; Published: 11 August 2026.
DOI: 10.26502/jppd.2572-519X0281
ShareLanguage heterogeneity is a well-recognized feature of autism spectrum disorder (ASD), yet the nature of structural language profiles remains incompletely understood. This study investigated structural language abilities in 46 verbally fluent Greek-speaking children with ASD (4–8 years) and average-range nonverbal intelligence using standardized assessments of expressive vocabulary, grammar, and informational language. Data-driven clustering methods were applied to identify empirically derived structural language profiles and examine whether profile membership was associated with autism symptom severity or nonverbal IQ. Both k-means and hierarchical clustering converged on a three-profile solution with strong agreement (91.3%; Adjusted Rand Index = 0.75). Bootstrap resampling (10,000 iterations) demonstrated high stability, with the k-means solution showing particularly strong reproducibility. The Low profile was characterized by generalized structural language impairment, whereas the High profile showed consistently strong performance. A distinctive Medium profile demonstrated selective expressive vocabulary weakness despite relatively preserved grammar and informational language, indicating that structural language differences in ASD are multidimensional rather than reflecting a simple continuum of severity. Multinomial regression analyses found no reliable associations between language-profile membership and ADOS Social Affect, calibrated autism severity, or nonverbal IQ. These findings provide preliminary evidence that verbally fluent autistic children exhibit internally reproducible structural language profiles largely independent of autism severity and cognitive ability. The identification of a selective vocabulary profile highlights the importance of comprehensive, domain-specific language assessment and supports individualized intervention planning based on patterns of linguistic strengths and weaknesses rather than overall language level.
Structural language profiles, Autism, Greek, Word finding, Cluster analysis.
Structural language profiles articles; Autism articles; Greek articles; Word finding articles; Cluster analysis articles
1. Introduction
Since the introduction of DSM-5, language ability has no longer been used to distinguish autism subtypes, such as Autistic Disorder and Asperger syndrome. Instead, language impairment is treated as a clinical specifier, indicating the presence or absence of language difficulties within the autism spectrum [1]. In addition, deficits in verbal and nonverbal pragmatic communication are considered central to the impairments in social communication and social interaction that characterize autism. The 11th edition of the International Classification of Diseases (ICD-11) adopts a somewhat different approach by placing greater emphasis on functional spoken language. Together with the presence or absence of intellectual disability, the degree of language impairment is used to define several diagnostic categories within autism spectrum disorder [2]. Similarly, the Lancet Commission on the Future of Care and Clinical Research in Autism proposed the category of profound autism for individuals older than eight years who meet the diagnostic criteria for ASD and who present with either substantial intellectual disability (e.g., an intelligence quotient below 50), absent or very limited spoken language (e.g., inability to communicate with an unfamiliar person using comprehensible sentences), or both [3].
The study of language abilities and language profiles in individuals with ASD has attracted considerable attention for decades, particularly regarding the distinction between autistic individuals with and without language impairment [4]. Language impairment is now regarded as a specifier rather than an intrinsic feature of autism, reflecting the substantial linguistic heterogeneity observed across the autism spectrum [5]. Although pragmatic language (and prosody) has traditionally been considered the primary area of difficulty in autism, increasing attention has recently been directed towards structural language impairments, including delayed morphosyntactic development, reduced grammatical complexity, and deficits in language comprehension and production, as well as their interaction with pragmatic abilities [6, 7]. Previous research has proposed broad language phenotypes within ASD: (a) autistic individuals without structural language impairment, who exhibit intact morphosyntax, relatively preserved phonology, generally age-appropriate vocabulary, but marked pragmatic difficulties; (b) autistic individuals with structural language impairment extending beyond pragmatics, characterised by deficits in grammar, sentence comprehension, morphology, lexical development, and narrative organisation that resemble those observed in developmental language disorder; and (c) minimally verbal or non-speaking autistic individuals, whose receptive language abilities may substantially exceed their expressive language skills [5].
Person-centred studies have also used cluster or latent-profile methods to examine language heterogeneity in autism. Earlier longitudinal work identified broad subgroups differentiated by language, social, and nonverbal functioning and found that school-age subgroup membership was more strongly related to preschool cognitive functioning than to autism-symptom severity [8]. Subsequent studies identified five combinations of structural language and nonverbal cognition in verbal school-age children [9], three language and social-communication profiles in toddlers and preschoolers [10], three caregiver-reported levels of receptive language comprehension across a broad age range [11], and longitudinal language-unimpaired, language-impaired, and minimally verbal profiles in French-speaking preschoolers [12]. These solutions are not directly interchangeable because they differ in age, sampling, measures, and the variables entered into clustering, but collectively they support a person-centred approach to language heterogeneity.
Building on this evidence and with the aim of facilitating both differential diagnosis and a better understanding of the therapeutic needs of autistic individuals, we previously proposed a language profile classification comprising four subtypes: (1) autistic individuals with pragmatic language impairment in the absence of other language difficulties; (2) autistic individuals with co-occurring Developmental Language Disorder (DLD) and/or other developmental speech disorders, such as Childhood Apraxia of Speech (CAS) or Speech Sound Disorder (SSD); (3) autistic individuals with co-occurring intellectual disability, characterised by global delays in language development and cognitive functioning; and (4) autistic individuals with severe impairments in social communication and social interaction, whose language difficulties arise primarily as a consequence of limited use of language as a communicative tool [13].
The present study focused on verbally fluent Greek-speaking children with ASD and had four objectives: (a) to evaluate structural language abilities using standardized Greek language assessments; (b) to identify empirically derived structural language profiles based on performance across these assessments; (c) to examine whether autism severity and nonverbal IQ were associated with profile membership; and (d) to characterize the linguistic features of the identified profiles. The identified profiles should be interpreted as patterns of language performance rather than clinical ASD subtypes.
2. Materials and Methods
2.1 Participants
The study sample comprised 46 monolingual native Greek-speaking children aged 4–8 years with a clinical diagnosis of autism spectrum disorder (ASD) who were recruited from 2 public psychiatric clinics in Athens, Greece. All participants met the DSM-5 diagnostic criteria for ASD, as ascertained by a child psychiatrist (KF) and in most cases the diagnosis was corroborated using the Autism Diagnostic Observation Schedule (ADOS). Eligible participants were required to have a nonverbal IQ of at least 70, as measured by Raven's Coloured Progressive Matrices or by clinical judgement, and fluent speech as defined in the ADOS-2: producing a range of flexible sentence types, providing language beyond the immediate context, and describing logical connections within a sentence, corresponding to the expressive language abilities expected of a typically developing 4-year-old child. Participants were excluded if they were non-native or bilingual Greek speakers, had significant hearing impairment, even after correction, or were attending a special school.
2.2 Instruments
ADOS-2. The Autism Diagnostic Observation Schedule – 2nd edition (ADOS-2) [14] is a semi-structured, standardized assessment that uses a range of activities and examiner prompts ("presses") to elicit social and communicative behaviours relevant to the diagnosis of ASD. It is widely regarded as one of the gold-standard diagnostic instruments for autism. The appropriate module is selected according to the individual's chronological age and expressive language level and requires approximately 35–40 minutes to administer. Each module includes a diagnostic algorithm that classifies individuals as meeting criteria for autism or autism spectrum disorder and provides a calibrated severity score. For all tested cases, Module 3 was delivered by KF who is trained as an ADOS trainer.
The Raven’s Coloured Progressive Matrices (CPM) is a standardized, reliable, and time-efficient measure of nonverbal reasoning that is widely used in studies involving young children [15]. The test consists of 36 visual patterns, each with one missing element. For every item, participants select the correct piece from several alternatives to complete the pattern. The total raw score was converted to age-adjusted percentile ranks and subsequently to standardized (non-verbal) IQ scores using the Greek normative data.
The Word Finding Vocabulary Test [16] assesses expressive vocabulary through picture naming. It consists of 50 black-and-white drawings of common objects that participants are asked to name. Administration is discontinued after five consecutive incorrect responses. The Greek adaptation of the test, standardized for Greek-speaking children aged 4–8 years, was used in the present study [17].
The Action Picture Test [18] comprises two subscales assessing informational (content) competence and morphosyntactic ability in children aged 3.5–8 years. Informational competence refers to the child's ability to identify and describe the essential information depicted in each picture in response to the examiner's questions. The morphosyntactic subscale evaluates the correct use of grammatical structures, including verb tense, noun number, subject–verb agreement, subordinate clauses, conjunctions, and definite articles. The Greek version has been standardized for Greek-speaking children aged 4–8 years [19].
Operational definition of structural language: In the present study, the term structural language profile refers to an individual's pattern of performance across three core domains of structural language: expressive vocabulary, morphosyntactic ability (grammar), and informational language. These domains were assessed using standardized Greek language tests with normative data for children aged 4–8 years. The construct is limited to the three observed test scores and does not cover receptive language, phonology, narrative structure, spontaneous syntax, or pragmatics. Language profiles were not predetermined according to arbitrary cut-off scores but emerged empirically through cluster analysis based on children's combined performance across the three standardized measures. Consequently, the identified profiles represent statistically derived patterns of structural language ability rather than diagnostic categories or clinically predefined phenotypes.
2.3 Statistical Analysis
To investigate whether distinct language profiles could be identified within the sample, participants were classified according to their percentile scores on the three language measures: vocabulary, information, and grammar. Because percentile ranks are a non-linear, bounded transform of the underlying ability scale, we conducted a sensitivity analysis in which the three measures were re-expressed as interval-scaled scores via an inverse-normal (probit) transform of the percentile ranks; the clustering pipeline was then repeated on these scores. Before clustering, all scores were standardized (z-scores) to ensure equal contribution of each variable to the distance calculations.
Before considering the number of clusters, we assessed cluster tendency, since partitioning algorithms impose clusters even on unstructured data. We computed the Hopkins statistic against a uniform-null reference, the gap statistic (which compares within-cluster dispersion with that expected under a uniform reference distribution), the average silhouette width across candidate solutions, and the Bayesian Information Criterion for Gaussian finite-mixture models. The three-cluster solution was then treated as a descriptive segmentation whose value rests on its reproducibility and interpretability rather than on a claim of discrete latent structure.
Two complementary clustering approaches were applied. First, k-means clustering was performed using Lloyd's algorithm with 100 random initializations (nstart = 100) and a maximum of 100 iterations per initialization (iter.max = 100), with multiple initializations, the solution with the lowest total within-cluster sum of squares was retained. No empty clusters occurred in the reported solution. All stochastic steps were run under a fixed random seed (set. Seed (123)) for exact reproducibility. Second, agglomerative hierarchical clustering using Ward's minimum-variance method (Ward.D2) with Euclidean distance was conducted. Second, agglomerative hierarchical clustering using Ward's minimum-variance method (Ward.D2) with Euclidean distance was conducted.
Because Ward's method and k-means both minimize within-cluster squared Euclidean variation, their agreement constitutes a related rather than fully independent check. We therefore additionally applied two methodologically distinct approaches: partitioning around medoids (PAM) with a robust Manhattan distance, and a Gaussian finite-mixture model (model-based clustering, with the covariance structure and number of components selected by the Bayesian Information Criterion). Concordance among the partitions was quantified with the Adjusted Rand Index.
We further assessed the stability of the identified profile structures with respect to the particular sample of children — that is, whether the same profiles would re-emerge if the data were slightly perturbed. To address this, the stability of both the k-means and the Ward.D2 hierarchical solutions was assessed by means of a non-parametric bootstrap. In each of 10,000 replications, a bootstrap sample of the same size was drawn with replacement, and the three language measures were re-standardised. For each method, the clustering was re-estimated on the resample k-means as specified above, and the hierarchical solution by recomputing the Euclidean distance matrix, re-applying Ward.D2 linkage, and cutting the resulting dendrogram at three clusters. In every resample, and for each method, the three resampled clusters were labelled Low, Medium and High by ordering them on their mean language score, so that they could be matched to the corresponding profiles of that method's original full-sample solution. Each resampled partition was then compared with the original, over the children common to both, using the Adjusted Rand Index and the proportion of children assigned to the same profile. Consistently high values of these indices across replications would indicate that the cluster structure is reproducible and does not depend unduly on individual cases.
Because resampling with replacement duplicates observations, and duplicated observations are necessarily co-assigned, the with-replacement bootstrap can overstate stability at small sample sizes, we therefore additionally assessed stability by subsampling, drawing random 80% subsets without replacement and computing clusterwise Jaccard coefficients (values above 0.75 indicating stable clusters), which we treat as the more conservative estimate. The Adjusted Rand Index is invariant to cluster labelling; for the same-profile proportion, resampled labels were aligned to the reference solution by optimal (Hungarian) assignment on the contingency table before agreement was computed.
All analyses were performed in R version 4.4.2 (R Core Team). Cluster analyses used the base stats functions kmeans (Lloyd's algorithm) and hclust (Ward.D2), with the cluster package for the gap statistic, silhouette widths and partitioning around medoids; cluster tendency was assessed with the Hopkins statistic. Model-based clustering and the Adjusted Rand Index used the mclust package, multinomial logistic regression used the nnet package, and descriptive statistics used the psych package, figures were produced with ggplot2. All stochastic procedures, including k-means initialisation and the bootstrap and subsampling stability analyses, were run under a fixed random seed (set.seed(123)) to ensure exact reproducibility. The number of clusters was examined using the within-cluster sum-of-squares (elbow) plot together with three internal validity indices: the average silhouette width, the Calinski–Harabasz index, and the gap statistic, computed for two- to five-cluster solutions.
3. Results
We first describe the demographic, cognitive, diagnostic, and language characteristics of the sample. We then examine the distribution of language scores, identify distinct language profiles, and evaluate the clinical and cognitive characteristics associated with these profiles.
No internal index identified three clusters as statistically optimal: the average silhouette width and the Calinski–Harabasz index were marginally highest at two clusters (0.45 and 46.8, versus 0.40 and 42.7 at three), and the gap statistic increased monotonically across k (0.16, 0.22, 0.25 and 0.27 for k = 2 to 5). We nonetheless retained the three-cluster solution as a descriptive segmentation on grounds of interpretability, parsimony and reproducibility. The two-cluster solution reduces essentially to a single overall-language contrast, whereas only the three-cluster solution isolates the dissociation between expressive vocabulary and grammar/information — the Medium profile, that constitutes the study's substantive contribution and that proved highly reproducible under subsampling (mean clusterwise Jaccard = 0.94) and across clustering algorithms (Adjusted Rand Index 0.74–0.76). Consistent with the cluster-tendency analysis, we therefore present the three-cluster solution not as an estimate of a statistically optimal number of latent classes but as an interpretable, reproducible partition of a largely continuous distribution.
3.1 Sample Characteristics
As presented in Table 1, the sample comprised 46 children with ASD (mean age = 6.68 years, SD = 1.35). General cognitive ability was available for 22 children and was within the average range (Raven's CPM: M = 102.27, SD = 16.74; median = 97.5). ADOS-2 data were available for 37 children. The mean Social Affect score was 8.22 (SD = 3.76), and the mean calibrated severity score (CSS) was 5.97 (SD = 2.36; range = 3–10).
Table 1: Descriptive statistics of the demographic, diagnostic and language measures (N = 46).
|
Measure |
N |
M |
SD |
Mdn |
Min |
Max |
|
Age (years) |
46 |
6.68 |
1.35 |
6.85 |
3.11 |
8.9 |
|
IQ (Raven) |
22 |
102.27 |
16.74 |
97.5 |
70 |
135 |
|
ADOS Social Affect |
37 |
8.22 |
3.76 |
8 |
2 |
17 |
|
ADOS severity (CSS) |
37 |
5.97 |
2.36 |
6 |
3 |
10 |
|
Vocabulary (percentile) |
46 |
56.74 |
28.46 |
60 |
5 |
95 |
|
Information (percentile) |
46 |
66.96 |
24.66 |
75 |
10 |
90 |
|
Grammar (percentile) |
46 |
60.87 |
23.55 |
70 |
10 |
90 |
Note. M = mean; SD = standard deviation; Mdn = median; CSS = calibrated severity score. IQ was assessed with Raven’s Coloured Progressive Matrices; vocabulary with the Word Finding Vocabulary Test (Greek edition); information and grammar with the Action Picture Test (Greek edition). “Percentile” denotes percentile rank. IQ data were available for 22 children and ADOS scores for 37 children.
The standardized percentile norms are coarsely banded, so the three measures took only 8–10 distinct values each and were heavily tied (46 of 46 children tied on vocabulary and information; 44 of 46 on grammar). On vocabulary, 2 children scored at the floor (5th percentile) and 4 at the ceiling (95th), on information, 2 at the floor (10th) and 14 at the ceiling (90th); and on grammar, 1 at the floor (10th) and 8 at the ceiling (90th). Only 6 children reached an extreme bound on any measure. Because tied, banded scores can affect squared-Euclidean distances, we verified that the solution did not depend on the distance metric: partitioning around medoids with a Manhattan distance reproduced the partition (Adjusted Rand Index = 0.76), and the solution was stable under subsampling (mean clusterwise Jaccard = 0.94).
Mean percentile scores on the language measures were 56.74 (SD = 28.46) for vocabulary (Word Finding Vocabulary Test), 66.96 (SD = 24.66) for information, and 60.87 (SD = 23.55) for grammar (Action Picture Test). Although the group means were close to, or slightly above, the 50th percentile, variability was substantial. Standard deviations ranged from 23 to 28 percentile points, and scores spanned almost the entire percentile range (5–95), indicating marked heterogeneity in language abilities across participants.
Descriptively, vocabulary yielded the lowest median percentile score (60), whereas information yielded the highest (75), suggesting that expressive word-finding was, on average, the weakest of the three language domains.
3.2 Language Profiles
Formal clusterability was modest. The Hopkins statistic was 0.59 (uniform-null reference ≈ 0.48); the gap statistic increased approximately monotonically with the number of clusters and favoured a single cluster under the standard criterion; the average silhouette width was maximised at two clusters (0.45; three clusters = 0.40); and Gaussian-mixture model selection favoured four components by BIC. Taken together, these indices indicate that structural language ability in this sample is largely continuous rather than composed of well-separated clusters. The three-profile partition is therefore retained as a reproducible descriptive segmentation (see below) rather than as evidence of discrete latent classes.
The number of clusters was empirically determined through visual inspection of the within-cluster sum-of-squares (elbow) plot indicated that the reduction in within-cluster variance became progressively smaller beyond three clusters, with additional clusters yielding only marginal improvements, thus being consistent with a three-cluster solution. Both clustering methods were specified to identify three clusters and produced highly similar solutions. To facilitate comparison, clusters from each method were ordered according to their mean language score and labelled Low, Medium, and High (Table 2). The k-means analysis identified 14, 10, and 22 children in the Low, Medium, and High clusters, respectively, whereas the hierarchical analysis identified 12, 9, and 25 children.
The Low cluster was characterised by consistently weak performance across all three language measures (k-means: vocabulary = 36.8, information = 36.4, grammar = 34.3; hierarchical: vocabulary = 26.7, information = 31.7, grammar = 39.2), indicating a generalized language impairment. In contrast, the High cluster demonstrated consistently strong performance across all domains (k-means: vocabulary = 81.4, information = 82.7, grammar = 70.0).
Because the profile labels denote relative standing within this sample rather than clinical categories, we examined the proportion of children in each profile scoring at or below the 10th percentile, a conventional impairment cut-off. Clinical-level low scores were uncommon. In the Low profile (means near the 34th–37th percentile, i.e. the low-average range), 3 of 14 children (21%) scored at or below the 10th percentile on vocabulary, 2 of 14 (14%) on information, and 1 of 14 (7%) on grammar. In the Medium profile, 1 of 10 children (10%) scored at or below the 10th percentile on vocabulary, and none did so on information or grammar. No child in the High profile scored at or below the 10th percentile on any measure. Across the full sample, only 9%, 4% and 2% of children fell at or below the 10th percentile on vocabulary, information and grammar.
Table 2: Mean language percentile scores of the three clusters obtained by k-means and hierarchical clustering.
|
Cluster |
n |
Vocabulary |
Information |
Grammar |
Mean language score |
|
k-means |
|||||
|
Low |
14 |
36.8 |
36.4 |
34.3 |
35.8 |
|
Medium |
10 |
30.5 |
75 |
78 |
61.2 |
|
High |
22 |
81.4 |
82.7 |
70 |
78 |
|
Hierarchical (Ward.D2) |
|||||
|
Low |
12 |
26.7 |
31.7 |
39.2 |
32.5 |
|
Medium |
9 |
33.3 |
77.8 |
78.9 |
63.3 |
|
High |
25 |
79.6 |
80 |
64.8 |
74.8 |
Note. Values are mean percentile ranks for each language measure; n = number of children per cluster; “Mean language score” is the mean of the three measures. Clusters were ordered and labelled Low, Medium and High according to their mean language score. Vocabulary was assessed with the Word Finding Vocabulary Test (Greek edition); information and grammar with the Action Picture Test (Greek edition). Both analyses were performed on standardized scores; hierarchical clustering used Ward’s minimum-variance method (Ward.D2) with Euclidean distance.
To characterise within-profile heterogeneity rather than centroids alone, Table 3 reports the standard deviation, interquartile range, range and 95% confidence interval for each measure within each profile. Homogeneity varied across profiles. The Medium and High profiles were relatively homogeneous on their defining dimensions (within-profile coefficients of variation 0.11–0.22); notably, the vocabulary dissociation defining the Medium profile was present in all ten of its members — each scored at or below the 40th percentile on vocabulary and at or above the 50th on information and grammar — indicating that it does not arise from a few extreme cases. The Low profile was more heterogeneous, with standard deviations of approximately 19–22 percentile points and scores spanning the 5th–70th percentiles, consistent with its representing the lower, more variable region of a largely continuous distribution rather than a tightly bounded group.
Table 3: Within-profile distribution of the three language measures (k-means solution): mean, standard deviation, 95% confidence interval for the mean, median, interquartile range, and range (percentile ranks).
|
Profile |
Measure |
M |
SD |
95% CI |
Mdn |
IQR |
Range |
|
Low (n = 14) |
Vocabulary |
36.8 |
21.8 |
[24.2, 49.4] |
35 |
22–55 |
5–70 |
|
Information |
36.4 |
19.5 |
[25.2, 47.7] |
40 |
20–50 |
10–70 |
|
|
Grammar |
34.3 |
18.7 |
[23.5, 45.1] |
25 |
20–50 |
10–70 |
|
|
Medium (n = 10) |
Vocabulary |
30.5 |
12.1 |
[21.8, 39.2] |
35 |
22–40 |
5–40 |
|
Information |
75 |
12.7 |
[65.9, 84.1] |
80 |
70–80 |
50–90 |
|
|
Grammar |
78 |
10.3 |
[70.6, 85.4] |
80 |
70–88 |
60–90 |
|
|
High (n = 22) |
Vocabulary |
81.4 |
12.3 |
[75.9, 86.8] |
85 |
70–90 |
60–95 |
|
Information |
82.7 |
9.4 |
[78.6, 86.9] |
90 |
80–90 |
60–90 |
|
|
Grammar |
70 |
15.1 |
[63.3, 76.7] |
70 |
60–80 |
40–90 |
Note. Values are percentile ranks. M = mean; SD = standard deviation; CI = confidence interval for the mean (t-based); Mdn = median; IQR = interquartile range (25th–75th percentile). Profiles were derived by k-means clustering; labels denote relative standing within this verbally fluent sample and do not imply clinical impairment. Vocabulary was assessed with the Word Finding Vocabulary Test (Greek edition); information and grammar with the Action Picture Test (Greek edition).
The Medium cluster displayed a distinctive dissociated profile rather than simply representing an intermediate level of language ability. In both clustering solutions, expressive vocabulary remained low (k-means = 30.5; hierarchical = 33.3), comparable to that of the Low cluster, whereas information and grammar scores were high (k-means = 75.0 and 78.0; hierarchical = 77.8 and 78.9), approaching those of the High cluster. Consequently, the group's intermediate overall language score (k-means = 61.2; hierarchical = 63.3) masked a selective weakness in expressive vocabulary alongside relatively preserved grammatical and informational abilities in connected speech. The consistency of this dissociated pattern across both clustering methods suggests that it represents a genuine feature of the data rather than an artefact of a particular algorithm.
Agreement between the k-means and hierarchical classifications was assessed by cross-tabulating cluster assignments (Figure 1). The two methods assigned 42 of the 46 children (91.3%) to the same language profile, yielding an Adjusted Rand Index (ARI) of 0.75, indicative of strong agreement. A chi-square test confirmed a highly significant association between the two classifications, χ²(4) = 70.58, p < .001. Because several expected cell frequencies were below five, the finding was confirmed using a Monte Carlo permutation test (200,000 permutations), which produced the same conclusion (p < .001). The four discrepant cases included three children classified as Low by k-means but High by hierarchical clustering and one child classified as Low by k-means but Medium by hierarchical clustering. Overall, the close agreement between the two methods supports the robustness of the three-profile solution.
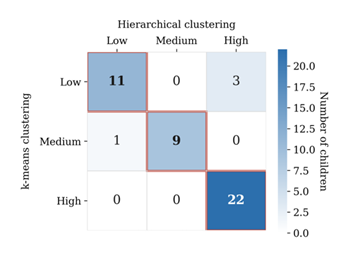
Figure 1: Cross-tabulation of the language-profile assignments produced by k-means and hierarchical clustering (N = 46). Diagonal cells (outlined) represent children assigned to the same profile by both methods.
The solution was also robust to the scaling of the input variables. Re-expressing the three measures as interval-scaled scores via an inverse-normal (probit) transform of the percentile ranks yielded profiles of comparable size (14/12/20 vs 14/10/22) and strong agreement with the percentile-based partition (Adjusted Rand Index = 0.87; 95.7% of children assigned to the same profile), confirming that the three-profile structure is not an artefact of the percentile metric.
The composition of the three-profile partition was corroborated by two methodologically distinct algorithms. When each was set to three groups, partitioning around medoids with a Manhattan distance and a Gaussian finite-mixture model both recovered the k-means structure (Adjusted Rand Index = 0.76 and 0.74, respectively; Ward = 0.75). This concordance concerns the assignment of children to profiles rather than the number of profiles, which the cluster-tendency analysis showed to be weakly determined.
Principal component analysis was used to visualise the cluster structure (Figure 2). The three standardized language measures were projected onto the first two principal components. The first principal component primarily reflected overall language ability and clearly separated the High and Low clusters, whereas the second component captured the contrast between vocabulary and the grammar and information measures, clearly distinguishing the Medium cluster. In both clustering solutions, the three profiles occupied largely non-overlapping regions of the component space. In particular, the Medium cluster formed a compact and well-defined group rather than occupying an intermediate position between the Low and High clusters. The two clustering solutions were visually almost identical, and the few discrepancies occurred among participants located close to cluster boundaries, where classification is inherently more uncertain.
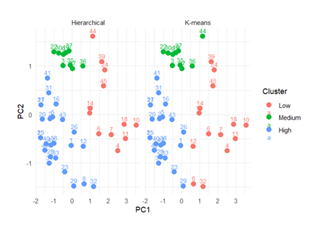
Figure 2: Two-dimensional principal-component projection of the three language measures (vocabulary, information and grammar), shown separately for the hierarchical and k-means solutions. Each point represents one child, labelled by participant number and colored by cluster (Low, Medium, High)
3.2.1 Bootstrap stability of the cluster solution: Given the strong convergence between the two approaches and the greater bootstrap stability of the k-means solution, the k-means classification was treated as the primary basis for the subsequent analyses, with the hierarchical solution retained throughout as a sensitivity (robustness) check. Reporting both classifications allows the diagnostic and cognitive correlates to be evaluated for their dependence on the clustering algorithm.
Because resampling with replacement can inflate apparent stability through duplicated observations, we also assessed stability under 80% subsampling without replacement. The k-means partition remained stable under this stricter scheme, with clusterwise Jaccard coefficients of 0.96, 0.92 and 0.95 for the Low, Medium and High profiles (mean 0.94), all exceeding the 0.75 threshold for stable clusters; the corresponding Ward values were 0.80, 0.73 and 0.78 (mean 0.77). These estimates are lower than the with-replacement values in Table 4, as expected, but continue to support the reproducibility of the k-means partition.
Bootstrap results are summarised in Table 4. Both clustering methods demonstrated good stability, although the k-means solution consistently outperformed hierarchical clustering. The median Adjusted Rand Index was 0.87 for k-means (mean = 0.78) compared with 0.58 (mean = 0.62) for hierarchical clustering. Similarly, the median proportion of participants assigned to their original cluster was 94.4% for k-means and 83.3% for hierarchical clustering. The k-means solution also exceeded conventional stability thresholds substantially more often than the hierarchical solution.
Table 4: Bootstrap stability of the k-means and hierarchical cluster solutions (10,000 resamples).
|
Statistic |
K-means |
Hierarchical |
|
Adjusted Rand Index (ARI) |
||
|
Mean |
0.78 |
0.62 |
|
Median |
0.87 |
0.58 |
|
SD |
0.23 |
0.23 |
|
95% interval |
0.31–1.00 |
0.25–1.00 |
|
Same-cluster rate |
||
|
Mean |
0.88 |
0.81 |
|
Median |
0.94 |
0.83 |
|
Proportion of resamples above threshold |
||
|
ARI > 0.40 |
0.89 |
0.8 |
|
ARI > 0.60 |
0.77 |
0.47 |
|
ARI > 0.80 |
0.55 |
0.26 |
|
Same-cluster rate > 0.70 |
0.83 |
0.74 |
|
Same-cluster rate > 0.80 |
0.78 |
0.57 |
Note. The adjusted Rand index (ARI) and the same-cluster rate compare each bootstrap partition with the original full-sample solution; higher values indicate greater stability. The 95% interval is the 2.5th–97.5th percentile of the bootstrap distribution. The threshold rows give the proportion of the 10,000 resamples in which the index exceeded the stated value. Both analyses were performed with k = 3.
Figures 3 and 4 illustrate the bootstrap distributions of the Adjusted Rand Index and the same-cluster rate. Both methods showed a pronounced peak at the maximum value, indicating that many bootstrap samples reproduced the original clustering solution exactly. This pattern was particularly evident for k-means, for which approximately 16% of bootstrap samples achieved an ARI of 1.00. Overall, these findings confirm that although both clustering approaches produced stable solutions, the k-means classification was reproduced more consistently across bootstrap resamples.
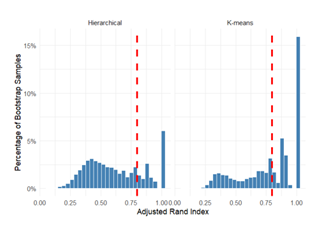
Figure 3: Bootstrap distribution of the adjusted Rand index between each resampled partition and the original solution, for the hierarchical and k-means methods (10,000 resamples). The vertical dashed line marks an adjusted Rand index of 0.80.
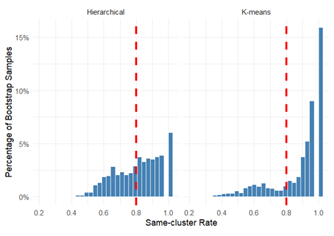
Figure 4: Bootstrap distribution of the same-cluster rate (the proportion of children reassigned to their original profile), for the hierarchical and k-means methods (10,000 resamples). The vertical dashed line marks a same-cluster rate of 0.80.
3.3 Diagnostic and Cognitive Correlates of the Language Profiles
Having derived an exploratory three-cluster solution, we next examined whether profile membership was associated with autism symptom severity or general cognitive ability. Three predictors were evaluated: the ADOS-2 Social Affect score, the ADOS-2 calibrated severity score, and IQ. Because of the modest sample size and the incomplete availability of these measures (IQ was available for 22 children and the ADOS-2 scores for 37), each variable was examined separately rather than simultaneously, to avoid over-parameterizing the models. For each predictor, a multinomial logistic regression was fitted with profile membership as the three-category outcome and the Low profile as the reference category, using the children with complete data on both the profile and the predictor concerned. To assess the robustness of the associations, the analysis was carried out for both the k-means and the hierarchical profile classifications. Results are reported as regression coefficients (with standard errors) and the corresponding odds ratios for the Medium-versus-Low and High-versus-Low contrasts, together with Wald-type p-values. An odds ratio above one indicates that higher values of the predictor were associated with greater odds of belonging to the Medium or High profile rather than to the Low profile.
None of the three variables predicted profile membership in either clustering solution (Table 5). For the ADOS Social Affect and calibrated severity scores, all odds ratios were close to unity (range 0.85–1.04), and neither the Medium-versus-Low nor the High-versus-Low contrast approached statistical significance (all p > .15); Likewise, IQ was not significantly associated with profile membership (odds ratios 0.95–1.01; all p > .40).
Table 5: Univariate multinomial logistic regression of language-profile membership on diagnostic and cognitive variables, with model-fit diagnostics, for the k-means and hierarchical classifications.
|
Classification |
Contrast |
β |
OR |
p |
AIC |
LR χ² (2) (p) |
R² |
|
ADOS Social Affect (n = 37) |
|||||||
|
k-means |
Medium vs Low |
−0.06 |
0.94 |
0.658 |
82.3 |
1.01 (.605) |
0.013 |
|
k-means |
High vs Low |
−0.10 |
0.9 |
0.323 |
|||
|
Hierarchical |
Medium vs Low |
−0.14 |
0.87 |
0.342 |
77.6 |
2.21 (.331) |
0.031 |
|
Hierarchical |
High vs Low |
−0.15 |
0.86 |
0.156 |
|||
|
ADOS severity (CSS) (n = 37) |
|||||||
|
k-means |
Medium vs Low |
0.04 |
1.04 |
0.863 |
83.1 |
0.27 (.873) |
0.004 |
|
k-means |
High vs Low |
−0.06 |
0.95 |
0.732 |
|||
|
Hierarchical |
Medium vs Low |
−0.14 |
0.87 |
0.527 |
78.8 |
1.01 (.605) |
0.014 |
|
Hierarchical |
High vs Low |
−0.17 |
0.85 |
0.328 |
|||
|
IQ (n = 22) |
|||||||
|
k-means |
Medium vs Low |
−0.04 |
0.96 |
0.453 |
47.9 |
1.06 (.590) |
0.026 |
|
k-means |
High vs Low |
0.01 |
1.01 |
0.667 |
|||
|
Hierarchical |
Medium vs Low |
−0.05 |
0.95 |
0.404 |
48.1 |
0.87 (.648) |
0.021 |
|
Hierarchical |
High vs Low |
0 |
1 |
0.985 |
|||
Note. Each predictor was entered in a separate model with language-profile membership as the outcome and the Low profile as the reference category; n is the number of children with complete data (shown per predictor). β = log-odds coefficient; OR = odds ratio (exp β); p = Wald-type p-value. AIC = Akaike information criterion; LR χ²(2) (p) = likelihood-ratio test of the model against the intercept-only model; R² = McFadden pseudo-R². Model-fit columns refer to the whole model and therefore span the two contrasts. No coefficient or model reached statistical significance (all p > .05); AIC and BIC are comparable only among models fitted to the same cases.
Because IQ and ADOS scores were available for subsets of the sample, we first examined whether availability was related to the language data. Children with versus without ADOS scores did not differ on vocabulary, information or grammar (Wilcoxon p = .64, .92 and 1.00) or on profile membership (Fisher's exact p = .44), consistent with data missing completely at random. For IQ, however, profile membership was associated with availability (Fisher's exact p = .013): children with IQ data were over-represented in the Low profile (11 of 14) and under-represented in the Medium profile (2 of 10), with borderline differences on information and grammar scores (p = .052 and .057). The IQ correlate analysis below is therefore based on a non-random subsample and is interpreted accordingly.
Model-level diagnostics supported these findings. Likelihood-ratio tests comparing each model with the intercept-only model were non-significant (χ²(2) = 0.27–2.21; all p ≥ .33), McFadden's pseudo-R² values were negligible (≤ .031), and AIC values indicated no improvement in model fit after including any predictor. These findings were consistent across both clustering methods.
Taken together, the results suggest that the identified language profiles are largely independent of overall autism symptom severity and general cognitive ability. However, because these analyses were based on relatively small subsamples, the absence of statistically significant associations should be interpreted as a lack of evidence for an association rather than evidence that no association exists.
4. Discussion
The present study examined language abilities in verbally fluent Greek-speaking children with ASD using standardized measures of expressive vocabulary, grammar, and informational language. Three distinct language profiles emerged consistently across both k-means and hierarchical clustering algorithms. The identified profiles were highly reproducible under bootstrap resampling, indicating that they represent stable patterns rather than artefacts of a particular clustering method. In addition, neither autism symptom severity nor general cognitive ability reliably predicted profile membership, suggesting that the observed language differences are largely independent of these broader clinical characteristics.
Our findings are consistent with previous research demonstrating substantial heterogeneity in language abilities among autistic individuals. Rather than representing a uniform linguistic phenotype, autism encompasses considerable variability in structural language, with some individuals exhibiting age-appropriate language skills and others presenting impairments resembling those observed in Developmental Language Disorder (DLD). Recent reviews have emphasised that this heterogeneity extends across vocabulary, grammar, narrative abilities, and language processing, while also highlighting considerable methodological differences between studies that have hindered direct comparisons [5, 7].
The Low and High profiles primarily reflected differences in overall language ability. Children in the Low profile demonstrated generalized weaknesses across vocabulary, grammar, and informational language, whereas those in the High profile performed consistently well across all domains. These findings support previous evidence that structural language impairment represents an important source of heterogeneity within autism and cannot be explained solely by pragmatic difficulties. Ellis Weismer (2013) argued that a substantial subgroup of autistic children presents linguistic characteristics comparable to those observed in DLD, whereas others exhibit largely intact structural language despite persistent pragmatic difficulties [4]. Our findings support this distinction while demonstrating that language abilities are better conceptualised as empirically derived profiles rather than broad diagnostic categories.
The most distinctive finding of the present study was the identification of a Medium profile characterised by a dissociation between expressive vocabulary and other aspects of language. Although these children performed similarly to the Low profile on the expressive vocabulary task, they demonstrated grammatical and informational abilities approaching those of the High profile. This pattern suggests that language impairment in autism is not adequately captured by a single continuum of severity. Rather, structural language in autism appears to be better understood as a multidimensional construct, with different language domains following at least partly independent developmental trajectories. The selective weakness in lexical retrieval observed in this subgroup despite relatively preserved grammar and informational language is consistent with domain-based models of language development and highlights the limitations of dichotomous classifications that distinguish only between autistic individuals with and without language impairment [5, 20].
Similar dissociations have previously been reported in studies demonstrating uneven language development in autism, in which lexical retrieval remains vulnerable despite comparatively intact morphosyntactic performance [6]. Several person-centred studies have identified language-related subgroups using different constructs and age ranges [8-12]. The present analysis differs by focusing on patterns across specific structural-language domains rather than on overall verbal level, cognition, social communication, or receptive language.
Stevens et al. [8] found two broad school-age subgroups differentiated by social, language, and nonverbal ability, with preschool cognitive functioning more predictive of later functioning than autism severity. Silleresi et al. [9] identified five profiles combining structural language and nonverbal cognition in verbal 6- to 12-year-olds, including dissociations between language and cognitive status. Reetzke et al. [10] derived three profiles from language and social-communication measures in 498 toddlers and preschoolers, including a profile characterised partly by disagreement between parent-rated and clinician-administered language measures. Vyshedskiy et al. [11] identified command-, modifier-, and syntactic-comprehension phenotypes in a very large caregiver-reported sample; however, its broad age range, self-selected app-based recruitment, and reliance on caregiver report make it methodologically distinct from standardised direct assessment. Latrèche et al. [12] longitudinally recovered language-unimpaired, language-impaired, and minimally verbal profiles in French-speaking preschoolers and showed that profile attribution and later outcomes were associated with nonverbal cognition and, for the language-impaired group, early intensive behavioural intervention. Because the present study did not include cognition, social communication, receptive language, or developmental trajectory among its clustering indicators, its profiles should not be treated as direct replications of these classifications. Accordingly, the Medium profile should be interpreted as an exploratory, sample-specific hypothesis requiring external replication rather than as an established autism language phenotype.
Interestingly, profile membership was not associated with ADOS Social Affect scores, calibrated autism severity, or IQ. Although these findings should be interpreted cautiously given the modest sample size, the absence of significant associations between language-profile membership and autism symptom severity is consistent with accumulating evidence that structural language impairment constitutes a relatively independent dimension of phenotypic heterogeneity in autism rather than simply reflecting greater severity of core autistic features [5, 21]. Children with similar levels of autism symptom severity may nevertheless exhibit markedly different language profiles, underscoring the importance of comprehensive language assessment rather than inferring linguistic ability from diagnostic severity or cognitive level alone. Although pragmatic impairments are closely linked to the social-communication phenotype of autism, structural language abilities appear to vary relatively independently of autism severity, supporting current diagnostic systems that treat language impairment as a specifier rather than a defining feature of ASD [1, 2]. The present findings provide further empirical support for this conceptualisation.
The present findings also complement our previously proposed theoretical model of four language subtypes in autism [13]. Whereas that model was conceptually derived from the existing literature, the current study provides empirical evidence that verbally fluent autistic children can indeed be differentiated into reproducible language profiles using standardized language measures. Although the present clusters should not be interpreted as direct equivalents of the proposed subtypes, they support the broader view that language heterogeneity in autism reflects qualitatively different developmental profiles rather than differences in severity alone.
From a clinical perspective, the present findings emphasize the importance of comprehensive language assessment in verbally fluent autistic children. Reliance on global language scores may obscure clinically meaningful differences between children with similar overall language ability but distinct patterns of strengths and weaknesses. For example, children with generalized structural language impairment are likely to benefit from broad interventions targeting vocabulary, grammar, and discourse, whereas those with selective lexical retrieval difficulties may require interventions focusing specifically on lexical retrieval and word-finding strategies while capitalizing on their relatively preserved morphosyntactic abilities. Profile-based assessment may therefore facilitate more individualized intervention planning, improve educational recommendations, and provide a more sensitive framework for monitoring language development and treatment outcomes over time.
The present study contributes to the relatively limited literature on structural language in autism in morphologically rich languages. Most research on language heterogeneity in ASD has been conducted in English-speaking populations, whereas comparatively few studies have examined children acquiring languages such as Greek, with its extensive nominal and verbal inflection, grammatical gender, case marking, and relatively flexible word order [4, 5, 7, 22, 23]. These linguistic characteristics provide an important context for evaluating whether structural language profiles identified in autism reflect universal developmental patterns or are influenced by language-specific properties.
Our findings broadly converge with evidence from English-speaking populations while extending it in several important respects. Ellis Weismer [4] reported that autistic children vary considerably in structural language, with some demonstrating age-appropriate grammatical development and others exhibiting deficits resembling Developmental Language Disorder. Likewise, Tager-Flusberg [20] proposed that autism comprises multiple language phenotypes rather than a single linguistic profile. The Low and High profiles identified in the present study closely parallel these broad phenotypes, providing further support for the view that structural language heterogeneity is a fundamental characteristic of autism rather than a feature confined to a particular language.
However, our findings also extend previous work by identifying a reproducible subgroup characterized by selective expressive vocabulary weakness despite relatively preserved grammatical and informational language. This dissociation is consistent with the multidimensional framework proposed by Schaeffer et al. [5], who concluded that vocabulary, grammar, narrative ability, and language processing may develop relatively independently in autistic individuals. It also complements the systematic review of Girolamo et al. [7], which highlighted considerable methodological/reporting variability across studies but nevertheless found evidence for substantial structural language heterogeneity.
Evidence from Greek-speaking autistic children is similarly compatible with our findings. Terzi, Marinis, and Francis [6] demonstrated that children with ASD may exhibit relatively preserved morphosyntax despite broader communicative difficulties, suggesting that structural language cannot be inferred solely from pragmatic impairment. The present study extends these observations by showing, through data-driven clustering of standardized language assessments, that this heterogeneity includes a stable subgroup with selective lexical retrieval difficulties rather than generalized language impairment. The emergence of this profile in Greek—a language with substantially richer morphology than English—suggests that multidimensional structural language profiles may represent a cross-linguistically robust characteristic of autism, although the linguistic properties of individual languages may influence the relative expression of specific language domains. Future studies employing harmonized assessment protocols across typologically diverse languages will be essential to determine the universality and developmental stability of these language profiles.
4.1 Strengths and Limitations
The main strength of the study lies in its methodological approach. Rather than relying on arbitrary cut-off scores or predefined diagnostic categories, language profiles were derived empirically using two independent clustering methods and subsequently evaluated through extensive bootstrap resampling. The strong agreement between clustering algorithms and the high bootstrap stability provide confidence that the identified profiles reflect robust patterns within the data.
Several limitations should nevertheless be acknowledged. The sample size was relatively modest, particularly for analyses examining associations with IQ and ADOS measures, reducing statistical power to detect small effects. IQ and diagnostic data (ADOS-2) were also unavailable for all participants. Furthermore, only verbally fluent children with average-range nonverbal intelligence were included, limiting the generalisability of the findings to minimally verbal autistic individuals or those with co-occurring intellectual disability. Finally, language was assessed using standardized measures of expressive vocabulary, grammar, and informational language. Although these measures capture important aspects of structural language, they do not fully characterize children's spontaneous language use. The study did not include narrative, conversational discourse, or other naturalistic language samples, which may provide complementary information regarding discourse organization, cohesion, pragmatic language, and language use in everyday communication. Future studies integrating standardized assessments with spontaneous language and discourse analyses, together with measures of receptive language, phonology, pragmatics, and verbal memory, may identify additional language profiles and further refine our understanding of language heterogeneity in autism.
The standardized measures also yield coarsely banded percentile ranks, producing extensive ties and a ceiling on the information measure (14 of 46 children at the 90th percentile). Such granularity can, in principle, concentrate observations and influence distance-based clustering; although the profiles proved robust to the choice of distance metric and to resampling, the limited discrimination at the ceiling — particularly on the information measure and within the High profile — should be borne in mind when interpreting the profiles, and finer-grained or raw-score measures would be preferable in future work.
Moreover, the two sets of missing data were not equivalent. Availability of ADOS scores was unrelated to the language measures or to profile membership, but availability of IQ was not: children with IQ data were disproportionately drawn from the Low profile and rarely from the Medium profile, indicating that IQ was not missing completely at random. The IQ correlate analysis is therefore based on a biased subsample, in which the Medium profile was represented by only two children, and the absence of an association between IQ and profile membership should be interpreted as inconclusive rather than as evidence of no relationship.
Conclusion
The present study provides further evidence that structural language ability in autism is heterogeneous and cannot be adequately described by a simple distinction between impaired and unimpaired language. Using standardized language assessments and a data-driven clustering approach, we identified three reproducible structural language profiles that represent empirically derived patterns of language performance rather than clinical autism subtypes. In particular, the identification of a subgroup characterized by selective expressive vocabulary difficulties despite relatively preserved grammatical and informational language supports a multidimensional view of structural language development in autism. These findings extend previous work on language heterogeneity by demonstrating that distinct structural language profiles can be identified in Greek-speaking children, suggesting that such patterns may generalize beyond English-speaking populations while also underscoring the importance of examining language within typologically diverse linguistic systems. Clinically, profile-based assessment may facilitate more individualized intervention planning by identifying specific patterns of linguistic strengths and weaknesses rather than relying solely on overall language ability. Replication in larger and more linguistically diverse samples, incorporating broader assessments of structural and functional language, will be essential to establish the cross-linguistic validity, developmental stability, and clinical utility of these language profiles.
Author Contributions
Conceptualization, K.F. and I.V.; methodology, K.F., I.V. and N.P.; formal analysis, N.P.; investigation, I.V.; resources, K.F., I.V. and N.P.; data curation, K.F. I.V. and N.P.; writing—original draft preparation, K.F., I.V. and N.P.; writing—review and editing, K.F., I.V. and N.P.; visualization, K.F. and N.P.; supervision, K.F. and I.V.; project administration, K.F. and I.V.; funding acquisition, N/A All authors have read and agreed to the published version of the manuscript.
Funding
This research received no external funding
Institutional Review Board Statement
The study was conducted in accordance with the Declaration of Helsinki and approved by the Institute of Educational Policy of the Ministry of Education (protocol code 42/12-10-2017).
Informed Consent Statement
Informed consent was obtained from the parents of all subjects involved in the study.
Data Availability Statement
Data is available upon request from the authors.
Acknowledgments
AI was used only for language editing and to create the Graphic Abstract. The authors have reviewed and edited the output and take full responsibility for the content of this publication.
Conflicts of Interest
The authors declare no conflicts of interest.
References
- American Psychiatric Association. Diagnostic and statistical manual of mental disorders (5th ed.). Washington, D.C.: American Psychiatric Association. xliv (2013): 947.
- World Health Organization, International Statistical Classification of Diseases and Related Health Problems (11th ed.) (2019).
- Lord C, et al. The Lancet Commission on the future of care and clinical research in autism. Lancet 399 (2022): 271-334.
- Ellis Weismer S. Developmental language disorders: challenges and implications of cross-group comparisons. Folia Phoniatr Logop 65 (2013): 68-77.
- Schaeffer J. et al. Language in autism: domains, profiles and co-occurring conditions. J Neural Transm (Vienna) 130 (2023): 433-457.
- Terzi A, T Marinis, K Francis. The Interface of Syntax with Pragmatics and Prosody in Children with Autism Spectrum Disorders. J Autism Dev Disord 46 (2016): 2692-2706.
- Girolamo T, et al. Studies assessing domains pertaining to structural language in autism vary in reporting practices and approaches to assessment: A systematic review. Autism 28 (2024): 1602-1621.
- Stevens M C, et al. Subgroups of children with autism by cluster analysis: a longitudinal examination. J Am Acad Child Adolesc Psychiatry 39 (2000): 346-352.
- Silleresi S, et al. Identifying Language and Cognitive Profiles in Children With ASD via a Cluster Analysis Exploration: Implications for the New ICD-11. Autism Res 13 (2020): 1155-1167.
- Reetzke R, et al. Profiles and correlates of language and social communication differences among young autistic children. Front Psychol 13 (2022): 936392.
- Vyshedskiy A, et al. Three mechanisms of language comprehension are revealed through cluster analysis of individuals with language deficits. NPJ Sci Learn 9 (2024): 74.
- Latreche K, et al. Early trajectories and moderators of autistic language profiles: A longitudinal study in preschoolers. Autism 28 (2024): 3043-3062.
- Vogindroukas I, et al. Language and Speech Characteristics in Autism. Neuropsychiatr Dis Treat 18 (2022): 2367-2377.
- Lord C, et al. Autism Diagnostic Observation Schedule (2nd ed.). Western Psychological Services (2012).
- Raven J, J C Raven, J H Court. Manual for Raven's progressive matrices and vocabulary scales. Harcourt Assessment (2003).
- Renfrew C. Word Finding Vocabulary Test (4th ed.). Bicester: Speechmark Publishing (1995).
- Vogindroukas I, A Protopapas, G Sideridis. Dokimasia Ekfrastikou Leksilogiou (Word Finding Vocabulary Test). Athens: Glafki (2009).
- Renfrew C. The renfrew action picture test (4th ed.). London: Speechmark Publishing (1997).
- Vogindroukas I. Ikones Drasis (Action Picture Test). Athens: Glafki (2011).
- Tager-Flusberg H. Defining language phenotypes in autism. Clinical Neuroscience Research 6 (2006): 219-224.
- Loucas T. et al. Autistic symptomatology and language ability in autism spectrum disorder and specific language impairment. J Child Psychol Psychiatry 49 (2008): 1184-1192.
- Holton D, I Philippaki-Warburton, P Mackridge. Greek: An Essential Grammar of the Modern Language. Routledge 2016.
- Ralli A. Compounding in Modern Greek. Studies in Morphology. Springer Dordrecht (2013).