Md. Akram Hossen1, Anuradha Paul Tithi2, Naima Jannat Shabrina Haque3, Kamrun Nahar4, Zarzina Mehzabin Nusaiba5, Sakibul Islam6, Md Borhan Uddin Sohan7, Md. Rajib Al-Amin8*
1Department of Biochemistry & Molecular Biology, University of Rajshahi, Bangladesh
2Department of Pharmacy , Primeasia University, Bangladesh
3Department of Stroke Unit, National Institute of Neuroscience & Hospital, Bangladesh
4Department of Medicine, United Hospital Limited, Bangladesh
5Department of Biochemistry and Biotechnology, University of Science and Technology Chittagong, Bangladesh
6Department of Pharmacy, Independent University Bangladesh
7Department of Occupational Therapy, Centre for the Rehabilitation of the Paralysed- CRP, Bangladesh
8Department of Colorecral Surgery, Shaheed Suhrawardy Medical College and Hospital, Bangladesh
*Corresponding Author: Dr. Md. Rajib Al-Amin, Department of Colorecral Surgery, Shaheed Suhrawardy Medical College and Hospital, Bangladesh
Received: 12 September 2026; Accepted: 21 September 2026; Published: 02 November 2026
Background: Fecal calprotectin (FC) is a non-invasive biomarker of intestinal inflammation. Its relationship with routinely available inflammatory and hematological biomarkers may provide useful information for laboratory assessment of gastrointestinal inflammatory activity. Objective: To determine the distribution of fecal calprotectin levels and assess their associations with inflammatory and hematological biomarkers among patients undergoing laboratory investigation.
Methods: A retrospective hospital-based study was conducted among 250 patients who underwent fecal calprotectin testing from January 2025 to February 2026. Demographic and laboratory data were retrieved from hospital records, including FC, complete blood count parameters, C-reactive protein (CRP), and erythrocyte sedimentation rate (ESR). FC levels were categorized according to commonly used laboratory thresholds. Descriptive statistics, group comparisons, and Spearman correlation analyses were performed. Statistical significance was considered at p<0.05.
Results: Of the 250 patients, 137 (54.8%) were male and 113 (45.2%) were female, with a mean age of 39.6 ± 15.2 years. The median FC concentration was 86.5 µg/g (IQR: 34.0–198.5). Overall, 103 (41.2%) patients had normal FC levels (<50 µg/g), 62 (24.8%) had borderline levels (50–120 µg/g), and 85 (34.0%) had elevated levels (>120 µg/g). Elevated FC was observed in 48 (35.0%) males and 37 (32.7%) females, with no significant difference between males and females (p=0.69). Patients with elevated FC demonstrated higher inflammatory marker levels compared with those with normal FC, including CRP [median: 8.6 vs. 3.2 mg/L, p<0.001] and ESR [median: 28 vs. 16 mm/h, p<0.001]. FC showed a moderate positive correlation with CRP (r=0.42, p<0.001) and ESR (r=0.36, p<0.001). Significant positive correlations were also observed between FC and WBC count (r=0.21, p=0.001), neutrophil count (r=0.25, p<0.001), and platelet count (r=0.19, p=0.003). A weak inverse correlation was observed between FC and hemoglobin (r=−0.18, p=0.004). In addition, patients with elevated FC had higher median WBC counts (8.4 vs. 7.1 ×10?/L, p=0.002), neutrophil counts (5.5 vs. 4.2 ×10?/L, p<0.001), and platelet counts (286 vs. 252 ×10?/L, p=0.006) than those with normal FC. Conversely, median hemoglobin was lower among patients with elevated FC (12.4 vs. 13.2 g/dL, p=0.008). These findings demonstrate a consistent association between higher FC concentrations and systemic inflammatory and hematological changes.
Conclusion: Fecal calprotectin was significantly associated with several inflammatory and hematological biomarkers, particularly CRP, ESR, neutrophil count, WBC count, platelet count, and hemoglobin. FC may therefore serve as a useful complementary laboratory biomarker for identifying inflammatory activity in patients undergoing gastrointestinal evaluation.
Fecal calprotectin; Intestinal inflammation; C-reactive protein; Hematological biomarkers; Gastrointestinal inflammation.
Fecal calprotectin articles; Intestinal inflammation articles; C-reactive protein articles; Hematological biomarkers articles; Gastrointestinal inflammation articles.
1. Introduction
Gastrointestinal disorders associated with intestinal inflammation represent an important clinical and diagnostic challenge because inflammatory activity may vary substantially among patients and may not always be accurately reflected by symptoms alone [1]. Conditions characterized by intestinal mucosal inflammation can present with nonspecific manifestations such as abdominal pain, altered bowel habits, diarrhea, gastrointestinal bleeding, fatigue, and weight loss, making differentiation between inflammatory and non-inflammatory gastrointestinal conditions difficult on the basis of clinical assessment alone. Timely and reliable identification of intestinal inflammatory activity is therefore important for appropriate clinical evaluation, disease monitoring, and selection of patients who may require further gastrointestinal investigation [2].
Fecal calprotectin (FC) has emerged as an important non-invasive laboratory biomarker for the assessment of intestinal inflammation. Calprotectin is a calcium- and zinc-binding protein predominantly derived from neutrophils and other myeloid cells. During active intestinal inflammation, recruitment and activation of neutrophils within the gastrointestinal mucosa result in increased release of calprotectin into the intestinal lumen, where it can be detected in fecal specimens [3]. Because fecal calprotectin reflects neutrophil activity within the gastrointestinal tract, its concentration can provide an indirect indication of intestinal inflammatory activity without requiring an invasive procedure. The stability of calprotectin in stool and its measurable concentration make FC particularly useful as a laboratory-based biomarker in the evaluation of patients with suspected gastrointestinal inflammation [4].
An important clinical advantage of FC is its non-invasive nature. Unlike endoscopic assessment, which provides direct visualization of the intestinal mucosa but requires an invasive procedure, fecal calprotectin testing can be performed using a stool specimen and may therefore serve as a practical laboratory tool for initial assessment [5]. FC measurement may be particularly valuable in distinguishing patients with evidence of intestinal inflammation from those in whom inflammatory activity is less likely. However, FC should not be interpreted as a disease-specific marker because increased concentrations may occur in different gastrointestinal and inflammatory conditions. Consequently, interpretation of FC within the broader clinical and laboratory context remains important [6]. Systemic inflammatory biomarkers, including C-reactive protein (CRP) and erythrocyte sedimentation rate (ESR), are routinely used to assess the presence and intensity of inflammation. CRP is an acute-phase protein whose concentration increases in response to systemic inflammatory stimuli, whereas ESR provides an indirect measure of inflammatory activity influenced by changes in plasma proteins and erythrocyte aggregation. Although these markers are widely available and clinically useful, they primarily reflect systemic inflammatory responses and may not directly represent localized intestinal inflammation [7]. Thus, evaluation of their relationship with FC may provide useful information regarding the extent to which intestinal inflammatory activity is accompanied by measurable systemic inflammatory changes.
Routine hematological parameters may also provide important complementary information in patients with gastrointestinal inflammatory conditions. Activation of the inflammatory response can be accompanied by changes in circulating white blood cell and neutrophil counts, while inflammatory processes may also influence platelet production and circulating platelet concentrations [8]. Conversely, gastrointestinal inflammation and associated chronic or occult blood loss may contribute to reductions in hemoglobin concentration. These hematological changes are routinely assessed through the complete blood count (CBC), making them readily accessible in routine laboratory practice. Investigating the relationship between FC and these commonly available hematological parameters may therefore help clarify whether fecal evidence of intestinal inflammation is accompanied by recognizable systemic hematological patterns [9].
The relationship between a stool-based marker of intestinal inflammation and routinely measured systemic inflammatory and hematological biomarkers is clinically relevant from a laboratory perspective. If increased FC concentrations are consistently associated with higher CRP, ESR, white blood cell counts, neutrophil counts, or platelet counts, and with lower hemoglobin concentrations, these relationships may provide additional contextual information when interpreting FC results. Such associations may be particularly useful in laboratory-based evaluation, where multiple routinely available biomarkers can be considered together rather than interpreting an individual test in isolation [10].
Despite the established role of FC in the assessment of intestinal inflammatory activity, the relationship between FC concentrations and routinely available inflammatory and hematological biomarkers may vary across patient populations and clinical settings. In particular, laboratory-based characterization of FC distribution together with its relationship to CRP, ESR, and complete blood count parameters can provide useful real-world evidence regarding the complementary value of these markers. Evaluating these relationships may also help determine whether readily available systemic laboratory parameters demonstrate consistent patterns across different levels of fecal inflammatory activity.
Therefore, the present retrospective laboratory-based study was undertaken to determine the distribution of fecal calprotectin levels among patients undergoing laboratory investigation and to assess the associations between FC and routinely measured inflammatory and hematological biomarkers, including CRP, ESR, white blood cell count, neutrophil count, platelet count, and hemoglobin. By examining these relationships, the study aimed to provide a broader laboratory perspective on the association between intestinal inflammatory activity and systemic inflammatory and hematological changes.
2. Methods
A retrospective, hospital-based observational study was conducted at a tertiary-care hospital in Dhaka City, Bangladesh, among patients who underwent fecal calprotectin (FC) testing between January 2025 and February 2026. A total of 250 patients with documented FC results were included in the study. Demographic and laboratory information was retrospectively retrieved from hospital medical records and laboratory databases using a structured data collection approach. The collected variables included age, sex, fecal calprotectin concentration, complete blood count (CBC) parameters, C-reactive protein (CRP), and erythrocyte sedimentation rate (ESR). The CBC parameters evaluated were white blood cell (WBC) count, neutrophil count, platelet count, and hemoglobin concentration.
Fecal calprotectin was considered the primary biomarker of intestinal inflammatory activity and was recorded in micrograms per gram (µg/g) of stool according to the laboratory report. For analysis, FC concentrations were categorized into three groups based on commonly used laboratory thresholds: normal (<50 µg/g), borderline (50–120 µg/g), and elevated (>120 µg/g). These categories were used to assess differences in inflammatory and hematological parameters across varying levels of FC. Patients with missing, unavailable, or uninterpretable FC results were excluded from the study, while records with missing values for individual laboratory parameters were excluded only from the relevant analyses. Data were analyzed using descriptive and inferential statistical methods. Continuous variables were expressed as mean ± standard deviation (SD) for normally distributed data or median with interquartile range (IQR) for non-normally distributed data.
Categorical variables were presented as frequencies and percentages. Differences in laboratory parameters between FC categories were assessed using appropriate parametric or non-parametric tests based on data distribution. The relationships
between FC concentration and CRP, ESR, WBC count, neutrophil count, platelet count, and hemoglobin concentration were evaluated using Spearman's rank correlation coefficient (r). All statistical tests were two-sided, and a p-value of <0.05 was considered statistically significant.
3. Results
A total of 250 patients who underwent fecal calprotectin (FC) testing during the study period from January 2025 to February 2026 were included in the analysis. The mean age of the study population was 39.6 ± 15.2 years. Among the participants, 137 (54.8%) were male and 113 (45.2%) were female. The median FC concentration was 86.5 µg/g, with an interquartile range of 34.0–198.5 µg/g.
According to the predefined FC categories, 103 (41.2%) patients had normal FC concentrations (<50 µg/g), 62 (24.8%) had borderline FC concentrations (50–120 µg/g), and 85 (34.0%) had elevated FC concentrations (>120 µg/g). Therefore, 147 (58.8%) patients had FC concentrations of ≥50 µg/g. Among male participants, 48 (35.0%) had elevated FC concentrations, compared with 37 (32.7%) among female participants. The difference in the proportion of patients with elevated FC between males and females was not statistically significant (p=0.69).
Table 1: Demographic characteristics and fecal calprotectin distribution of the study population
|
Variable |
Overall (N=250) |
|
Age, years |
|
|
Mean ± SD |
39.6 ± 15.2 |
|
Sex, n (%) |
|
|
Male |
137 (54.8) |
|
Female |
113 (45.2) |
|
Fecal calprotectin, µg/g |
|
|
Median |
86.5 |
|
IQR |
34.0–198.5 |
|
Fecal calprotectin category, n (%) |
|
|
<50 µg/g |
103 (41.2) |
|
50–120 µg/g |
62 (24.8) |
|
>120 µg/g |
85 (34.0) |
|
≥50 µg/g |
147 (58.8) |
Abbreviations: FC, fecal calprotectin; IQR, interquartile range; SD, standard deviation.
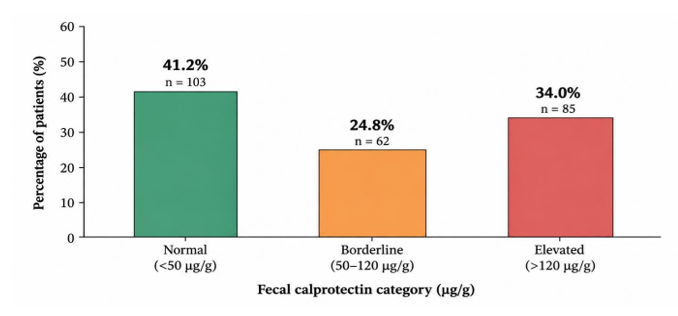
Figure 1: Distribution of Fecal Calprotectin Concentrations Among the Study Population
The figure shows the distribution of patients according to fecal calprotectin (FC) concentration. Among 250 patients, 41.2% had normal FC levels (<50 µg/g), 24.8% had borderline levels (50–120 µg/g), and 34.0% had elevated levels (>120 µg/g).
Table 2: Distribution of elevated fecal calprotectin according to sex
|
Sex |
Total, n |
FC >120 µg/g, n (%) |
p-value |
|
Male |
137 |
48 (35.0) |
|
|
Female |
113 |
37 (32.7) |
0.69 |
|
Total |
250 |
85 (34.0) |
The comparison of inflammatory biomarkers demonstrated significantly higher CRP and ESR concentrations among patients with elevated FC compared with those with normal FC. The median CRP concentration was 8.6 mg/L in patients with elevated FC compared with 3.2 mg/L among patients with normal FC (p<0.001). Similarly, the median ESR was 28 mm/h in the elevated-FC group compared with 16 mm/h in the normal-FC group (p<0.001).
Table 3: Inflammatory biomarkers according to fecal calprotectin status
|
Laboratory parameter |
Normal FC (<50 µg/g) |
Elevated FC (>120 µg/g) |
p-value |
|
CRP, mg/L, median |
3.2 |
8.6 |
<0.001 |
|
ESR, mm/h, median |
16 |
28 |
<0.001 |
Abbreviations: CRP, C-reactive protein; ESR, erythrocyte sedimentation rate; FC, fecal calprotectin.
The elevated-FC group also demonstrated significant differences in several hematological parameters. The median WBC count was higher among patients with elevated FC than among those with normal FC (8.4 vs. 7.1 ×10⁹/L, p=0.002). Median neutrophil count was similarly higher in the elevated-FC group (5.5 vs. 4.2 ×10⁹/L, p<0.001). Platelet count was also significantly higher among patients with elevated FC (286 vs. 252 ×10⁹/L, p=0.006). In contrast, median hemoglobin concentration was lower in patients with elevated FC than in those with normal FC (12.4 vs. 13.2 g/dL, p=0.008).
Table 4: Hematological parameters according to fecal calprotectin status
|
Laboratory parameter |
Normal FC (<50 |
Elevated FC (>120 |
p- |
|
µg/g) |
µg/g) |
value |
|
|
WBC, ×10⁹/L, median |
7.1 |
8.4 |
0.002 |
|
Neutrophil count, ×10⁹/L, |
4.2 |
5.5 |
<0.001 |
|
median |
|||
|
Platelet count, ×10⁹/L, |
252 |
286 |
0.006 |
|
median |
|||
|
Hemoglobin, g/dL, median |
13.2 |
12.4 |
0.008 |
Abbreviations: FC, fecal calprotectin; WBC, white blood cell.
Spearman correlation analysis demonstrated statistically significant associations between FC concentration and each of the evaluated inflammatory and hematological biomarkers. FC showed a correlation coefficient of 0.42 with CRP (p<0.001) and 0.36 with ESR (p<0.001). Among the hematological parameters, the correlation coefficient was 0.25 for neutrophil count (p<0.001), 0.21 for WBC count (p=0.001), and 0.19 for platelet count (p=0.003). Hemoglobin showed an inverse correlation with FC, with a correlation coefficient of −0.18 (p=0.004).
Table 5: Correlation between fecal calprotectin and inflammatory biomarkers
|
Laboratory parameter |
Spearman's correlation coefficient (r) |
p-value |
|
CRP |
0.42 |
<0.001 |
|
ESR |
0.36 |
<0.001 |
Abbreviations: CRP, C-reactive protein; ESR, erythrocyte sedimentation rate.
Table 6: Correlation between fecal calprotectin and hematological biomarkers
|
Laboratory parameter |
Spearman's correlation coefficient (r) |
p-value |
|
WBC count |
0.21 |
0.001 |
|
Neutrophil count |
0.25 |
<0.001 |
|
Platelet count |
0.19 |
0.003 |
|
Hemoglobin |
−0.18 |
0.004 |
Abbreviations: FC, fecal calprotectin; WBC, white blood cell.
Overall, patients with elevated FC demonstrated a consistent pattern of increased inflammatory and hematological abnormalities compared with those with normal FC. Elevated FC was accompanied by higher CRP, ESR, WBC, neutrophil, and platelet values, together with lower hemoglobin concentrations. The correlation analysis further demonstrated that FC concentration was significantly associated with both systemic inflammatory markers and selected hematological parameters, with the largest correlation coefficients observed for CRP and ESR. These findings indicate an association between fecal inflammatory activity and systemic inflammatory and hematological changes among patients undergoing gastrointestinal laboratory evaluation. The figure shows the distribution of patients according to fecal calprotectin (FC) concentration. Among 250 patients, 41.2% had normal FC levels (<50 µg/g), 24.8% had borderline levels (50–120 µg/g), and 34.0% had elevated levels (>120 µg/g).
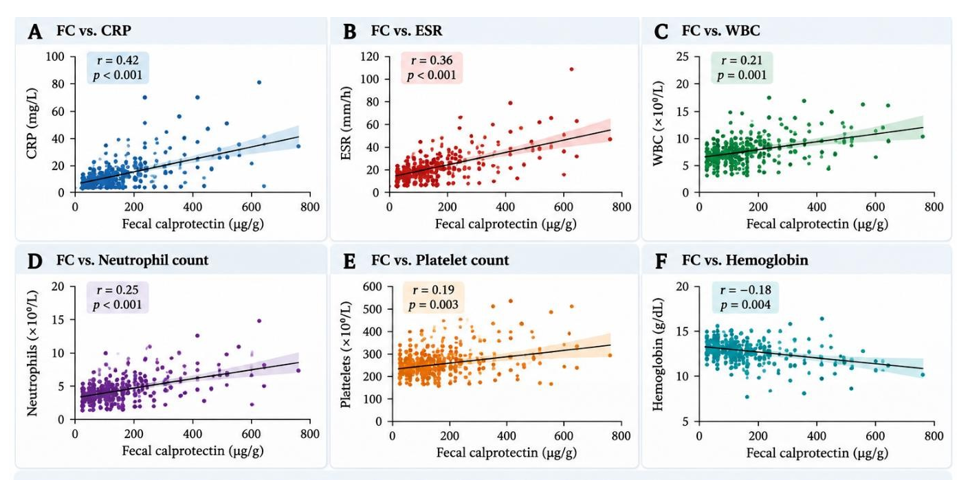
Figure 2: Correlation of Fecal Calprotectin with Inflammatory and Hematological Biomarkers
The figure presents Spearman correlation analyses between FC and CRP, ESR, WBC count, neutrophil count, platelet count, and hemoglobin. FC showed the strongest correlation with CRP (r=0.42, p<0.001) and ESR (r=0.36, p<0.001), with significant associations also observed for the hematological parameters.
4. Discussion
In the present study, the median FC concentration was 86.5 µg/g, while 34.0% of patients had FC concentrations above 120 µg/g and 24.8% had borderline concentrations between 50 and 120 µg/g. Thus, more than half of the study population had FC concentrations at or above 50 µg/g. This distribution is clinically relevant because FC reflects intestinal inflammatory activity and is widely used as a non-invasive biomarker in the evaluation and monitoring of gastrointestinal inflammation. Previous evidence has demonstrated that FC can assist in distinguishing inflammatory bowel disease from functional gastrointestinal disorders and can reduce reliance on invasive investigations in appropriately selected patients. A recent systematic review and meta-analysis also confirmed the diagnostic value of FC in distinguishing inflammatory bowel disease from irritable bowel syndrome. However, elevated FC is not specific to a single gastrointestinal disease, and the relatively heterogeneous population of the present laboratory-based study should therefore be considered when interpreting the distribution of FC concentrations [11].
A notable finding was the significantly higher CRP concentration among patients with elevated FC compared with those with normal FC (8.6 vs. 3.2 mg/L, p<0.001). This was further supported by the moderate correlation between FC and CRP (r=0.42, p<0.001), which was the strongest correlation observed in the present study. The finding suggests that greater intestinal inflammatory activity, as reflected by increased FC, was accompanied by a measurable systemic acute-phase response. This observation is consistent with previous studies demonstrating a relationship between FC and CRP. For example, a study of patients with inflammatory bowel disease reported a significant correlation between FC and CRP (r=0.40, p<0.001), while another study evaluating commonly used fecal and blood biomarkers reported a stronger correlation between FC and CRP (r=0.56, p<0.001) [12]. The somewhat lower correlation observed in the present study may reflect the broader clinical population included in this retrospective laboratory cohort rather than a population restricted to confirmed inflammatory bowel disease. Importantly, the present findings should be interpreted as an association between intestinal and systemic inflammatory activity rather than evidence of a causal relationship [13].
ESR showed a similar pattern. Patients with elevated FC had a substantially higher median ESR than those with normal FC (28 vs. 16 mm/h, p<0.001), and FC was significantly correlated with ESR (r=0.36, p<0.001). The relationship between FC and ESR was slightly weaker than that observed for CRP, which may be expected because ESR is an indirect inflammatory marker influenced by several physiological and hematological factors. Nevertheless, the significant association observed in this study indicates that increased fecal inflammatory activity was accompanied by a broader systemic inflammatory response. Previous investigations have also demonstrated associations between FC and ESR, although the strength of this relationship has varied between populations. In patients with Crohn's disease, FC has demonstrated utility for assessing disease activity and may provide information that complements conventional systemic inflammatory markers [14].
The hematological findings provide additional support for the relationship between FC and systemic inflammatory activity. Patients with elevated FC had higher median WBC counts (8.4 vs. 7.1 ×10⁹/L, p=0.002) and neutrophil counts (5.5 vs. 4.2 ×10⁹/L, p<0.001) compared with those with normal FC. Correspondingly, FC was significantly correlated with WBC count (r=0.21, p=0.001) and neutrophil count (r=0.25, p<0.001). These findings are biologically plausible because calprotectin is predominantly derived from neutrophils, and recruitment of neutrophils to inflamed intestinal mucosa represents an important component of the inflammatory response [15]. Increased circulating leukocyte and neutrophil counts may therefore accompany more pronounced inflammatory activity. Similar elevations in neutrophil counts have been reported in patients with inflammatory bowel disease together with increased FC, CRP, and ESR. The relatively modest correlation coefficients in the present study also indicate that circulating leukocyte parameters should not be considered substitutes for FC, but rather complementary indicators of the overall inflammatory state. Platelet count demonstrated another significant association with FC. The median platelet count was higher among patients with elevated FC than among those with normal FC (286 vs. 252 ×10⁹/L, p=0.006), and FC showed a significant correlation with platelet count (r=0.19, p=0.003). Reactive changes in platelet number are recognized in inflammatory conditions and may accompany increased systemic inflammatory activity. Previous work examining combined fecal and blood biomarkers in inflammatory bowel disease has similarly demonstrated a significant correlation between FC and platelet count, with platelet count showing a relatively strong relationship with intestinal inflammatory activity in that specific disease population. The weaker correlation observed in the present study may again reflect the broader laboratory population rather than a cohort restricted to confirmed inflammatory bowel disease.
An important additional finding was the inverse relationship between FC and hemoglobin. Patients with elevated FC had lower median hemoglobin concentrations than those with normal FC (12.4 vs. 13.2 g/dL, p=0.008), and FC demonstrated a statistically significant inverse correlation with hemoglobin (r=−0.18, p=0.004). Although the magnitude of this association was modest, the finding may have clinical relevance because gastrointestinal inflammatory conditions can coexist with anemia through several mechanisms, including chronic gastrointestinal blood loss, impaired iron availability, nutritional factors, and inflammation-associated disturbances in iron metabolism. Previous studies of inflammatory bowel disease have similarly reported lower hemoglobin concentrations in patients with active intestinal inflammation and significant inverse relationships between FC and hemoglobin. Nevertheless, because the present study did not include iron studies, ferritin, transferrin saturation, gastrointestinal blood-loss measurements, or disease-specific diagnoses, the observed inverse association should not be interpreted as evidence that FC directly causes anemia [16].
Taken together, the correlation analysis provides an important overall interpretation of the findings. FC demonstrated significant associations with both inflammatory and hematological biomarkers, with the largest correlation coefficients observed for CRP (r=0.42) and ESR (r=0.36), followed by neutrophils (r=0.25), WBC count (r=0.21), platelets (r=0.19), and hemoglobin (r=−0.18). The pattern suggests that higher fecal inflammatory activity tends to occur alongside systemic inflammatory activation and selected hematological changes. However, the moderate or relatively modest magnitude of these correlations also indicates that FC captures information that is not completely represented by routine blood-based biomarkers. This distinction is important because systemic markers such as CRP and ESR reflect overall inflammatory responses, whereas FC is more closely related to inflammatory activity within the gastrointestinal tract. Recent clinical guidance similarly supports the complementary use of FC and CRP in appropriate gastrointestinal inflammatory conditions rather than relying on either biomarker in isolation [17].
The findings of this study have practical implications for laboratory-based gastrointestinal evaluation. Because FC testing is non-invasive and can provide information related to intestinal inflammatory activity, its interpretation alongside CRP, ESR, and CBC parameters may provide a broader picture of the patient's inflammatory status. In particular, the combination of elevated FC with increased CRP, ESR, WBC, neutrophil, and platelet counts and reduced hemoglobin may identify patients with a more pronounced inflammatory laboratory profile who may warrant further clinical assessment. However, these biomarkers should be interpreted within the clinical context, as FC can be elevated in several gastrointestinal conditions and systemic inflammatory markers are not specific to intestinal disease. Evidence from previous studies also suggests that FC can provide information complementary to blood biomarkers when evaluating inflammatory bowel disease activity.
Conclusion
In this retrospective laboratory-based study, fecal calprotectin was significantly associated with both inflammatory and hematological biomarkers. Patients with elevated fecal calprotectin had higher levels of CRP, ESR, WBC count, neutrophils, and platelets, along with lower hemoglobin levels. Significant correlations were also observed between fecal calprotectin and these laboratory parameters, with the strongest associations identified for CRP and ESR. These findings suggest that fecal calprotectin may provide complementary information on intestinal inflammatory activity when interpreted alongside routine systemic inflammatory and hematological markers. However, fecal calprotectin is not disease-specific, and its clinical interpretation should consider the overall clinical context. Prospective, multicenter studies incorporating clinical diagnosis, endoscopic findings, and disease-specific measures are warranted to further establish its diagnostic and monitoring value.
Limitation
This study has several limitations. Its retrospective design limited the availability and completeness of clinical information and prevented assessment of temporal relationships between fecal calprotectin and inflammatory biomarkers. As the study was conducted at a single tertiary-care hospital, the findings may not be fully generalizable to the wider population. The study population was not restricted to patients with confirmed inflammatory bowel disease, and clinical diagnoses, endoscopic findings, disease activity scores, and treatment status were not consistently available. In addition, other potentially relevant parameters, including serum albumin, iron indices, ferritin, and detailed information on gastrointestinal symptoms or bleeding, were not evaluated. Therefore, the observed associations should not be interpreted as evidence of causality. Future prospective, multicenter studies incorporating clinical, endoscopic, and comprehensive laboratory data are needed to validate and extend these findings.
Author Contributions
Conceptualization: Md. Akram Hossen, Anuradha Paul Tithi, Md. Rajib Al-Amin.
Methodology: Md. Akram Hossen, Naima Jannat Shabrina Haque, Kamrun Nahar, Md. Rajib Al-Amin.
Data Collection: Anuradha Paul Tithi, Naima Jannat Shabrina Haque, Kamrun Nahar, Zarzina Mehzabin Nusaiba, Sakibul Islam, Md Borhan Uddin Sohan.
Data Curation: Naima Jannat Shabrina Haque, Zarzina Mehzabin Nusaiba, Sakibul Islam, Md Borhan Uddin Sohan.
Formal Analysis: Md. Akram Hossen, Kamrun Nahar, Md. Borhan Uddin Sohan, Md. Rajib Al-Amin.
Writing – Original Draft: Md. Akram Hossen, Anuradha Paul Tithi, Naima Jannat Shabrina Haque, Zarzina Mehzabin Nusaiba, Sakibul Islam.
Writing – Review & Editing: Md. Akram Hossen, Kamrun Nahar, Md Borhan Uddin Sohan, Md. Rajib Al-Amin.
Final Approval: All authors read and approved the final manuscript.
Conflict of Interest: No
References
- von Roon AC, Karamountzos L, Purkayastha S, et al. Diagnostic Precision of Fecal Calprotectin for Inflammatory Bowel Disease and Colorectal Malignancy. Am J Gastroenterol 102 (2007): 803-813.
- Diamanti A, Panetta F, Basso MS, et al. Diagnostic Work-Up of Inflammatory Bowel Disease in Children: The Role of Calprotectin Assay. Inffamm Bowel Dis 16 (2010): 1926-1930.
- Konikoff MR, Denson LA. Role of Fecal Calprotectin as A Biomarker of Intestinal Inflammation in Inflammatory Bowel Disease. Inffamm Bowel Dis 12 (2006): 524-534.
- Costa F, Mumolo MG, Ceccarelli L, et al. Calprotectin is a Stronger Predictive Marker of Relapse in Ulcerative Colitis than in Crohn's Disease. Gut 54 (2005): 364-368.
- Schoepfer AM, Beglinger C, Straumann A, et al. Fecal Calprotectin Correlates More Closely with The Simple Endoscopic Score for Crohn's Disease Than Crp, Blood Leukocytes, and the CDAI. Am J Gastroenterol 105 (2010): 162-169.
- D'Haens G, Ferrante M, Vermeire S, et al. Fecal Calprotectin Is a Surrogate Marker for Endoscopic Lesions in Inflammatory Bowel Disease. Inffamm Bowel Dis 18 (2012): 2218-2224.
- Theede K, Holck S, Ibsen P, et al. Level of Fecal Calprotectin Correlates with Endoscopic Severity and Histological Inflammation in Ulcerative Colitis. Inffamm Bowel Dis 21 (2015): 104-112.
- Zittan E, Kelly OB, Kirsch R, et al. Low Fecal Calprotectin Correlates with Histological Remission and Mucosal Healing in Ulcerative Colitis and Colonic Crohn's Disease. Inffamm Bowel Dis 22 (2016): 1043-1048.
- Yang Z, Clark N, Park KT. Efficacy and Cost-Effectiveness of Measuring Fecal Calprotectin in Diagnosis and Monitoring of Inflammatory Bowel Disease. Gastroenterol Hepatol (N Y) 10 (2014): 741-749.
- Caviglia GP, Pantaleoni S, Touscoz GA, et al. Fecal Calprotectin Is an Effective Diagnostic Tool That Differentiates Inflammatory from Functional Intestinal Disorders. Scand J Gastroenterol 49 (2014): 1419-1424.
- Pruijt MJ, van der Woude CJ, et al. Fecal Hemoglobin and Calprotectin Are Equally Effective in Identifying Patients with Inflammatory Bowel Disease with Active Endoscopic Inflammation. Inffamm Bowel Dis (2014).
- Kallel L, Ayadi I, Matri S, et al. Fecal Calprotectin Is a Predictive Marker of Relapse in Crohn's Disease Involving the Colon. Dig Dis Sci 55 (2010): 1307-1312.
- Langhorst J, Elsenbruch S, Mueller T, et al. Comparison of Four Different Stool Tests for The Diagnosis of Inflammatory Bowel Disease. Inffamm Bowel Dis 14 (2008): 620-625.
- Schoepfer AM, Beglinger C, Straumann A, et al. Fecal Calprotectin More Accurately Reflects Endoscopic Activity of Ulcerative Colitis Than the Lichtiger Index, C-Reactive Protein, Platelets, Hemoglobin, And Blood Leukocytes. Inffamm Bowel Dis 19 (2013): 332-341.
- Plevy S, Silverberg MS, Lockton S, et al. Combined Use of Common Fecal and Blood Markers for Detection of Endoscopically Active Inflammatory Bowel Disease. Inffamm Bowel Dis 26 (2020): 859-866.
- Choudhuri G, et al. Fecal Calprotectin and Its Correlation with Inflammatory Markers and Endoscopy in Patients from India with Inflammatory Bowel Disease. Indian J Gastroenterol 34 (2015): 346-351.
- Wawryk-Gawda E, et al. The Combination of Fecal Calprotectin with Esr, Crp and Albumin Discriminates More Accurately Children with Crohn's Disease. J Pediatr Gastroenterol Nutr (2018).