Richard Mbusa Kambale1, 2, 3, 4,*, Gaylord Amani Ngaboyeka2, 3, Joe Bwija Kasengi2, 3, Sarah Niyitegeka2, Boss Rutakaza Cinkenye2, Armand Baruti2, Kizito Chentwali Mutuga2, Dimitri Van der Linden1, 5
1Institute of Experimental and Clinical Research, Université Catholique de Louvain, Brussels, Belgium
2Université Catholique de Bukavu, Bukavu, Democratic Republic of Congo
3General Pediatrics, Department of Pediatric, Hôpital Provincial Général de Référence de Bukavu, Bukavu, Democratic Republic of Congo
4Institut Supérieur des Techniques Médicales, Bukavu, Democratic Republic of Congo
5Pediatric Infectious Diseases, General Pediatrics, Department of Pediatric, Cliniques Universitaires Saint-Luc, Brussels, Belgium
*Corresponding Author: Richard Mbusa Kambale, General Pediatrics, Department of Pediatric, Hôpital Provincial Général de Référence de Bukavu, Bukavu, Democratic Republic of Congo
Received: 14 June 2022; Accepted: 27 June 2022; Published: 16 August 2022
Background: In DRC, childhood undernutrition remains a serious public health concern. Internationally recommended infant and young child feeding (IYCF) practices may improve child nutritional status. This study aimed to describe IYCF practices, factors associated with inappropriate complementary feeding, and infant’s nutritional status.
Methods: A community-based cross-sectional study including 1,009 mother-infant pair was conducted in August 2019 in 32 health areas (16 in rural health zone and 16 in urban one) of South Kivu, Democratic Republic of Congo (DRC), among mothers who had infants under 24 months of age. Infant’s nutritional status was assessed using WHO Anthro plus software. To describe IYCF practices, we used the indicators recommended by the WHO. To study the factors associated with inappropriate complementary feeding practices, we performed univariable and multiple logistic regression analyzes. The data was analyzed in SPSS version 25.
Results: The prevalence of early initiation of breastfeeding and exclusive breastfeeding up to 6 months of age was 73.7% and 42.2% respectively. Of the 746 infants aged 6–23.9 months, 246 (32.3%) received appropriate complementary feeding. Of the 997 infants who had valid anthropometric parameters, 416 (41.7%) were well-nourished, 374 (37.5%) were undernourished and 207 (20.8%) were overweight. Multivariable logistic regression analysis revealed that residence in rural area [Adjusted Odds Ratio (AOR): 2.38 (95% Confidence Interval (CI): 1.49, 3.78)], non-attendance at postnatal care (AOR 1.63; 95% CI 1.12, 2.96), low household socioeconomic (AOR 1.72; 95% CI 1.14, 2.59) and low maternal education (AOR 1.83; 95% CI 1.20, 2.77) were factors associated with inappropriate complementary feeding. Mothers with inappropriate complementary feeding practices were 6.88 times more likely to have undernourished infants than their counterparts
Infant and Young Child Feeding Practices, Undernutrition, Overnutrition, Double Burden of Malnutrition, Infants, South-Kivu
Abbreviations:
AOR: adjusted odd-ratio; CI: Confidence interval; COR: Crude odd-ratio; IYCF: Infant and young child feeding; DRC: Democratic Republic of Congo; ENA: Emergency Nutrition Assessment; HA: Health area; IHZ: Ibanda Health Zone; IYCF: Infant and young child feeding; KHZ: Kabare Health Zone; LAZ: Length-for-age z-score; MICS: Multiple Indicator Cluster Survey; MUAC: Mid-upper arm circumference; SD: Standard deviation; UNICEF: United Nations International Children's Emergency Fund; WAZ: Weight-for-age z-score; WHO: World Health Organization; WHZ: Weight-for-height z-scores; WLZ: Weight-for-length z-scores
1. Introduction
Child undernutrition remains an enormous public health challenge worldwide: 149 million and 45 million children under-5 are stunted and wasted, respectively [1]. Furthermore, 5.4 million children die before their fifth birthday each year. Almost half of these childhood deaths occur in children with malnutrition, predominantly in sub-Saharan Africa and South Asia [2]. The first 1000 days (period beginning at conception through the age of 2 years) of a child’s life are particularly important, as optimal nutrition during this period lowers morbidity and mortality, reduces the risk of chronic disease, and fosters better development overall [3]. The damage to physical growth, brain development, and human capital formation that occurs during this period is extensive and largely irreversible [4]. Therefore, interventions should focus on this window of opportunity, and improving maternal and infant nutrition during the 1000-day period should be a high global priority [4].
WHO and UNICEF jointly developed the Global Strategy for Infant and Young Child Feeding (IYCF) [5], including: (i) early initiation of breastfeeding within 1 hour of birth; (ii) exclusive breastfeeding for the first 6 months of life, and (iii) introduction of nutritionally-adequate and safe complementary (solid) foods at 6 months together with continued breastfeeding up to 2 years of age or beyond. Improving IYCF practices based on this recommendation, whether the child is healthy or sick, is one of the strategies to prevent undernutrition and its consequences [6]. To monitor and guide IYCF practices, WHO developed 8 core and 7 optional IYCF indicators (Box 1) [7]. In several studies using these indicators, recommended IYCF practices were found to be protective against undernutrition [8-10].
Little is known about IYCF practices in South Kivu, Eastern Democratic Republic of Congo (DRC). The Demographic and Health Surveys provided an overall description of the practices observed, but these national data hide regional, provincial or cultural disparities. The Eastern areas of DRC were important food producers. Since the three past decades, this food production has been impacted by looting of crops, general insecurity, and poor infrastructure. The impact of ongoing insecurity on agricultural and pastoral practices has resulted in widespread food insecurity [11, 12]. The number of food-insecure people almost doubled from 7.7 million in 2017 to 13.1 million in 2018, making access to food a daily struggle for a significant part of the Congolese population [11]. The aim of this study is to assess (i) IYCF practices and associated factors, (ii) infant’s nutritional status, and (iii) relationship between in appropriate complementary feeding and infant’s nutritional status.
2. Methods
2.1 Study design and setting
This community-based cross-sectional study was conducted in August 2019 in South Kivu, Eastern DRC, in 32 health areas (HA), including 16 HA in Ibanda Health Zone (IHZ), an urban area, and 16 HA in Kabare Health Zone (KHZ), a rural one. The Health Zone is a geographical area contained within the limits of an administrative territory, comprising a population of at least 100,000 inhabitants. A Health Area is a geographical area consisting of a group of villages (in rural areas) or streets (in urban areas) with a population size of 10,000 inhabitants [11]. IHZ and KHZ were selected by simple random sampling from the 3 Health Zones of Bukavu urban city (Kadutu, Bagira, Ibanda) and 5 surrounding rural areas of Bukavu (Nyantende, Walungu, Kabare, Katana, Miti-Murhesa), respectively. Each of these 2 selected Health Zones encompasses 16 HA.
The IHZ is located in the municipality of Ibanda, city of Bukavu, in the South Kivu province of DRC. It had, in 2018, a recorded population of 452,608 with a population density of 32 per km². Infants < 24 months of age were estimated at 9,053. The main activities are small-scale trading and administration. The staple food is tubers (cassava, taro, sweet and white potatoes), cereals (maize, rice and sorghum), and bananas, generally served with vegetables, fish, beans and meat, which helps to balance the family dish. On average, two to three meals are consumed per day [13]. KHZ is located in the Kabare administrative zone of South Kivu province in the DRC. It is situated 17km from the city of Bukavu. At the last census in 2018, it had a recorded population of 213,882 with a very high population density of 856 per km². Infants under 24 months of age were estimated at 17,111. The population of this area is devoted to agriculture, livestock and small-scale trade. Bananas, cassava, taro, sweet and white potatoes, corn and sugar cane are the main crops grown there [14].
2.2 Eligibility criteria, and methods of selection of participants
The study included infants with the following characteristics: (i) infants under 24 months of age; (ii) residence in the study area; (iii) infants without chronic debilitating illnesses such as cerebral palsy, congenital heart disease, Down syndrome, cleft lip/palate; and (iv) parental consent. In each HA, a complete list of all households was compiled and all the households were serially numbered. To get the sampling interval, the total number of households in a HA was divided by the required sample size. The first household was then randomly selected by picking any number within the sample interval. Subsequent selections were made by adding the sampling interval to the selected number in order to locate the next household to visit. If the selected household did not have a target respondent, then next household was selected using the systematic sampling procedure. This process continued until the required sample size was obtained. In each household, only one eligible participant was surveyed using simple random sampling.
Data were collected by using face-to-face interview during house-to-house visit from mothers who had children under 24 months using structured questionnaire. The questionnaire contained the information on sociodemographic characteristics of participants, infant feeding practices and anthropometry. Household Food Insecurity Access Scale was constructed according to FANTA indicator guide [15]. Ten health extension workers and one public health professional were recruited as data collector and supervisor respectively. For data quality control, the questionnaire was first developed in French and translated to local language (Swahili and Mashi language) and then back-translated to French by an independent translator for consistency. Training was given to health extension workers and supervisor for 2 days. The questionnaire was pre-tested in 25 (5%) of mothers in IHZ and 25 (5%) of mothers in KHZ, which was not included in actual study, to assess the content and approach of the questionnaire. To assure the quality of the data, the supervisor and investigator closely reviewed the data collection technique on daily basis, reviewed the filled questionnaire for completeness and returned any incomplete questionnaire to the data collectors for correction. There was also debriefing every day.
2.3 Assessment of IYCF practices
WHO has defined 15 indicators (8 core and 7 optional) to assess IYCF practices (Table 1). In this study, we assess IYCF practices using all 8 core and 3 out of the 7 optional feeding practices (children ever breastfed, continued breastfeeding at 2 years, and bottle feeding). Optimal feeding practice was assessed based on compliance to WHO recommended practices for each indicator. All indicators were assessed based on a 24-h recall method. In accordance with the WHO rating on IYCF practices, the early initiation of breastfeeding prevalence of 0–29% was considered as poor, 30–49% as fair, 50–89% as good and 90–100% as very good. Exclusive breastfeeding prevalence of 0–11% was considered as poor, 12–49% as fair, 50–89% as good and 90–100% as very good. Timely initiation of complementary feeding prevalence of 0–59% was considered as poor, 60–79% as fair, 80–94% as good and 95–100% as very good [16]. Four core IYCF indicators were used to define whether complementary feeding practice was appropriate or inappropriate: timely initiation of complementary feeding, minimum dietary diversity, minimum meal frequency and minimum acceptable diet. We defined as appropriate if the mother responded correctly to all four indicators, and inappropriate if at least one indicator was not correctly fulfilled.
2.4 Nutritional status assessment
The anthropometric indicators, comprising weight-for-age (WAZ), length-for-age (LAZ), weight-for-length (WLZ), mid-upper arm circumference (MUAC) and the presence or not of bilateral pitting edema were determined according to standard procedures described by WHO [17]. Weight was measured using an electronic baby scale (SECA® type 435) with a precision of 10g. Weight was recorded twice and the mean value was used in the analyses. If the difference between the two measures exceeded 0.2 kg, the child was weighed again. The scale was checked for accuracy with standard weights after about every 200 measures. Recumbent length was measured to the nearest 0.1 cm with subjects in a lying position. The crown-heel length was taken using an infant meter (a flat wooden surface with head and foot boards). The child was placed on its back between the slanting sides. The head was placed so that it is against the top end. The knees were gently pushed down by a helper. The foot-piece was then moved toward the child until it presses softly against the soles of the child's feet and the feet are at right angles to the legs. The MUAC (assessed in children 6-23 months of age) was measured in centimeters, to the nearest 0.1cm, using standard MUAC measuring tape for children. The presence of edema was assessed by pressing firmly with the thumb for at least 2 seconds on each extremity (dorsum of the foot, behind the medial malleolus, lower calf above the medial malleolus).
We determined the child's age based on the date of birth (obtained either from birth certificate, child health record booklet or baptismal card) and the date of the survey. Underweight was defined by WAZ < –2 according to the 2006 WHO growth standards in children aged 0–59 months; stunting by LAZ < –2; wasting by WLZ < –2 or MUAC < 125 mm, and overweight by WLZ > +2. Undernutrition was defined as wasting and/or stunting and/or underweight [18].
2.5 Sample size
The sample size was calculated using Emergency Nutrition Assessment (ENA) 2011 software. The variable used to calculate the sample size was the South Kivu exclusive breastfeeding up to 6 months rate, estimated to 51% according DRC Multiple Indicator Cluster Survey (MICS) 2017-2018 [19]. The variable "exclusive breastfeeding up to 6 months" was considered since it gives a largest sample size compared to the other IYCF practices. Aiming at an absolute precision of 5% at the 95% confidence level, further assuming a design effect of 2.0 and allowing for 20% refusals and incomplete questionnaires, the required sample size was 1010, equivalent to 505 in each Health Zone. Sampling was systematic and proportional to the population (infants) size for each HA.
2.6 Statistical data analyses
Data were entered and analyzed using SPSS for Windows version 25 (SPSS Inc. Version 25.0, Chicago, Illinois). Characteristics of mothers and infants were summarized as mean and standard deviation (SD) for continuous variables with a normal distribution, or as median and range for continuous variables with a non-normal distribution, and as number or percentages for categorical variables. Normality of continuous variables was explored visually (Q-Q plots and histogram) and numerically (Shapiro-Wilk and Kolomogorov-Smirnov tests). For categorical variables, we compared proportions using the chi-square or Fischer exact test; for continuous variables, medians were compared using the Wilcoxon rank-sum test. WHO Anthro plus 2011 version 1.0.4 (WHO, Geneva, Switzerland) was used to assess anthropometric z-scores with WHO 2006 reference. The age, gender, presence or not of bilateral pitting edema, and anthropometric measurements of infants were imported into WHO Anthro plus software, which then calculated WAZ, LAZ and WLZ and identified outliers: < - 6 and > 5 for WAZ, < - 6 and > 6 for LAZ and < - 5 and > 5 for WLZ. These values were excluded. Finally, this software assessed the infant’s nutritional status according to z-scores, MUAC, and the presence or not of bilateral pitting edema.
To study the factors associated with inappropriate complementary feeding practice, we conducted univariable and multiple logistic regression analyzes. The variables were imported into the multiple regression model on the basis of a value p≤0.25 and/or on the basis of biological plausibility. The unadjusted and adjusted odds ratios with their 95% confidence intervals were used to measure the association between the variables and inappropriate complementary feeding practice.
3. Results
3.1 Sample characteristics
Of the 1010 sampled mother-infant pair in each Health Zone, 509 were successfully included in IHZ and 500 in KHZ. All mothers in the selected households consented to participate in the survey. The median age of the children was 12 (range: 0.5- 23.9) months with 74.0% being in the age group 6–23.9 months. Five hundred and ten (50.5%) children were male. Eight hundred and eighteen (81.4%) households had a low socio-economic level and 416 (41.2%) had a low maternal educational level. Low socio-economic and maternal educational levels were more prevalent in rural areas than in urban ones (p<0.05). The post-natal care follow-up rate was 12.0%, higher in rural areas than in urban ones (p<0.05). The other socio-demographic characteristics are summarized in Table 2.
3.2 Infants’ nutritional status
Of the 1,009 infants measured and weighed, 12 (1.2%) had outliers’ measurements. Of the 997 infants with valid anthropometric parameters, 416 (41.7%) were well-nourished, 374 (37.5%) were undernourished and 207 (20.8%) were overweight. No infant had edema. The stunting, underweight, wasting (WLZ <-2 and/or MUAC < 125mm) and overweight rates were 46.9%, 18.9%, 16.6% and 20.8% respectively (Table 2). Underweight was significantly high in rural area while overweight was significantly important in urban area (p<0.05). Undernutrition was more prevalent among infants between 6-23.9 months of age and those with inappropriate complementary feeding practices. Indeed, 322 (86.0%) undernourished infants were 6-23.9 months of age (p<0.05) and they were 2.19 times as likely to be undernourished than their counterparts (AOR 2.19; 95% CI 1.12, 5.74; p<0.000). Three hundred and one (93.5%) infants with inappropriate complementary feeding practices were undernourished. Mothers with inappropriate complementary feeding practices were 6.88 times more likely to have undernourished infants than their counterparts (OR 6.88; 95% CI 1.24, 18.37; p<0.000).
3.3 IYCF practice
IYCF practices are summarized in Table 3. Almost all (99.3%) of the infants in our sample were breastfed, with 68.0% of infants still breastfeeding through the second year of life. The early initiation of breastfeeding rate was 73.7%, significantly higher in urban (79.8%) than in rural area (67.8%) (p<0.05). The exclusive breastfeeding rate for the first six months was 42.2%, significantly higher in urban (50.9%) than in rural area (37.7%) (p<0.05). Complementary feeding practices are summarized in Figure 1. The majority, 727 (98%) and 631 (85%) infants received cereals-roots-tubers and legume-based foods respectively. The consumption of animal foods was low as only 31% consumed flesh foods and only 12% consumed eggs. Consumption of dairy products, eggs, fruits and vegetables was significantly lower for rural infants compared to urban ones (p<0.05). Among 746 children 6–23.9 months of age, 474 (63.5%) had minimum meal frequency, 250 (33.5%) had minimum dietary diversity and 203 (27.2%) had minimum acceptable diet, with rates higher in urban than in rural areas for all these indicators (p<0.05). Two hundred and forty-one (32.3%) infants had appropriate complementary feeding, with rates significantly higher in urban (36.0%) than in rural areas (28.0%) (p<0.05). Four hundred and thirty-four (43.0%) infants received complementary feeding at 4 months of age; all infants were fed with solid, semi-solid or soft foods at 8 months of age.
3.4 Factors associated with inappropriate complementary feeding
The univariate analysis showed that residence Health Zone, attendance at postnatal care, household socioeconomic status, maternal education status and polygamous were statistically associated with inappropriate complementary feeding practice. In the multivariable logistic regression analysis, residence Health Zone, attendance at postnatal care, household socioeconomic status, and maternal education status were independent predictors for inappropriate complementary feeding practice (Table 4). Mothers living in rural area were 2.38 times as likely to have inappropriate complementary feeding practice than those living in urban area (AOR 2.38; 95% CI 1.49, 3.78). Mothers who didn't have postnatal care follow up were 1.63 times more likely to have inappropriate complementary feeding practice than those who attend postnatal care (AOR 1.63; 95% CI 1.12, 2.96). Mothers with low education level were 1.83 times as likely to have inappropriate complementary feeding practice than their counterparts (AOR 1.83; 95% CI 1.20, 2.77). Mothers with low household socioeconomic were 1.72 times more likely to have inappropriate complementary feeding practice than those with good household socioeconomic (AOR 1.72; 95% CI 1.14, 2.59).
|
Core indicators |
|
|
1. Early initiation of breastfeeding |
Children 0–23.9 months who were breastfed within 1 h of birth |
|
2. Exclusive breastfeeding under 6 months |
Children 0–5.9 months of age who had consumed nothing other than breast milk |
|
3. Continued breastfeeding at 1 year |
Children 12–14.9 months who were being still breastfed |
|
4. Introduction of solid, semi-solid or soft foods |
Children 6–8.9 months who received solid, semi-solid or soft foods at least once on the day preceding the survey date |
|
5. Minimum dietary diversity |
Children 6–23.9 months who received four or more food groups out of seven food groups [grains, roots and tubers, legumes and nuts, dairy products (milk, yogurt, cheese), flesh foods (meat, fish, poultry and liver/organ meats), eggs, vitamin-A-rich fruits and vegetables, and other fruits and vegetables] |
|
6. Minimum meal frequency |
Breastfed children 6–23.9 months who were fed a minimum recommended number of times each day. Minimum is defined as 2 times for breastfed infants 6–8.9 months, 3 times for breastfed children 9–23.9 months, 4 times for non-breastfed children 6–23.9 months |
|
7. Minimum acceptable diet |
Children 6–23.9 months old who met age-specific minimum recommended diet diversity and minimum recommended meal frequency and consumed a source of dairy (or were breastfed) |
|
8. Consumption of iron-rich or iron-fortified foods |
Children 6–23.9 months who received iron-rich/iron-fortified foods |
|
Optional indicators |
|
|
1. Children ever breastfed |
Children 0–23.9 months who were ever breastfed |
|
2. Continued breastfeeding at 2 years |
Children 21–23.9 months who were still breastfed |
|
3. Age-appropriate breastfeeding |
Age-appropriate patterns of breastfeeding for children 0–23.9 months (i.e. exclusively breastfed for children 0–5.9 months old; still breastfed for children 6–23.9 months) |
|
4. Predominant breastfeeding under 6 months |
Children 0–5.9 months old, receiving breast milk and other non-nutritive liquids (e.g. water) |
|
5. Duration of breastfeeding |
Duration of breastfeeding among children less than 36 months of age |
|
6. Bottle feeding |
Children 0–23.9 months old, who were fed with a bottle in the last 24h |
|
7. Milk feeding frequency for non-breastfed children |
Children 6–23.9 months who receive at least 2 milk feedings |
Table 1: WHO-recommended core and optional indicators for measuring IYCF practices (WHO 2010).
|
Characteristics |
Total (N=1,009) |
Urban (N=509) |
Rural (N=500) |
|
Sociodemographic characteristics |
|||
|
Infants age (in months), median (range) |
12 (0.5 – 24) |
13 (1 – 24) |
12 (0.5 – 24) |
|
Infants aged between 6-23.9 months, n (%) |
746 (74.0) |
397 (78.0) |
349 (69.8) |
|
Mothers age (in months), median (range) |
27 (15 – 43) |
29 (22 – 42) |
28 (15 – 43) |
|
Mothers aged between 18-35 years of age, n (%) |
804 (79.7) |
482 (94.7) |
322 (64.4) |
|
Female sex, n (%) |
499 (49.5) |
262 (51.5) |
237 (47.4) |
|
Home delivery*, n (%) |
61 (6.0) |
18 (3.5) |
43 (8.6) |
|
Non-attendance at postnatal care*, n (%) |
121 (12.0) |
43 (8.5) |
78 (15.6) |
|
Low socioeconomic level*, n (%) |
818/1,005 (81.4) |
339/505 (67.1) |
479 (95.8) |
|
Maternal education less than secondary***, n (%) |
416 (41.2) |
83 (16.3) |
333 (66.6) |
|
Children live with both biological parents, n (%) |
939/1,007 (93.2) |
454/508 (89.4) |
485/499 (97.2) |
|
Children live in polygamous family***, n (%) |
415/999 (41.5) |
52/505 (10.3) |
363/494 (73.5) |
|
Number of household members, median (range) |
6 (2 – 20) |
6 (2 – 18) |
6 (3 – 20) |
|
Sibling size, mean (SD) |
5 (3) |
4 (2) |
6 (4) |
|
Child fully immunized, n (%) |
612/1,005 (60.9) |
330/506 (65.2) |
282/499 (56.5) |
|
Anthropometric data |
|||
|
Weight-for-age z-score |
|||
|
Mean score |
- 0.6 (1.7) |
- 0.3 (1.8) |
- 0.9 (1.6) |
|
Score < –2**, n (%) |
189/997 (18.9) |
71/501 (14.1) |
118/496 (23.8) |
|
Height-for-age z-score |
|||
|
Mean score |
- 1.7 (2.5) |
- 1.7 (2.9) |
- 1.7 (2.1) |
|
Score < –2, n (%) |
468/997 (46.9) |
245/501 (48.9) |
223/496 (44.9) |
|
Weight-for-height z-score |
|||
|
Mean score |
0.5 (2.5) |
0.9 (2.7) |
0.1 (2.4) |
|
Score < –2, n (%) |
157/997 (15.7) |
73/501 (14.6) |
84/496 (16.9) |
|
Score > +2**, n (%) |
207/997 (20.8) |
149/501 (29.7) |
58/496 (11.7) |
|
MUAC (children 6-23.9 months) |
|||
|
Mean circumference, in mm (SD) |
130 (17) |
134 (15) |
126 (19) |
|
Circumference <125 mm*, n (%) |
131/746 (17.6) |
55/397 (13.8) |
76/349 (21.8) |
*: p < 0.05; **: p < 0.01; ***p < 0.001; IYCF: Infant and Young Child Feeding; MUAC: mid-upper arm circumference; SD: Standard Deviation
Table 2: Baseline characteristics of the study participants.
|
Variable |
Total |
Urban |
Rural |
|
Children ever breastfed (children 0-23.9 months), n (%) |
1,002/1,009 (99.3) |
502/509 (98.6) |
500/500 (100) |
|
Started breastfeeding within 1 h (children 6-23.9 months) *, n (%) |
744/1,009 (73.7) |
345/509 (67.8) |
399/500 (79.8) |
|
Exclusive breastfed the first six months (children 0-5.9 months) *, n (%) |
111/263 (42.2) |
56/110 (50.9) |
57/151 (37.7) |
|
Continued breastfeeding at 1 year (children 12-15.9 months), n (%) |
164/168 (97.6) |
66/69 (95.9) |
98/99 (98.9) |
|
Continued breastfeeding at 2 years (children 20-23.9 months) *, n (%) |
170/250 (68.0) |
86/133 (64.6) |
84/117 (71.8) |
|
Bottle feeding (children 0-23.9 months) **, n (%) |
61/1,009 (6.0) |
41/509 (8.0) |
20/500 (4.0) |
|
Introduction of solid, semi-solid or soft foods (children 6-8.9 months), n (%) |
76/100 (76.0) |
41/53 (77.3) |
35/47 (74.5) |
|
Took minimum meal frequency (children 6-23.9 months) **, n (%) |
474/746 (63.5) |
294/397 (74.0) |
180/349 (51.6) |
|
Took minimum dietary diversity (children 6-23.9 months) **, n (%) |
250/746 (33.5) |
179/397 (45.0) |
71/349 (20.3) |
|
Took minimum acceptable diet (children 6-23.9 months) **, n (%) |
203/746 (27.2) |
155/397 (39.0) |
48/349 (13.7) |
|
Consumed iron-rich foods (children 6-23.9 months) **, n (%) |
372/746 (49.8) |
227/397 (57.2) |
145/349 (41.5) |
|
Had appropriate complementary feeding (children 6-23.9 months) *, n (%) |
241/746 (32.3) |
143/397 (36.0) |
98/349 (28.0) |
*: p < 0.05; **: p < 0.01
Table 3: WHO criteria assessing infant and young child feeding practice.
|
Variables and categories |
IYCF practice |
COR (95%CI) |
AOR (95%CI) |
|
|
Inappropriate n (%) |
Appropriate n (%) |
|||
|
Residence Health Zone |
||||
|
Rural |
290 (83.6) |
56 (16.4) |
1.56 (1.41 – 1.74) *** |
2.38 (1.49 – 3.78) *** |
|
Urban |
212 (53.4) |
185 (46.6) |
1 |
1 |
|
Place of delivery |
||||
|
Home |
30 (58.8) |
21 (41.2) |
0.98 (0.73 – 1.32) |
|
|
Health facility |
472 (62.2) |
220 (31.8) |
1 |
|
|
Attended PNC |
||||
|
No |
92 (82.9) |
19 (17.1) |
1.44 (1.25 – 1.84) ** |
1.63 (1.12 – 2.96) ** |
|
Yes |
410 (64.9) |
222 (35.1) |
1 |
1 |
|
Socioeconomic status |
||||
|
Low |
436 (72.9) |
162 (27.1) |
1.63 (1.35 – 1.97) *** |
1.83 (1.20 – 2.77) *** |
|
Good |
66 (45.5) |
79 (55.5) |
1 |
1 |
|
Maternal education |
||||
|
Less than secondary |
242 (82.6) |
50 (17.4) |
1.43 (1.30 – 1.57) *** |
1.72 (1.14 – 2.59) ** |
|
Secondary and above |
260 (57.6) |
191 (42.4) |
1 |
1 |
|
Polygamous family |
||||
|
Yes |
227 (81.9) |
50 (18.1) |
1.41 (1.28 – 1.54) *** |
|
|
No |
275 (59.0) |
191 (41.0) |
1 |
|
|
Parents live with children |
||||
|
No |
33 (67.3) |
16 (32.7) |
0.99 (0.81 – 1.22) |
|
|
Yes |
469 (67.6) |
225 (32.4) |
1 |
|
|
Household size |
||||
|
> 10 |
77 (72.0) |
30 (28.0) |
1.06 (0.92 – 1.33) * |
|
|
5 – 10 |
239 (66.2) |
122 (33.8) |
0.98 (0.88 – 1.09) |
|
|
< 5 |
186 (67.4) |
89 (32.6) |
1 |
|
*p < 0.25; **p < 0.05; ***p < 0.01; AOR: adjusted odd-ratio; CI: Confidence interval; COR: Crude odd-ratio; IYCF: Infant and young child feeding
Table 4: Univariate and multivariable logistic regression analysis of factors associated with inappropriate complementary feeding practice.
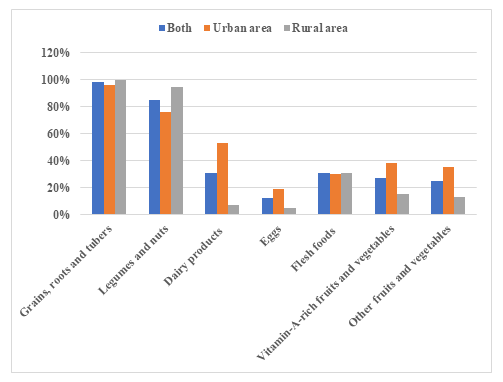
Figure 1: Proportion of children consuming the different food groups in South Kivu (DRC), 2019; N=742.
4. Discussion
This study sought to describe IYCF practices and nutritional status among infants < 24 months in food security crisis context. The findings of this study indicate that 68% of infants were exposed to inappropriate complementary feeding practices, with residence in rural area, non-attendance at postnatal care, low household socioeconomic, and low maternal education being factors associated to those practices. Furthermore, our results show a coexistence of undernutrition (37.5%) and overnutrition (21%). Breastfeeding is a universal practice in DRC. Nationally and in South Kivu province, 98.7% and 98.9% of newborns are breastfed respectively [19]. Our study found the same trends with 99.3% of breastfed newborns. Nationally, however, only 47% of newborns are breastfed within the first hour after birth [19]. The early initiation of breastfeeding rate reported in this is high compared to the findings of other study conducted in South Kivu (65%) [20]. It is good compared to WHO grades on IYCF practices [16]. The exclusive breastfeeding prevalence found in this study is low compared to that of DRC MICS 2017-2018 (53.5%) [19], and fair compared to WHO grades on IYCF practices [16]. However, the exclusive breastfeeding practice for the first six months is trending upward in the DRC, from 24% in 2001 to 53.5% in 2018 [19]. In 2017, only 37% of infants under 6 months of age were exclusively breastfed in Africa [21].
The early initiation of breastfeeding and the exclusive breastfeeding refer to the best practice recommendation by the WHO [22]. The short and long-term health benefits of breastfeeding for children and mothers have been well documented: the “skin to skin” contact between mother and newborn immediately after birth favors the newborn’s skin colonization by the mother’s microbiota, facilitates the regulation of body temperature, maintains the blood glucose levels stable, and contributes to cardiorespiratory stability [23, 24]. In Nepal [25] and in Ghana [26], the early initiation of breastfeeding has been associated with a 19% and 22% reduction in deaths respectively. The exclusive breastfeeding is an IYCF associated with lower neonatal mortality. It prevents morbidities such as diarrhea, pneumonia and neonatal septicemia. It reduces the risk of nutritional disorders such as undernutrition, obesity and diabetes mellitus later in life [27-30]. The overall appropriate complementary feeding practice prevalence was 32.3%, which is consistent with studies’ findings of 32% in South India [31], 35% in Kenya [32], 37% in Zambia [33], and in Ethiopia [34]. Low prevalence was reported in Benin (24%) [35] and in Ghana (15.7%) [36]. The differences in health services such like health education and advice on breastfeeding and complementary feeding during prenatal and postnatal care, region-dependent feeding cultural practices and the study's time difference could be the factors explaining these differences.
In this report, rural residence, non-attendance at postnatal care, low household socio-economic and low maternal education were factors associated with inappropriate complementary feeding practices. A study aiming to characterize IYCF practices and barriers to optimal child feeding in South Kivu (DRC) have identified poverty, high work burden, lack of decision-making power in the household, and perceived milk insufficiency as barriers to optimal child feeding [37]. In the rural areas of the DRC, subsistence agriculture (the major livelihood for the majority of the households) faces several constraints: infrastructure is poor, farmers have limited access to agricultural input, they rely on traditional cultivation technologies and cultivate small land-holdings. The civil war has worsened the situation, leading to a massive rural exodus of the population. Additionally, the subsistence agricultural sector has also been seriously neglected by the government and development agencies [38-41]. The urban–rural gap in nutritional indicators has also been attributed to other factors: low maternal education, lack in access to quality food due to low household socioeconomic, and lack of availability of health services [42-45]. Our findings corroborate this reality by showing a large proportion of households with low socio-economic and maternal education levels in rural areas than in urban ones (p<0.05). All these factors contribute to inappropriate complementary feeding in rural areas.
A significant association was observed between inappropriate complementary feeding practice and non-attendance at postnatal care, which is consistent with study findings in Kenya [46], Ethiopia [47], Tanzania [48], and in India [49]. This might be due to the result of information and counseling on IYCF practice that the mothers received from health workers during their postnatal visits. Low maternal education was associated with inappropriate complementary feeding practice, which is consistent with study findings reported elsewhere [50-51]. However, studies from Nepal [52] and Lebanon [53] did not found this association. Several factors explain the low rate of inappropriate complementary feeding among educated mothers: educated mothers may have a better understanding of feeding practices than less educated mothers or mothers without formal education; they have more access to information on feeding practices through books, pamphlets, magazines, and media than their counterparts; they also have access to more household resources than an uneducated mother; Finally, they are more likely to be in paid employment. Low household wealth was strongly associated with inappropriate complementary feeding practice. Mothers from poor households typically do not have sufficient resources to provide their children with foods of the required nutritional value. The main limiting factor for providing children with nutritious complementary foods is the limited opportunities for access such foods, as reported in a study conducted in Tibet [54]. Several studies have also shown that improved household wealth has a significant effect on adequate complementary feeding practices [55, 56].
Our study found a high prevalence of undernutrition (37.5%) and overweight (20.8%) in the same infant population. The co-existence of under- and overnutrition, a phenomenon known as the double burden of malnutrition, poses a novel public health challenge. Undernutrition continues to cause approximately 45% of deaths in children under 5, while low- and middle-income countries now witness a simultaneous rise in childhood overweight and obesity (increasing at a rate 30% faster than in richer nations) [57, 58]. It is characterized by the coexistence of undernutrition along with overnutrition within individuals, households and populations throughout life [57]. In 2020, 190 million undernourished children under-5 out of 200 million were located in Sub-Saharan Africa and Asia. At the same time, 29 million overweight children under-5 out of 37 million were located in the same setting [1]. The relationship between undernutrition and overnutrition is more than a coexistence. According to several recent evidence studies, undernutrition early in life, even in utero, may predispose to overweight and noncommunicable diseases such as diabetes mellitus and heart disease later in life. Overweight in mothers is also associated with overweight and obesity in their offspring. Rapid weight gain early in life may predispose to long-term weight excess [57].
4.1 Study limitations
Our study has some limitations. Firstly, IYCF practices was assessed based on a 24-h recall method. Recall bias may be possible and affect the validity of the results. Secondly, the cross-sectional nature of the study may be a limiting factor in the interpretation of causality because the problem of endogeneity cannot be formally ruled out.
5. Conclusion
Findings from this study provide strong evidence, both of association between inappropriate complementary feeding and undernutrition, and of the DBM with the co-existence of under- and overnutrition in the infant population. In low- and middle-income countries, child undernutrition is increasingly described and interventions are mainly focused on this form of malnutrition. The DBM is great concern because overweight and obese children are more likely to stay obese into adulthood and to develop noncommunicable diseases at a younger age. Interventions should focus on both preventing under-nutrition and overweight to promote child well-being. On the other hand, interventions to promote household socio-economic well-being and access to education for all would improve IYCF practices. Mothers should be made aware of the importance of post-natal follow-up during which they are educated on good IYCF practices. Finally, prospective cohort studies should be conducted to better elucidate the relationship between the child feeding indicators and both undernutrition and overnutrition.
Declarations
Ethics approval and consent to participate
Ethical approval was granted by the Ethical Committee of the Université Catholique de Bukavu (UCB/CIES/NC/08/2018). Informed consent was obtained after needed information and explanation. Participation was voluntary and each woman signed (or provided a thumb print if she was uneducated) a statement of an informed consent after which she was interviewed.
Consent for publication
Not applicable.
Availability of data and material
The datasets used and/or analysed during the current study are available from the corresponding author on reasonable request.
Competing interests
The authors declare that they have no competing interests.
Funding
In this work, we did not receive any funding from any source.
Authors' contributions
RMK and DVDL designed the study and reviewed the manuscript for important intellectual content. SN, BRC, AB and KCM were responsible for collecting the data. GAN supervised the team of surveyors. GAN and JBK analyzed the data. RMK wrote the manuscript. RMK and DVDL critically revised the manuscript. All authors read and approved the final manuscript.
Acknowledgements
We thank the Coordination of the Provincial Nutrition Programme/South Kivu/Provincial Health Division (DPS) for the logistical support throughout the survey. We express our sincere gratitude to the data collection team members for their hard work and commitment, and for working tirelessly during the data collection phase. Finally, we thank all women, infants and their families in the Ibanda and Kabare health zones for their participation in this survey.
References
- UNICEF, WHO, International Bank for Reconstruction and Development/The World Bank. Levels and trends in child malnutrition: key findings of the 2021 edition of the joint child malnutrition estimates. New York, NY: United Nations Children’s Fund (2021).
- United Nations Inter-agency Group for Child Mortality Estimation (UN IGME). Levels & Trend in Child Mortality: Estimates Developed by the UN Inter-agency Group for UN Inter-agency Group for Child Mortality Estimation (2020).
- Robertson RC, Manges AR, Finlay BB, et al. The human microbiome and child growth – First 1000 days and beyond. Trends Microbiol 27 (2019): 131-147.
- Schwarzenberg SJ, Georgieff MK. Advocacy for improving nutrition in the first 1000 days to support childhood development and adult health. Pediatrics 141 (2018).
- WHO and UNICEF. Global strategy for infant and young child feeding. Geneva: World health organization; (2003).
- Programming guide, infant and young child feeding, nutrition section, programmes, UNICEF. New York (2012).
- WHO, UNICEF, USAID, FANTA, AED, UC DAVIS, IFPRI. Indicators for assessing infant and young child feeding practices part 2: measurement. Geneva: The World Health Organization (2010).
- Lamichhane DK, Leem JH, Kim HC, et al. Association of infant and young child feeding practices with under-nutrition: evidence from the Nepal Demographic and Health Survey. Paediatr Int Child Health 36 (2016): 260-269.
- Menon P, Bamezai A, Subandoro A, et al. Age-appropriate infant and young child feeding practices are associated with child nutrition in India: Insights from nationally representative data. Matern Child Nutr 11 (2015): 73-87.
- Zongrone A, Winskell K, Menon P. Infant and young child feeding practices and child undernutrition in Bangladesh: insights from nationally representative data. Public Health Nutr 15 (2012): 1697-1704.
- World Food Programme (WFP) Democratic Republic of Congo. Emergency Situation Report (2019).
- Kandala NB, Madungu TP, Emina JB, et al. Malnutrition among children under the age of five in the Democratic Republic of Congo (DRC): does geographic location matter?. BMC Public Health 11 (2011): 261.
- Action Against Hunger. Enquête Nutritionnelle Anthropométrique: Zone de Santé d’Ibanda. [Nutritional Anthropometric Study: health zone Ibanda.]. New York: Action Against Hunger (2011).
- Action Against Hunger. Enquête Nutritionnelle Anthropométrique: Zone de Santé de Kabare. [Nutritional Anthropometric Study: health zone Kabare]. New York: Action Against Hunger (2011).
- Coates J, Swindale A, Bilinsky P. Household Food Insecurity Access Scale (HFIAS) for Measurement of Food Access: Indicator Guide. Version 3 (2007).
- World Health Organization. Infant and young child feeding: a tool for assessing national practices policies and programmes (2003).
- Physical status: the use and interpretation of anthropometry. A postponement of a WHO Expert Committee. Geneva: WHO Technical Series Geneva (1995).
- de Onis, M. WHO Child Growth Standards. World Health Organization 80 (2006): 1-312.
- Multiple Indicator Cluster Survey, 2017-2018, Survey Findings Report. Kinshasa, Democratic Republic of Congo.
- Kambale RM, Buliga JB, Isia NF, et al. Delayed initiation of breastfeeding in Bukavu, South Kivu, eastern Democratic Republic of the Congo: A cross-sectional study. Int Breastfeed J 13 (2018): 1-9.
- Bhattacharjee N V, Schaeffer LE, Marczak LB, et al. Mapping exclusive breastfeeding in Africa between 2000 and 2017. Nat Med 25 (2019): 1205-1212.
- Breastfeeding-early initiation: World Health Organization; (2012).
- Moore ER, Anderson GC, Bergman N. Early skin-to-skin contact for mothers and their healthy newborn infants. Cochrane Database Syst Rev (2012): CD003519.
- Wight NE. Hypoglycemia in breastfed neonates. Breastfeed Med 1 (2006): 253-262.
- Mullany LC, Katz J, Li YM, et al. Breastfeeding patterns, time to initiation, and mortality risk among newborns in southern. Nepal J Nutr 138 (2008): 599-603.
- Edmond KM, Zandoh C, Quigley MA, et al. Delayed breastfeeding initiation increases risk of neonatal mortality. Pediatrics 117 (2006): e380-e386.
- Khan MN, Islam MM. Effect of exclusive breastfeeding on selected adverse health and nutritional outcomes: A nationally representative study. BMC Public Health 17 (2017): 1-7.
- Scherbaum V, Srour ML. The Role of Breastfeeding in the Prevention of Childhood Malnutrition. World Rev Nutr Diet 115 (2016): 82-97.
- Wang L, Collins C, Ratliff M, et al. Breastfeeding Reduces Childhood Obesity Risks. Child Obes 13 (2017): 197-204.
- Pereira PF, Alfenas RDCG, Araújo RMA. Does breastfeeding influence the risk of developing diabetes mellitus in children? A review of current evidence. J Pediatr (Rio J) 90 (2014): 7-15.
- Rao S, Swathi P, Unnikrishnan B, et al. Study of complementary feeding practices among mothers of children aged six months to two years-study from coastal south India. Aus Med J 4 (2011): 252.
- Bryan Rachael. The Development of Weaning Practices Among Women of the Mombasa District, Its Effects on Children’s Public Health Issues, and the Proposition of Intervention Plans (2006).
- Katepa-Bwalya M, Mukonka V, Kankasa C, et al. Infants and young children feeding practices and nutritional status in two districts of Zambia. Int Breastfeed J 10 (2006): 5.
- Dagne AH, Anteneh KT, Badi MB, et al. Appropriate complementary feeding practice and associated factors among mothers having children aged 6-24 months in Debre Tabor Hospital, North West Ethiopia 2016. BMC Res Notes 12 (2019): 1-6.
- Sossa CJ, Laleye FF, Agueh VD, et al. Evaluation of feeding practices in children aged 6–23 months in southern Benin rural setting. Int J Trop Dis Health 10 (2015): 1-8.
- Saaka M, Wemakor A, Abizari AR, et al. How well do WHO complementary feeding indicators relate to nutritional status of children aged 6–23 months in rural Northern Ghana?. BMC Public Health 5 (2015): 1157.
- Burns J, Emerson JA, Amundson K, et al. A Qualitative Analysis of Barriers and Facilitators to Optimal Breastfeeding and Complementary Feeding Practices in South Kivu, Democratic Republic of Congo. Food Nutr Bull 37 (2016): 119-131.
- Akakpo K, Lero P, Phambu C, et al. Democratic Republic of Congo Comprehensive Food Security and Vulnerability Analysis (Cfsva). Nutrition (2014): 113.
- Comprehensive food security and vulnerability analysis Democratic Republic of Congo. Rome: World Food Programme (WFP) (2014).
- Weijs B, Hilhorst D, Fer A. Livelihoods, basic services and social protection in Democratic Republic of the Congo. In Wageningen working paper. Wageningen: Wageningen University (2012).
- Van Herp M, Parque V, Rackley E, et al. Mortality, violence and lack of access to health-care in the Democratic Republic of Congo. Disasters 27 (2003): 141-153.
- Smith LC, Ruel MT, Ndiaye A. Why is child malnutrition lower in urban than in rural areas? Evidence from 36 developing countries. World Dev 33 (2005): 1285-1305.
- Ortiz J, Van Camp J, Wijaya S, et al. Determinants of child malnutrition in rural and urban Ecuadorian highlands. Public Health Nutr 17 (2014): 2122-2130.
- Fotso JC. Child health inequities in developing countries: differences across urban and rural areas. Int J Equity Health 5 (2006): 9.
- Fotso JC. Urban–rural differentials in child malnutrition: trends and socioeconomic correlates in sub-Saharan Africa. Health Place 13 (2007): 205-23.
- Gewa CA, Leslie TF. Distribution and determinants of young child feeding practices in the East African region: demographic health survey data analysis from 2008-2011. J Health Popul Nutr 34 (2015): 2-14.
- Tessema M, Belachew T, Ersino G. Feeding patterns and stunting during early childhood in rural communities of Sidama, South Ethiopia. Pan Afr Med J 14 (2013).
- Victor R, Baines SK, Agho KE, et al. Factors associated with inappropriate complementary feeding practices among children aged 6-23 months in Tanzania. Matern Child Nutr 10 (2014): 545-561.
- Patel A, Pusdekar Y, Badhoniya N, et al. Determinants of inappropriate complementary feeding practices in young children in India: secondary analysis of National Family Health Survey 2005-2006. Matern Child Nutr J 8 (2012): 28-44.
- Dagne AH, Anteneh KT, Badi MB, et al. Appropriate complementary feeding practice and associated factors among mothers having children aged 6-24 months in Debre Tabor Hospital, North West Ethiopia, 2016. BMC Res Notes 12 (2019): 1-6.
- Hasnain S, Majrooh MA, Anjum R. Knowledge and practices of mothers for complementary feeding in babies visiting pediatrics outpatient department of Jinnah Hospital, Lahore. Biomedica 29 (2013): 221-230.
- Basnet S, Sathian B, Malla K, et al. Reasons for early or late initiation of complementary feeding: a study in Pokhara. Am J Public Health Res 3 (2015): 69-75.
- Batal M, Boulghourjian C, Akik C. Complementary feeding patterns in a developing country: a cross-sectional study across Lebanon. East Mediterr Health J 16 (2010): 180-186.
- Dang S, Yan H, Yamamoto S, et al. Feeding practice among younger Tibetan children living at high altitudes. Eur J Clin Nutr 59 (2005): 1022-1029.
- Joshi N, Agho KE, Dibley MJ, et al. Determinants of inappropriate complementary feeding practices in young children in Nepal: secondary data analysis of Demographic and Health Survey 2006. Matern Child Nutr 8 (2012): 45-59.
- Kabir I, Khanam M, Agho KE, et al. Determinants of inappropriate complementary feeding practices in infant and young children in Bangladesh: secondary data analysis of Demographic Health Survey 2007. Matern Child Nutr 8 (2012): 11-27.
- WHO: Double burden of malnutrition policy brief. Geneva: World Health Organization (2017).
- Tzioumis E, Adair LS. Childhood dual burden of under-and overnutrition in low-and middle-income countries: a critical review. Food Nutr Bull 35 (2014): 230-243.