Sujan Dash1, Md Musa Ali2, Md. Anwer Hossain3, Md. Mahedi Hasan Khan4, Mohammad Rakibul Islam Babu5, Apurba Kumar Sarker6, Foysal Ahmmed Roni7, M. M. Al-Shakib Rhidoy8*
1Department of Biochemistry & Immunology, Parkview Hospital & Diagnostic Limited, Chattogram, Bangladesh.
2Department of Data Analytics, Touro University, New York, USA.
3Department of Biochemistry and Molecular Biology, Modern Diagnostic Centre Limited, Dhaka, Bangladesh.
4 Department of Biochemistry & Molecular Biology, Tejgaon College, Dhaka, Bangladesh.
5Department of Orthodontics & Dentofacial Orthopaedics, City Dental College & Hospital, Dhaka, Bangladesh.
6Department of Biochemistry and Molecular Biology, Life Care Medical Center, Dhaka, Bangladesh.
7Department of Biochemistry, Labaid Medical Centre Gulshan Ltd, Dhaka, Bangladesh.
8Department of Laboratory Medicine, Asgar Ali Hospital, Dhaka, Bangladesh.
*Corresponding Author: M. M. Al-Shakib Rhidoy, Department of Laboratory Medicine, Asgar Ali Hospital, Dhaka, Bangladesh.
Received: 21 February 2026; Accepted: 21 February 2026; Published: 23 June 2026
Background: Serum carbohydrate antigen 19-9 (CA 19-9) is widely recognized as a tumor marker for pancreatic and hepatobiliary malignancies; however, elevated CA 19-9 levels are also frequently observed in several benign metabolic and cholestatic conditions. Differentiating benign elevations from malignant causes remains clinically important to avoid unnecessary diagnostic interventions and patient anxiety.
Objective: To evaluate the metabolic and cholestatic factors associated with elevated serum CA 19-9 levels among adult patients in Bangladesh.
Methods: This hospital-based cross-sectional analytical study was conducted at a tertiary care cancer hospital in Dhaka, Bangladesh, from April 2025 to December 2025. A total of 150 adult patients with elevated serum CA 19-9 levels (>37 U/mL) were enrolled using a consecutive sampling technique. Sociodemographic, clinical, and biochemical data were collected using a structured data sheet and hospital laboratory records. Serum CA levels 19-9 were measured by chemiluminescent immunoassay. Metabolic parameters including body mass index (BMI), fasting blood glucose (FBS), HbA1c, triglycerides, and fatty liver status were assessed alongside cholestatic markers such as alkaline phosphatase (ALP), gamma-glutamyl transferase (GGT), total bilirubin, and direct bilirubin. Statistical analyses were performed using SPSS version 26. Independent t-test, Pearson correlation, and multivariate regression analyses were applied. A p-value was considered statistically significant.
Results: Among the 150 participants, the majority were aged 41–60 years (48.0%), and males constituted 58.7% of the study population. Diabetes mellitus was present in 52.7% of participants, while fatty liver disease and obesity were observed in 38.7% and 30.7%, respectively. The mean serum CA 19-9 level was 96.4 ± 48.2 U/mL. Patients with higher CA 19-9 levels (>100 U/mL) demonstrated significantly elevated metabolic parameters including HbA1c (8.8 ± 1.9 vs. 7.1 ± 1.4; p BMI (29.1 ± 4.2 vs. 25.8 ± 3.4 kg/m²; p=0.002), fasting blood glucose (178.3 ± 58.4 vs. 142.5 ± 41.3 mg/dL; p=0.001), and triglyceride levels (246.7 ± 82.6 vs. 189.4 ± 62.5 mg/dL; p=0.003). Similarly, cholestatic markers were significantly higher among patients with elevated CA 19-9 levels, including ALP (375.7 ± 126.2 vs. 214.3 ± 92.6 U/L; p<0.001), GGT (192.6 ± 81.5 vs. 98.2 ± 52.4 U/L; p<0.001), direct bilirubin (1.7 ± 1.1 vs. 0.8 ± 0.5 mg/dL; p<0.001), and total bilirubin (3.2 ± 1.6 vs. 1.5 ± 0.8 mg/dL; p<0.001). Serum CA 19-9 showed significant positive correlations with ALP (r=0.62), GGT (r=0.58), direct bilirubin (r=0.55), HbA1c (r=0.46), triglyceride levels (r=0.37), and BMI (r=0.31) (all p<0.01). Multivariate regression analysis identified ALP (Adjusted β=0.48, p<0.001), GGT (Adjusted β=0.36, p=0.002), direct bilirubin (Adjusted β=0.33, p=0.004), and HbA1c (Adjusted β=0.28, p=0.011) as independent predictors of elevated serum CA 19-9 levels.
Conclusion: Elevated serum CA 19-9 levels were significantly associated with metabolic dysfunction and cholestatic abnormalities, particularly elevated ALP and GGT levels. These findings indicate that benign metabolic and hepatobiliary conditions should be considered when interpreting increased CA 19-9 levels in clinical practice.
CA 19-9; Cholestasis; Diabetes Mellitus; Fatty Liver; Biomarkers, HbA1c
CA 19-9 articles; Cholestasis articles; Diabetes Mellitus articles; Fatty Liver articles; Biomarkers articles, HbA1c articles
Introduction
Carbohydrate antigen 19-9 (CA 19-9), also known as sialyl-Lewis A antigen, is one of the most widely utilized serum tumor markers in clinical practice. It is primarily employed in diagnosis, prognostic assessment, and therapeutic monitoring of pancreatic adenocarcinoma and various hepatobiliary malignancies [1]. Although CA 19-9 is commonly regarded as a malignancy-associated biomarker, increasing evidence indicates that elevated serum concentrations can occur in numerous non-malignant conditions, thereby limiting its specificity for cancer detection. Consequently, the interpretation of elevated CA 19-9 levels remains a significant clinical challenge, particularly in patients without radiological or histopathology evidence of malignancy [2] Beyond its association with cancer, elevated CA 19-9 levels have been reported in a broad spectrum of benign hepatobiliary, pancreatic, pulmonary, endocrine, and metabolic disorders. Among these, cholestatic liver diseases represent one of the most frequent causes of nonmalignant CA 19-9 elevation [3,4]. Conditions such as biliary obstruction, cholangitis, choledocholithiasis, and other cholestatic disorders may substantially increase serum CA 19-9 concentrations due to impaired biliary excretion and enhanced production by injured biliary epithelial cells [5]. Previous studies have demonstrated significant correlations between CA 19-9 and cholestatic biomarkers, including alkaline phosphatase (ALP), gamma-glutamyl transferase (GGT), and bilirubin levels, suggesting that cholestasis plays a crucial role in modulating serum CA 19-9 concentrations [6,7]. Recent investigations have also highlighted the potential influence of metabolic dysfunction on CA 19-9 levels. Metabolic conditions such as obesity, type 2 diabetes mellitus, insulin resistance, dyslipidemia, and metabolic dysfunction-associated fatty liver disease (MAFLD) are increasingly prevalent worldwide and are frequently accompanied by chronic low-grade inflammation and hepatocellular injury [8,9]. Emerging evidence suggests that these metabolic abnormalities may contribute to elevated serum CA 19-9 concentrations through mechanisms involving pancreatic β-cell dysfunction, systemic inflammation, oxidative stress, and altered hepatobiliary metabolism [10]. However, the magnitude and clinical significance of these associations remain incompletely understood, particularly in populations with a high burden of metabolic diseases. In developing countries such as Bangladesh, the prevalence of diabetes, obesity, fatty liver disease, and hepatobiliary disorders has risen considerably during recent decades. Consequently, elevated CA 19-9 levels are increasingly encountered in routine clinical practice, often prompting extensive investigations for suspected malignancy [11]. Despite this growing clinical concern, data regarding the relationship between metabolic abnormalities, cholestatic biomarkers, and serum CA 19-9 levels remain limited in South Asian populations [12]. A better understanding of these associations may improve the interpretation of CA 19-9 results and reduce unnecessary diagnostic procedures, healthcare costs, and patient anxiety. Therefore, the present study aimed to evaluate the metabolic and cholestatic factors associated with elevated serum CA 19-9 levels among adult patients attending a tertiary care cancer hospital in Dhaka, Bangladesh.
Materials and methods
This hospital-based cross-sectional analytical study was conducted at a tertiary care cancer hospital in Dhaka, Bangladesh, from April 2025 to December 2025. A total of 150 adult patients aged ≥18 years with elevated serum CA 19-9 levels (>37 U/mL) were enrolled using a consecutive sampling technique. Patients with incomplete laboratory records, severe acute illness, active infections, or insufficient clinical information were excluded from the study. Prior to data collection, formal permission was obtained from the hospital authority. Sociodemographic and clinical data were collected using a structured data collection form and were supplemented by information retrieved from hospital medical and laboratory records. Data collected included age, sex, diabetes status, obesity status, and relevant clinical history. Anthropometric measurements were recorded, and body mass index (BMI) was calculated as weight in kilograms divided by height in meters squared (kg/m²). The presence of fatty liver disease was determined based on ultrasonographic findings documented in patient records. Venous blood samples were collected and analyzed in the hospital laboratory following standard laboratory procedures. Serum CA 19-9 concentrations were measured using a chemiluminescent immunoassay (CLIA) method. Metabolic parameters assessed included fasting blood glucose (FBS), glycated hemoglobin (HbA1c), serum triglycerides, BMI, and fatty liver status. Cholestatic parameters included alkaline phosphatase (ALP), gamma glutamyl transferase (GGT), total bilirubin, and direct bilirubin levels. For comparative analysis, participants were categorized into two groups according to serum CA 19-9 levels: ≤100 U/mL and >100 U/mL. Associations between CA 19-9 levels and metabolic and cholestatic variables were subsequently evaluated. Data were analyzed using Statistical Package for the Social Sciences (SPSS) version 26.0 (IBM Corp., Armonk, NY, USA). Continuous variables were expressed as mean ± standard deviation, whereas categorical variables were presented as frequencies and percentages. Independent samples t-test, Pearson’s correlation analysis, and multivariable linear regression analysis were performed to identify factors associated with elevated serum CA 19-9 levels. A p-value of <0.05 was considered statistically significant. Confidentiality and anonymity of all patient information were maintained throughout the study.
Results
A total of 150 adult patients with elevated serum CA 19-9 levels (>37 U/mL) were included in the study. The mean serum CA 19-9 concentration was 96.4 ± 48.2 U/mL. Table 1 presents the baseline demographic and clinical characteristics of the study population. Most participants belonged to the 41–60 years age group (48.0%), followed by those aged 18–40 years (28.0%) and >60 years (24.0%). Male participants constituted 58.7% of the study population. Diabetes mellitus was present in 52.7% of participants, while fatty liver disease and obesity were observed in 38.7% and 30.7%, respectively.
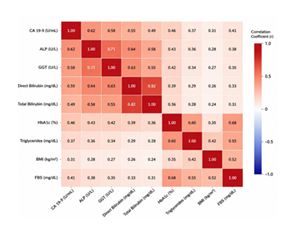
Figure 1: Correlation Heatmap of Serum CA 19-9 and Metabolic/Cholestatic Parameters Among Study Participants (n=150).
Figure 1 presents the correlation heatmap between serum CA 19-9 concentrations and selected metabolic and cholestatic biomarkers. Strong positive correlations were observed between CA 19-9 and cholestatic markers, particularly ALP (r = 0.62), GGT (r = 0.58), and direct bilirubin (r = 0.55). Moderate positive correlations were identified between CA 19-9 and HbA1c (r = 0.46) as well as triglyceride levels (r = 0.37), while a weaker but significant correlation was observed with BMI (r = 0.31). These findings suggest that cholestatic dysfunction and metabolic abnormalities are significantly associated with elevated serum CA 19-9 levels.
Table 1: Baseline Characteristics of the Study Participants (n = 150).
|
Variable |
Frequency (n) |
Percentage (%) |
|
Age Group (years) |
||
|
18–40 |
42 |
28 |
|
41–60 |
72 |
48 |
|
>60 |
36 |
24 |
|
Gender |
||
|
Male |
88 |
58.7 |
|
Female |
62 |
41.3 |
|
Clinical Characteristics |
||
|
Diabetes Mellitus |
79 |
52.7 |
|
Obesity |
46 |
30.7 |
|
Fatty Liver Disease |
58 |
38.7 |
|
Continuous Variable |
Mean ± SD |
|
|
Serum CA 19-9 (U/mL) |
96.4 ± 48.2 |
|
|
Total Sample Size (N) = 150. |
||
The comparison of metabolic parameters according to serum CA19-9 levels is shown in table 2. Participants with CA 19-9 levels >100 U/mL exhibited significantly higher BMI, fasting blood glucose, HbA1c, and triglyceride levels compared with those having CA 19-9 levels ≤100 U/mL. The strongest metabolic association was observed with HbA1c (p <0.001), indicating a significant relationship between poor glycemic control and elevated serum CA 19-9 concentrations.
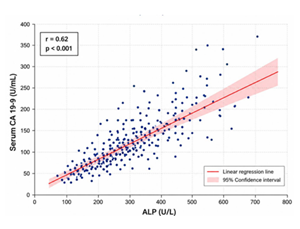
Figure 2: Scatter Plot Showing the Relationship Between Serum CA 19-9 and Alkaline Phosphatase (ALP) Levels Among Study Participants (n = 150).
As shown in Figure 2, serum CA 19-9 levels demonstrated a strong positive correlation with ALP concentrations (r = 0.62, p < 0.001). Higher ALP levels were associated with progressively increased serum CA 19-9 concentrations. The observed relationship supports the role of cholestatic dysfunction as a major contributor to elevated CA 19-9 levels and is consistent with the multivariable regression analysis, in which ALP emerged as the strongest independent predictor of elevated serum CA 19-9 concentrations.
Table 2: Comparison of Metabolic Parameters According to Serum CA 19-9 Levels.
|
Variable |
CA 19-9 ≤100 U/mL |
CA 19-9 >100 U/mL |
p-value |
|
BMI (kg/m²) |
25.8 ± 3.4 |
29.1 ± 4.2 |
0.002 |
|
FBS (mg/dL) |
142.5 ± 41.3 |
178.3 ± 58.4 |
0.001 |
|
HbA1c (%) |
7.1 ± 1.4 |
8.8 ± 1.9 |
<0.001 |
|
Triglycerides (mg/dL) |
189.4 ± 62.5 |
246.7 ± 82.6 |
0.003 |
As shown in Figure 2, serum CA 19-9 levels demonstrated a strong positive correlation with ALP concentrations (r = 0.62, p < 0.001). Higher ALP levels were associated with progressively increased serum CA 19-9 concentrations. The observed relationship supports the role of cholestatic dysfunction as a major contributor to elevated CA 19-9 levels and is consistent with the multivariable regression analysis, in which ALP emerged as the strongest independent predictor of elevated serum CA 19-9 concentrations. Multivariable linear regression analysis was subsequently conducted to identify independent predictors of elevated serum CA 19-9 levels. As presented in Table 5, ALP emerged as the strongest independent predictor, followed by GGT, direct bilirubin, and HbA1c. These findings indicate that both cholestatic dysfunction and metabolic dysregulation contribute independently to elevated serum CA 19-9 concentrations.
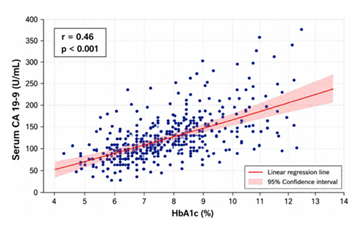
Figure 3: Scatter Plot Showing the Relationship Between Serum CA 19-9 and HbA1c Levels Among Study Participants (n = 150).
As shown in Figure 3, serum CA 19-9 levels demonstrated a significant moderate positive correlation with HbA1c values (r = 0.46, p < 0.001). Higher HbA1c levels were associated with increased serum CA 19-9 concentrations, suggesting that poor glycemic control may contribute to elevated CA 19-9 levels. These findings support the role of metabolic dysfunction in influencing serum CA 19-9 concentrations and are consistent with the multivariable regression analysis, in which HbA1c emerged as an independent predictor of elevated CA 19-9 levels.
Table 3: Comparison of Cholestatic Parameters According to Serum CA 19-9 Levels.
|
Variable |
CA 19-9 ≤100 U/mL |
CA 19-9 >100 U/mL |
p-value |
|
ALP (U/L) |
214.3 ± 92.6 |
375.7 ± 126.2 |
<0.001 |
|
GGT (U/L) |
98.2 ± 52.4 |
192.6 ± 81.5 |
<0.001 |
|
Total Bilirubin (mg/dL) |
1.5 ± 0.8 |
3.2 ± 1.6 |
<0.001 |
|
Direct Bilirubin (mg/dL) |
0.8 ± 0.5 |
1.7 ± 1.1 |
<0.001 |
Table 3 summarizes the comparison of cholestatic biomarkers according to serum CA 19-9 levels. Significantly elevated ALP, GGT, total bilirubin, and direct bilirubin levels were observed among patients with CA 19-9 concentrations >100 U/mL. ALP demonstrated the greatest difference between the two groups, suggesting a strong association between cholestatic liver dysfunction and elevated CA 19-9 levels.
Pearson correlation analysis was performed to evaluate the relationship between serum CA 19-9 concentrations and selected metabolic and cholestatic parameters. As shown in Table 4, serum CA 19-9 demonstrated significant positive correlations with ALP (r=0.62), GGT (r=0.58), direct bilirubin (r=0.55), HbA1c (r=0.46), triglycerides (r=0.37), and BMI (r=0.31) (all p <0.01). The strongest correlation was observed between CA 19-9 and ALP.
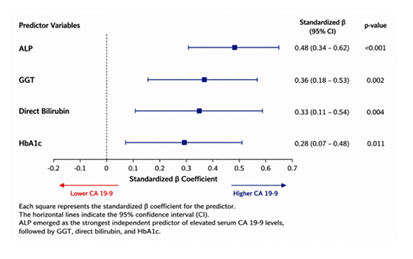
Figure 4: Forest Plot of Independent Predictors of Elevated Serum CA 19-9 Levels Identified by Multivariable Linear Regression Analysis.
Figure 4 illustrates the results of the multivariable linear regression analysis examining factors independently associated with elevated serum CA 19-9 levels. Among the variables included in the model, ALP demonstrated the strongest independent association with serum CA 19-9 concentrations (β = 0.48, p < 0.001). Significant positive. associations were also observed for GGT (β = 0.36, p = 0.002), direct bilirubin (β = 0.33, p = 0.004), and HbA1c (β = 0.28, p = 0.011). These findings indicate that both cholestatic dysfunction and metabolic dysregulation contribute independently to increased serum CA 19-9 levels, with cholestatic markers exerting the greatest influence. The prevalence of major metabolic and clinical abnormalities among study participants is presented in Table 6. Diabetes mellitus was the most common comorbidity, affecting more than half of the study population. Fatty liver disease and obesity were also frequently observed, supporting the role of metabolic dysfunction in patients with elevated CA 19-9 levels.
Table 4: Correlation Between Serum CA 19-9 Levels and Study Variables.
|
Variable |
Correlation Coefficient (r) |
p-value |
|
ALP |
0.62 |
<0.001 |
|
GGT |
0.58 |
<0.001 |
|
Direct Bilirubin |
0.55 |
<0.001 |
|
HbA1c |
0.46 |
<0.001 |
|
Triglycerides |
0.37 |
<0.001 |
|
BMI |
0.31 |
<0.001 |
Table 5: Multivariable Linear Regression Analysis for Predictors of Elevated Serum CA 19-9 Levels.
|
Predictor Variable |
Adjusted β |
p-value |
|
ALP |
0.48 |
<0.001 |
|
GGT |
0.36 |
0.002 |
|
Direct Bilirubin |
0.33 |
0.004 |
|
HbA1c |
0.28 |
0.011 |
Table 6: Prevalence of Clinical and Metabolic Abnormalities Among Study Participants.
|
Variable |
Frequency (%) |
|
Diabetes Mellitus |
79 (52.7) |
|
Fatty Liver Disease |
58 (38.7) |
|
Obesity |
46 (30.7) |
Discussion
The present study investigated the metabolic and cholestatic factors associated with elevated serum CA 19-9 levels among adult patients attending a tertiary care cancer hospital in Bangladesh. The findings demonstrated that elevated CA 19-9 levels were significantly associated with both metabolic abnormalities and cholestatic dysfunction. Notably, cholestatic biomarkers exhibited stronger associations with CA 19-9 concentrations than metabolic indicators, suggesting that hepatobiliary disturbances may play a dominant role in non-malignant elevations of this tumor marker. The study population was predominantly composed of middle-aged adults, with nearly half of the participants belonging to the 41-60-year age group and males accounting for 58.7% of the cohort. More than half of the participants had diabetes mellitus (52.7%), while fatty liver disease and obesity were observed in 38.7% and 30.7%, respectively. These findings indicate a substantial burden of metabolic disorders among individuals with elevated CA 19-9 levels and support the growing evidence linking metabolic dysfunction with alterations in tumor marker concentrations [12]. A significant association was observed between elevated CA 19-9 levels and metabolic parameters. Participants with CA 19-9 concentrations greater than 100 U/mL exhibited significantly higher HbA1c, fasting blood glucose, BMI, and triglyceride levels compared with those having lower CA 19-9 concentrations. Among these variables, HbA1c demonstrated the strongest relationship, showing both a significant correlation (r = 0.46, p < 0.001) and an independent association in the multivariable regression model (β = 0.28, p = 0.011). These findings suggest that poor glycemic control may contribute to increased CA 19-9 production or release through mechanisms involving chronic inflammation, oxidative stress, pancreatic β-cell dysfunction, and metabolic derangements. The observed relationship between CA 19-9 and obesity-related parameters further supports the hypothesis that metabolic syndrome and insulin resistance may influence circulating CA 19-9 concentrations [13]. The most prominent findings of the study were related to cholestatic biomarkers. Patients with higher CA 19-9 levels demonstrated markedly elevated ALP, GGT, total bilirubin, and direct bilirubin concentrations. Furthermore, ALP showed the strongest correlation with CA 19-9 levels (r = 0.62, p < 0.001), followed by GGT (r = 0.58, p < 0.001) and direct bilirubin (r = 0.55, p < 0.001). These observations suggest that cholestatic liver injury and impaired biliary excretion are major determinants of elevated CA 19-9 levels. Biliary epithelial cells are known to produce CA 19-9, and cholestasis may lead to increased synthesis and reduced clearance of the antigen, resulting in substantial elevations even in the absence of malignancy [14]. Multivariable regression analysis further confirmed the independent contribution of cholestatic dysfunction to elevated CA 19-9 concentrations. ALP emerged as the strongest independent predictor (β = 0.48, p < 0.001), followed by GGT (β = 0.36, p = 0.002) and direct bilirubin (β = 0.33, p = 0.004). The magnitude of these associations exceeded that observed for metabolic variables, indicating that cholestatic processes exert a greater influence on serum CA 19-9 levels than metabolic abnormalities alone. This finding has important clinical implications, as elevated CA 19-9 concentrations may be mistakenly interpreted as evidence of malignancy when underlying cholestatic disorders are present [15]. The correlation heatmap, scatter plot analyses, and regression findings consistently demonstrated that increasing ALP and HbA1c levels were accompanied by progressive increases in serum CA 19-9 concentrations. The concordance of results across multiple analytical approaches strengthens the validity of the observed associations and highlights the multifactorial determinants of CA 19-9 elevation in routine clinical practice. The findings of the present study are generally consistent with previous investigations that reported significant associations between CA 19-9 levels and hepatobiliary dysfunction, diabetes mellitus, obesity, and fatty liver disease. Similar studies have shown that cholestatic markers often exhibit stronger correlations with CA 19-9 than metabolic parameters, emphasizing the importance of considering benign hepatobiliary conditions when evaluating elevated CA 19-9 concentrations [16]. The present study extends these observations to a South Asian population and provides additional evidence supporting the role of both metabolic and cholestatic factors in influencing serum CA 19-9 levels [17].
Conclusion
Elevated serum CA 19-9 levels were significantly associated with both metabolic dysfunction and cholestatic abnormalities among adult patients. Although poor glycemic control, obesity, and hypertriglyceridemia were associated with increased CA 19-9 concentrations, cholestatic biomarkers demonstrated stronger correlations and independent predictive effects. ALP, GGT, direct bilirubin, and HbA1c emerged as significant determinants of elevated serum CA 19-9 levels. These findings highlight the importance of considering benign metabolic and hepatobiliary conditions during the interpretation of elevated CA 19-9 results, thereby reducing unnecessary investigations and improving clinical decision-making.
Limitations of the Study
Several limitations of this study should be acknowledged. First, the cross-sectional design limits the ability to establish causal relationships between metabolic and cholestatic abnormalities and elevated serum CA 19-9 levels. Second, the study was conducted at a single tertiary care cancer hospital, which may limit the generalizability of the findings to other healthcare settings and populations. Third, the sample size was relatively modest, and larger multicenter studies may provide more robust estimates of the observed associations. Fourth, the study relied on routinely collected clinical and laboratory data, and some potentially relevant variables that may influence CA 19-9 levels were not assessed. Finally, longitudinal follow-up was not performed; therefore, the temporal changes in CA 19-9 concentrations following improvement of metabolic or cholestatic abnormalities could not be evaluated.
Author Contributions
Conceptualization: Sujan Dash, M.M. Al-Shakib Rhidoy
Methodology: Sujan Dash, Md Musa Ali, M.M. Al-Shakib Rhidoy
Data Collection: Md. Anwer Hossain, Md. Mahedi Hasan Khan, Apurba Kumar Sarker, Foysal Ahmmed Roni
Formal Analysis: Foysal Ahmmed Roni, M.M. Al-Shakib Rhidoy, Mohammad Rakibul Islam Babu
Writing-Original Draft: Sujan Dash, Md Musa Ali, M.M. Al-Shakib Rhidoy
Writing-Review & Editing: Md. Anwer Hossain, Md. Mahedi Hasan Khan, Mohammad Rakibul Islam Babu, Apurba Kumar Sarker, Foysal Ahmmed Roni, M.M. Al-Shakib Rhidoy
All authors read and approved of the final manuscript.
References
- Lee T, Teng TZ, Shelat VG. Carbohydrate antigen 19-9 Tumor marker: Past, present, and future. World journal of gastrointestinal surgery 12 (2020): 468.
- Kim S, Park BK, Seo JH, et al. Carbohydrate antigen 19-9 elevation without evidence of malignant or pancreatobiliary diseases. Scientific reports 10 (2020): 8820.
- Meira-Júnior JD, Costa TN, Montagnini AL, et al. Elevated CA 19-9 in an asymptomatic patient: What does it mean?. ABCD. Arquivos Brasileiros de Cirurgia Digestiva (São Paulo) 16 (2022): e1687.
- Das SS, Hossain MS, Sultana A, et al. The influence of chronic kidney disease on hepatocellular carcinoma. Journal of Primeasia 6 (2025): 1-8.
- Ventrucci M, Pozzato P, Cipolla A, et al. Persistent elevation of serum CA 19-9 with no evidence of malignant disease. Digestive and Liver Disease 41 (2009): 357-363.
- Katsanos KH, Kitsanou M, Christodoulou DK, et al. High CA 19-9 levels in benign biliary tract diseases: report of four cases and review of the literature. European journal of internal medicine 13 (2002):132-135.
- Tsen A, Barbara M, Rosenkranz L. Dilemma of elevated CA 19-9 in biliary pathology. Pancreatology 18 (2018): 862-867.
- Abdul Razzaq, Mst Shahina Khatun, Md Shafiul Azam, et al. Association of Glycemic Status with Clinico- Biochemical Parameters and Serum Tumor Marker Profiles in Adult Patients: A Cross-Sectional Study. International Journal of Applied Biology and Pharmaceutical Technology 17 (2026): 01-09.
- Patel AH, Harnois DM, Klee GG, et al. The utility of CA 19-9 in the diagnoses of cholangiocarcinoma in patients without primary sclerosing cholangitis. The American journal of gastroenterology 95 (2000): 204-207.
- Wang X, Qi X, Li H, Shao X, et al. An extremely increased CA19-9 level due to common bile duct stone: a case report. AME Medical Journal 2 (2017).
- Binicier OB, Pakoz ZB. CA 19-9 levels in patients with acute pancreatitis due to gallstone and metabolic/toxic reasons. Revista da Associação Médica Brasileira 65 (2019): 965-970.
- Locker GY, Hamilton S, Harris J, et al. ASCO 2006 update of recommendations for the use of tumor markers in gastrointestinal cancer. Journal of clinical oncology 24 (2006): 5313-5327.
- Goonetilleke KS, Siriwardena AK. Systematic review of carbohydrate antigen (CA 19-9) as a biochemical marker in the diagnosis of pancreatic cancer. European Journal of Surgical Oncology (EJSO) 33 (2007): 266-270.
- Ballehaninna UK, Chamberlain RS. The clinical utility of serum CA 19-9 in the diagnosis, prognosis and management of pancreatic adenocarcinoma: An evidence-based appraisal. Journal of gastrointestinal oncology 3 (2012):105.
- Hong S, Song KB, Hwang DW, et al. Preoperative serum carbohydrate antigen 19-9 levels predict early recurrence after the resection of early-stage pancreatic ductal adenocarcinoma. World Journal of Gastrointestinal Surgery 13 (2021): 1423.
- Purkayastha K, Dhar R, Pethusamy K, et al. The issues and challenges with cancer biomarkers. Journal of cancer research and therapeutics 19 (2023): S20-S35.
- Chanu TM, Kma L, Sharan RN. Cancer biomarkers: status and its future direction. Indian Journal of Surgery 85 (2023): 1323-1335.