Tamer Samir Ahmed abdelhamid Elsalamouni1,*, Ahmed Raafat Abdelmoneim Ahmed2, FAHAD abdulaziz al-muhanna3, Mohamed A Sobh4
1Nephrologist at King fahd hospital of university, Imam abdulrahman bin faisal university Saudi Arabia
2Assitant professor Nephrology unit, Mansoura University, faculty of medicine, Egypt
3Professor and Consultant Internist Nephrologist, Imam Abdulrahman Bin Faisal University. Dammam Saudi Arabia, prof. fahad abdulaziz al-muhanna
4Professor of internal medicine and nephrology, Mansoura Urology and Nephrology Center, Mansoura University, Egypt
Corresponding Author: Tamer Samir Ahmed abdelhamid Elsalamouni, Nephrologist at King fahd hospital of university, Imam abdulrahman bin faisal university Saudi Arabia
Received: 12 March 2026; Accepted: 20 March 2026; Published: 26 June 2026
DOI: 10.26502/anu.2644-2833112
ShareBackground: Chronic kidney disease (CKD) and hemodialysis (HD) are associated with significant alterations in gut microbiota composition, contributing to systemic inflammation and uremic toxin accumulation.
Objective: To compare the gut microbiota composition between end-stage renal disease (ESRD) patients undergoing hemodialysis and healthy controls from the same geographic region.
Methods: Fecal samples were collected from 50 hemodialysis patients and 50 healthy controls at King Fahd Hospital of the University, Al-Khobar, Saudi Arabia (2021–2024). Whole-genome metagenomic sequencing of the 16S rRNA gene was performed to characterize microbial communities.
Results: Significant differences in gut microbial composition were observed. HD patients showed enrichment of Firmicutes, Bacteroidetes, and Proteobacteria, with increased abundance of Lactococcus, Lachnoclostridium, and Actinobacteria, and depletion of Spirosoma, Sphingobacterium, Runella, Prevotella, and Polaribacter. Alpha diversity was preserved across all indices (Chao1, observed species, Shannon, Gini-Simpson). Beta diversity demonstrated substantial compositional shifts (R²Y = 0.562, Q² = 0.405), indicating significant dysbiosis.
Conclusion: Hemodialysis patients exhibit significant gut microbiota dysbiosis with increased pathogenic bacteria (Klebsiella, Escherichia, Clostridium difficile, Veillonella) and decreased beneficial bacteria (Bifidobacterium and Lactobacillus strains). These findings underscore the need for personalized gut-targeted interventions to improve HD clinical outcomes.
Gut Microbiota;Chronic Kidney Disease; Hemodialysis; Dysbiosis;16S Rrna Sequencing
Gut Microbiota articles;Chronic Kidney Disease articles; Hemodialysis articles; Dysbiosis articles;16S Rrna Sequencing articles
Introduction
The human gut contains trillions of microorganisms predominantly from five phyla: Firmicutes, Bacteroidetes, Actinobacteria, Proteobacteria, and Verrucomicrobia, each with distinct roles in digestion and health maintenance [1]. The Firmicutes/Bacteroidetes (F/B) ratio is crucial for intestinal homeostasis; deviations are linked to obesity, inflammatory bowel disease, and CKD-related complications such as hypertension [2-4]. A high-fiber diet can improve this ratio and kidney function by promoting beneficial bacteria [5]. CKD leads to altered gut microbiota, increased intestinal permeability, and accumulation of endotoxins like lipopolysaccharides, contributing to systemic inflammation, oxidative stress, and cardiovascular disease risk [6–10]. Metabolites such as indoxyl sulfate and p-cresyl sulfate produced by diverse gut bacteria accumulate in CKD and HD, causing tubular damage, inflammation, fibrosis, and impaired glomerular filtration through multiple molecular pathways [11-14]. Other metabolites, including indole acetic acid and kynurenines, derived from aromatic amino acid metabolism by gut microbes, are linked to inflammation, oxidative stress, and immune activation in CKD and HD patients [12-15].
Study Rationale
Despite growing recognition of the gut-kidney axis in CKD pathophysiology, comprehensive characterization of gut microbiota in hemodialysis patients remains limited, particularly in Middle Eastern populations. This study aims to provide detailed metagenomic analysis comparing gut microbiota composition between ESRD patients on hemodialysis and healthy controls, with the goal of identifying specific microbial signatures that may inform future therapeutic interventions.
Materials and Methods
Study Population and Design
This cross-sectional study was conducted at King Fahd Hospital of the University, Al-Khobar, Saudi Arabia, between 2021 and 2024. The hemodialysis group (n = 50) comprised ESRD patients receiving maintenance hemodialysis three times weekly; the control group (n = 50) consisted of healthy individuals with normal kidney function matched for geographic location. All participants provided informed consent, and the study was approved by the institutional ethics committee. Exclusion criteria included antibiotic use within 4 weeks prior to sample collection, active gastrointestinal disease, and inflammatory bowel disease.
Clinical Data Collection
Comprehensive clinical and biochemical data were collected, including demographics (age, sex, BMI); kidney function markers (BUN, creatinine, uric acid); nutritional markers (albumin); haematological parameters (hemoglobin, ferritin); metabolic parameters (fasting glucose, Na, K, HCO₃); mineral metabolism (calcium, phosphorus, Ca×P product, iPTH, ALP); liver function (SGPT, SGOT); other laboratory values (ammonia, lactic acid, LDH); and dialysis duration (months).
Sample Collection and Processing
Fresh fecal samples were collected using sterile kits and stored at −80°C. Bacterial DNA was extracted from 200 mg stool using the QIAamp Fast DNA Stool Mini Kit (QIAGEN, Germany) following the manufacturer’s protocol, including InhibitEX buffer for PCR inhibitor removal, 95°C lysis, Proteinase K digestion (70°C), centrifugation at 14,000 rpm, AL/AW1/AW2 buffer purification, and final elution stored at −30 to −15°C.
16S rRNA Gene Amplification and Sequencing PCR Amplification
V1–V9 hypervariable regions were amplified with Illumina adapter overhangs in 25 μL reactions (1× PCR buffer, 2.5 mM MgCl₂, 0.2 mM dNTPs, 0.2 μM primers, 1 U Taq polymerase, 10 ng DNA). Thermal cycling: 95°C/3 min initial denaturation; 30 cycles of 95°C/30 s, 55°C/30 s, 72°C/1 min; final extension 72°C/5 min. Amplicons were verified on 1.5% agarose gels.
Library Preparation and Sequencing
The Swift Amplicon 16s+Its Panel with five overlapping primer pairs (V1–V9) was used. SNAP Combinatorial Dual Indexes enabled multiplexing; Swift Normalase provided enzymatic normalization. Libraries (avg. 620 bp) were diluted to 2.5 nM, pooled equimolarly, and sequenced on Illumina NovaSeq 6000 (250 bp paired-end).
Bioinformatics and Statistical Analysi
Raw sequences were demultiplexed with bcl2fastq2 v2.20 and Seqtk. Quality filtering used Deblur (chimera removal) and VSEARCH (paired-end joining). OTUs were clustered against Greengenes 13_8 using closed-reference clustering; taxonomy was assigned with a pre-trained Naïve Bayes classifier. Data were combined into a Phyloseq object (R 4.1.1), normalized with DADA2, and differential abundance tested with DESeq2 (v1.32.0). Alpha diversity was assessed using Chao1, observed species, Shannon, and Gini-Simpson indices. Beta diversity was evaluated with weighted/unweighted UniFrac distances and OPLS-DA (R²Y and Q² statistics).
Results
Table 1: Clinical and biochemical characteristics of hemodialysis patients and healthy controls.
|
Variable |
Control (n = 50) |
HD (n = 50) |
t-statistic / χ² |
p-value |
Sig. |
|
Gender (F/M) |
28/22 |
24/26 |
χ² = 0.641 |
0.4233 |
ns |
|
Age (years) |
54.5 ± 12.3 |
60.4 ± 10.3 |
t = −2.600 |
0.0108 |
* |
|
BMI (kg/m²) |
28.4 ± 2.0 |
30.2 ± 2.8 |
t = −3.699 |
< 0.001 |
*** |
|
BUN (mg/dL) |
14.6 ± 4.4 |
68.9 ± 11.4 |
t = −31.421 |
< 0.001 |
*** |
|
Creatinine (mg/dL) |
0.9 ± 0.2 |
9.8 ± 4.2 |
t = −14.967 |
< 0.001 |
*** |
|
Uric acid (mg/dL) |
4.1 ± 1.1 |
7.2 ± 0.9 |
t = −15.423 |
< 0.001 |
*** |
|
Albumin (g/dL) |
4.5 ± 0.9 |
3.7 ± 0.3 |
t = 5.963 |
< 0.001 |
*** |
|
SGPT (U/L) |
30.7 ± 8.2 |
33.3 ± 10.4 |
t = −1.388 |
0.1684 |
ns |
|
SGOT (U/L) |
24.2 ± 7.3 |
28.5 ± 9.2 |
t = −2.589 |
0.0112 |
* |
|
LDH (U/L) |
160 ± 12.4 |
158 ± 13.4 |
t = 0.775 |
0.4404 |
ns |
|
ALP (U/L) |
106 ± 45.8 |
112.4 ± 68.5 |
t = −0.549 |
0.5843 |
ns |
|
Sodium (mEq/L) |
137 ± 2.7 |
138.1 ± 3.3 |
t = −1.824 |
0.0713 |
ns |
|
Potassium (mEq/L) |
4.6 ± 0.4 |
4.5 ± 0.3 |
t = 1.414 |
0.1607 |
ns |
|
HCO₃ (mEq/L) |
24.8 ± 2.5 |
24.5 ± 2.1 |
t = 0.650 |
0.5174 |
ns |
|
Ammonia (µmol/L) |
24.8 ± 7.5 |
25.7 ± 10.4 |
t = −0.496 |
0.6209 |
ns |
|
Lactic acid (mmol/L) |
1.1 ± 0.3 |
1.2 ± 0.5 |
t = −1.213 |
0.2288 |
ns |
|
Calcium (mg/dL) |
9.1 ± 0.3 |
9.1 ± 1.3 |
t = 0.000 |
1 |
ns |
|
Phosphorus (mg/dL) |
3.8 ± 1.3 |
6.9 ± 2.1 |
t = −8.875 |
< 0.001 |
*** |
|
Ca × P product |
30.3 ± 2.2 |
60.6 ± 8.7 |
t = −23.875 |
< 0.001 |
*** |
|
iPTH (pg/mL) |
28.5 ± 7.0 |
682.9 ± 201.4 |
t = −22.962 |
< 0.001 |
*** |
|
Ferritin (ng/mL) |
256 ± 55.6 |
263.7 ± 71.1 |
t = −0.603 |
0.5478 |
ns |
|
Hemoglobin (g/dL) |
14.5 ± 2.0 |
9.4 ± 1.2 |
t = 15.462 |
< 0.001 |
*** |
|
Fasting glucose (mg/dL) |
140.5 ± 22.4 |
149.2 ± 22.1 |
t = −1.955 |
0.0534 |
ns |
|
Dialysis duration (months) |
— |
61.7 ± 19.3 |
— |
— |
— |
Abbreviations: HD, hemodialysis; BMI, body mass index; BUN, blood urea nitrogen; ALP, alkaline phosphatase; iPTH, intact parathyroid hormone; ns, not significant. Significance: * p < 0.05; ** p < 0.01; *** p < 0.001.
Alpha Diversity
No statistically significant differences were observed between HD patients and healthy controls across all alpha diversity metrics (Chao1, observed species, Shannon, and Gini-Simpson indices), indicating that microbial richness and evenness are preserved in HD patients relative to controls (Figure 1).
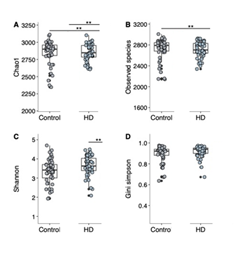
Figure 1: Alpha diversity analysis comparing hemodialysis (HD) patients and controls across four metrics: (A) Chao1 species richness, (B) observed species count, (C) Shannon diversity index, and (D) Gini-Simpson index. ** p < 0.01; ns, not significant.
Beta Diversity
Beta diversity analysis using OPLS-DA demonstrated substantial compositional differences between groups. HD patients exhibited marked deviation from healthy controls, with model parameters R²Y = 0.562 and Q² = 0.405 (p < 0.001), indicating significant dysbiosis despite preserved alpha diversity (Figure 2; Table 2).
Table 2: OPLS-DA model performance parameters comparing control and HD groups.
|
Group 1 |
Group 2 |
R²Y |
Q² |
|
Control |
HD |
0.562 |
0.405 |
R²Y, explained variance; Q², cross-validated predictive ability. Higher values indicate greater group separation
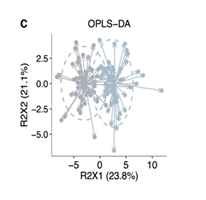
Figure 2: Beta diversity OPLS-DA plot demonstrating clear separation between control and HD groups. R2X1 (23.8%) and R2X2 (21.1%) represent variance explained by components 1 and 2, respectively.
Phylum-Level Changes
HD patients showed enrichment of Firmicutes and Actinobacteria with pronounced depletion of Bacteroidetes. Increased abundance was observed within Firmicutes (Lactococcus, Lachnoclostridium) and Actinobacteria. Beneficial Bacteroidetes genera significantly downregulated in HD included Spirosoma, Sphingobacterium, Runella, Prevotella, and Polaribacter.
Species-Level Analysis
Detailed species-level compositional differences are visualized in the heatmap (Figure 3). Species are grouped by relative abundance category and phylum affiliation.
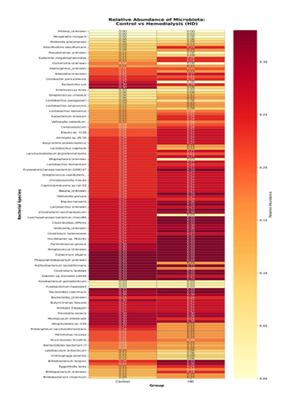
Figure 3: Heatmap showing relative abundance of bacterial species at genus/species level comparing control and HD groups. Color scale (yellow to dark red) represents normalized relative abundance values (0.00–0.33).
Species Enriched in the Control Group
The control group showed higher abundance of several beneficial bacteria. Bifidobacterium longum showed marked reduction in HD patients, dropping from moderate to very low abundance. Bacteroides caecimuis and Muribaculum intestinale were substantially more abundant in controls. Within Lactobacillus, both L. paracasei and L. salivarius showed higher control abundance. Clostridium saccharolyticum, Lachnoclostridium phytofermentans, Prevotella eroeca, Alistipes megaguti, Parabacteroides bacterium cf., Chitinophaga pinensis, and Pseudomonas urinown were also enriched in controls.
Species Enriched in the HD Group
Within Proteobacteria, K. oxytoca showed dramatic elevation, and Escherichia coli reached maximum abundance in HD. Among Firmicutes, L. amylovorus, L. vaginalis, L. phytofermentans, Veillonella rodentium, V. parvula, V. Unknown (reaching maximum abundance), Clostridium difficile, and multiple Blautia species (B. sp. YL58, B. hansenii) were enriched. Eggerthella lenta (Actinobacteria) showed significant HD elevation.
Summary of Dysbiotic Pattern
The microbiota alterations in HD patients were characterized by: (1) pathogenic enrichment — increased Proteobacteria (Klebsiella, Escherichia) and pathogenic Firmicutes (C. difficile, Veillonella); (2) loss of beneficial bacteria — decreased Bifidobacterium spp. and certain Lactobacillus strains; (3) maintained diversity but altered composition — alpha diversity preserved while beta diversity revealed profound compositional shifts; and (4) clinical correlation with known HD complications including cardiovascular risk, mineral-bone disorder, anemia, and infection susceptibility.
Discussion
This comprehensive metagenomic analysis reveals distinct gut microbiota alterations in hemodialysis patients that both challenge and extend current concepts of the gut–kidney axis. Contrary to many prior studies, alpha diversity was preserved in HD patients compared with healthy controls, indicating that microbial richness and evenness are not universally reduced in advanced kidney disease. In contrast, beta diversity demonstrated profound compositional disruption, with HD patients showing the greatest deviation from controls (R²Y = 0.562, p < 0.001), highlighting marked community restructuring rather than diversity loss. These findings contrast with reports by Lun et al. [16] and Yasuno et al. [17], who observed significantly reduced Shannon and Simpson indices in dialysis cohorts. However, our results align with Kim et al. [18], who found no significant alpha diversity differences in a larger HD cohort. Our beta diversity findings are consistent with previous studies showing clear clustering differences using PCA, NMDS, and PCoA approaches [16-18], and support the concept of progressive compositional shifts along the CKD continuum [17]. Dialysis modality and intensity may further influence microbial composition [19,20]. At the taxonomic level, HD patients demonstrated enrichment of Firmicutes and Actinobacteria with pronounced depletion of Bacteroidetes. Increased Clostridium, Streptococcus, and Firmicutes taxa corroborate Wong et al. [21] and Gryp et al. [22]. Elevated Lactobacillus aligns with Gryp et al. [22], and Actinobacteria enrichment (Actinomyces, Paenibacillus) parallels Wong et al. [21]. However, increased Blautia and Lachnoclostridium contrasts with Yasuno et al. [17], who reported depletion of butyrate-producing genera. The 12.5-fold reduction in Escherichia is the most striking discrepancy, opposing consistent enrichment reports [19-25], possibly reflecting cohort demographics, antibiotic exposure, or analytical resolution differences. Notably, this study identifies previously underreported features of the HD microbiome. The extensive depletion of diverse Bacteroidetes genera — beyond the commonly reported Prevotella — suggests a broader ecological collapse within this phylum. Additionally, reductions in opportunistic pathogens such as Myroides and Elizabethkingia highlight the advantage of deeper taxonomic profiling over conventional 16S-based approaches. At the phylum level, enrichment of Firmicutes and Actinobacteria with depletion of Bacteroidetes contrasts with Lun et al. [16], who reported increased Bacteroidetes and Proteobacteria in CKD and hemodialysis patients. This discrepancy likely reflects differences between CKD populations and patients undergoing long-term hemodialysis, suggesting dialysis imposes distinct selective pressures on the gut ecosystem. Overall, our findings corroborate prior evidence of profound dysbiosis in HD patients while emphasizing that this dysbiosis is driven primarily by community restructuring rather than loss of diversity. The dysbiotic signature comprises: (1) enrichment of potentially pathogenic bacteria within Proteobacteria (Klebsiella pneumoniae, K. oxytoca, Escherichia coli) and certain Firmicutes (Clostridium difficile, Veillonella species); (2) depletion of beneficial commensals, including Bifidobacterium species (especially B. longum) and certain Lactobacillus strains; and (3) increased opportunistic pathogens contributing to uremic toxin production and systemic inflammation. The observed divergences across taxa underscore the heterogeneity of microbiome alterations in dialysis cohorts and highlight the importance of high-resolution taxonomic analysis. Several limitations should be acknowledged. First, this cross-sectional design precludes causal inference; longitudinal studies are needed to determine whether dysbiosis antecedes or results from HD initiation. Second, dietary intake data were not systematically collected, representing a significant potential confounder of microbial composition. Third, although antibiotic use within 4 weeks was an exclusion criterion, more distant antibiotic exposure and other medication effects (phosphate binders, proton pump inhibitors) were not fully controlled for. Fourth, the study was conducted at a single center in Eastern Saudi Arabia, limiting the generalizability of findings to other populations. Finally, functional metagenomic profiling (e.g., shotgun sequencing) would provide complementary information on metabolic pathway activities that 16S rRNA sequencing alone cannot capture.
Acknowledgment
The authors would like to thank all individuals who contributed to the completion of this study. We are grateful to the laboratory staff, Hemodialysis nurses and colleagues who assisted in data collection and technical support. We also appreciate the valuable cooperation of all participants involved in this research.
Conflict of Interest
The authors declare that they have no conflict of interest.
References
- Qin J, Li R, Raes J, et al. A human gut microbial gene catalogue established by metagenomic sequencing. Nature 464 (2010): 59-65.
- Ley RE, Turnbaugh PJ, Klein S, et al. Microbial ecology: human gut microbes associated with obesity. Proc Natl Acad Sci U S A 103 (2006): 7004-7009.
- Turnbaugh PJ, Ley RE, Mahowald MA, et al. An obesity-associated gut microbiome with increased capacity for energy harvest. Nature 444 (2006): 1027-1031.
- Yang T, Richards EM, Pepine CJ, et al. The gut microbiota and the brain–gut–kidney axis in hypertension and chronic kidney disease. Nat Rev Nephrol 14 (2018): 442-456.
- Rossi M, Johnson DW, Xu H, et al. Dietary protein-fiber ratio associates with circulating levels of indoxyl sulfate and p-cresyl sulfate in chronic kidney disease patients. Nutr Metab Cardiovasc Dis 25 (2015): 860-865.
- Ramezani A, Raj DS. The gut microbiome, kidney disease, and targeted interventions. J Am Soc Nephrol 25 (2014): 657-670.
- Hobby GP, Karaduta O, Dusio GF, et al. Singh M, Zybailov BL, Arthur JM. Chronic kidney disease and the gut microbiome. Am J Physiol Renal Physiol 316 (2019): F1211-1217.
- Guldris SC, González Parra E, Cases Amenós A. Gut microbiota in chronic kidney disease. Nefrologia 37 (2017): 9-19.
- Voroneanu L, Burlacu A, Brinza C, et al. Gut microbiota in chronic kidney disease: from composition to modulation towards better outcomes — a systematic review. J Clin Med 12 (2023): 1948.
- Vaziri ND, Wong J, Pahl M, et al. chronic kidney disease alters intestinal microbial flora. Kidney Int 83 (2013): 308-315.
- Vanholder R, Schepers E, Pletinck A, et al. Nagler EV, Glorieux G. The uremic toxicity of indoxyl sulfate and p-cresyl sulfate: a systematic review. J Am Soc Nephrol 25 (2014): 1897-907.
- Meijers BK, Evenepoel P. The gut-kidney axis: indoxyl sulfate, p-cresyl sulfate and CKD progression. Kidney Int 80 (2011): 1144-5.
- Wu IW, Hsu KH, Lee CC, et al. Serum free p-cresyl sulfate levels predict cardiovascular and all-cause mortality in elderly hemodialysis patients. Kidney Int 82 (2012): 760-7.
- Ramezani A, Massy ZA, Meijers B, et al. Evenepoel P, Vanholder R, Raj DS. Role of the gut microbiome in uremia: a potential therapeutic target. Am J Kidney Dis 67 (2016): 483-98.
- Liabeuf S, Lenglet A, Desjardins L, et al. Plasma indole acetic acid and cardiovascular events in chronic kidney disease. Clin J Am Soc Nephrol 12 (2017): 1721-1730.
- Lun H, Yang W, Zhao S, et al. Altered gut microbiota and microbial biomarkers associated with chronic kidney disease. Microbiologyopen 8 (2019): e00678.
- Yasuno T, Takahashi K, Tada K, et al. Dysbiosis of gut microbiota in patients with chronic kidney disease. Intern Med 63 (2024): 347-352.
- Kim JE, Kim HE, Park JI, et al. The association between gut microbiota and uremia of chronic kidney disease. Microorganisms 8 (2020): 907.
- Zhang F, Luo W, Shi Y, et al. Effect of different hemodialysis methods on microbiota in uremic patients. Biomed Res Int (2020): 6739762.
- He H, Xie Y. Alteration of intestinal microflora in uremia patients with or without blood purification. Niger J Clin Pract 24 (2021): 1133-1137.
- Wong J, Piceno YM, DeSantis TZ, et al. Expansion of urease- and uricase-containing, indole- and p-cresol-forming and contraction of short-chain fatty acid-producing intestinal microbiota in ESRD. Am J Nephrol 39 (2014): 230-237.
- Gryp T, Huys GRB, Joossens M, et al. Isolation and quantification of uremic toxin precursor-generating gut bacteria in chronic kidney disease patients. Int J Mol Sci 21 (2020): 1986.
- Lazarevic V, Teta D, Pruijm M, et al. Gut microbiota associations with chronic kidney disease: insights into nutritional and inflammatory parameters. Front Microbiol 15 (2024): 1298432.
- Vaziri ND, Wong J, Pahl M, et al. chronic kidney disease alters intestinal microbial flora. Kidney Int 83 (2013): 308-315.
- Zhang X, Wang Y, Yin Y, et al. Changes of gut microbiota in maintenance hemodialysis patients and their impact on patient’s microinflammation status. Cell Mol Biol 69 (2023): 96-101.