Mohammad Monzurul Alam Bhuiyan1*, Sanjida Sultana2, Shaila Yesmin1, Amit Kumar Pramanik3, Amanat Hasan4, Syed Md. Jabed5, Debatosh Paul1, Tuhin Sultana1.
1Department of Laboratory Medicine, Bangabandhu Sheikh Mujib Medical University (BSMMU), Dhaka, Bangladesh
2Ark Hospital Ltd. Dakkhinkhan, Uttara, Dhaka, Bangladesh
3Department of Transfusion Medicine, Rajshahi Medical College Hospital, Rajshahi, Bangladesh
4National Institute of Cardiovascular Disease, Dhaka, Bangladesh
5Department of Medicine, Institute of Applied Health Science, Foys Lake, Chattagram, Bangladesh
*Corresponding author: Mohammad Monzurul Alam Bhuiyan, Department of Laboratory Medicine, Bangabandhu Sheikh Mujib Medical University (BSMMU), Dhaka, Bangladesh.
Received: 13 March 2022; Accepted: 29 March 2022; Published: 12 April 2022
Neutrophil Lymphocyte Ratio (NLR) is the sign of balance between neutrophil lymphocyte levels in the body and an indicator of systemic inflammation. NLR is a new predictor for cardiovascular risk and mortality. This study aims to assess the Neutrophil Lymphocyte Ratio (NLR) as a useful indicator for coronary artery disease (CAD). This case control study was conducted in the Department of Clinical pathology in collaboration with Department of Cardiology, Bangabandhu Sheikh Mujib Medical University (BSMMU), Dhaka, Bangladesh from March 2014 to February 2015. Total 134 patients were enrolled in this study who were waiting for further percutaneous coronary intervention (PCI) in the Department of Cardiology, BSMMU; 84 cases were considered as Group I (Patients with CAD) and 50 controls were Group II (Patients without CAD). A 2 ml of blood was collected in EDTA tube from the patients prior to PCI for complete blood count (CBC) were measured by haematology autoanalyzer, rechecked manually and NLR was calculated in the Department of Clinical Pathology, BSMMU. NLR was higher in Patients with CAD group compared to Patients without CAD (2.76 (±0.74) vs 1.56 (±0.15), p<0.001). NLR may be a useful marker to predict the presence of CAD.
Atherosclerosis; Coronary artery disease; Indicator; Neutrophil lymphocyte ratio
Atherosclerosis articles; Coronary artery disease articles; Indicator articles; Neutrophil lymphocyte ratio articles
1. Introduction
Coronary Artery Disease (CAD) is an important public health concern worldwide and is the leading cause of morbidity and mortality. Atherosclerosis is a common cause of Cardiovascular Disease (CVD). Several mechanisms are likely to contribute to the accelerated atherosclerosis and increased Chronic Heart Disease (CHD) risk in patients. Important factors of premature coronary atherosclerosis include dyslipidemia, hypertension, hypercoagulability, poor glycemic control, smoking, obesity and lack of physical activity [1]. Inflammation plays a major role in all stage of atherogenesis and participates in the local, myocardial and systemic complications of atherosclerosis [2]. The relationship between various inflammatory markers and Coronary Artery Disease (CAD) has been established [3]. Among these markers, the levels of White Blood Cell (WBC) subtypes confirmed inflammatory markers that play a crucial role in the pathogenesis of atherogenesis and atherothrombosis, have received significant attention [4]. It has been established that the WBC count and levels of WBC subtypes not only play an important role in the development of CAD, but can also be used to predict the clinical outcomes of patients with CAD [5]. Neutrophil Lymphocyte Ratio (NLR) is the sign of balance between neutrophil lymphocyte levels in the body and an indicator of systemic inflammation [6]. NLR is a new indicator for cardiovascular risk and mortality and by which we can predict the risk of coronary artery disease [7]. This study aimed to investigate relationship between NLR and angiography proven CAD.
2. Materials and Methods
This case control study was conducted at the Department of Clinical pathology with the Department of Cardiology, Bangabandhu Sheikh Mujib Medical University (BSMMU), Dhaka, Bangladesh from March, 2014 to February, 2015.Total 134 patients were enrolled in this study. Among them, 84 patients with 50% coronary artery stenosis and more critical lesion who were diagnosed by Percutaneous Coronary Intervention (PCI) were considered as Group I (Patients with CAD) and50 patients with less than 50% coronary artery stenosis who were diagnosed by percutaneous coronary intervention (PCI) were considered as Group II (Patients without CAD). Recurrent myocardial infarction, patients with congenital cardiac disease such as shunt or vascular anomalies, pulmonary hypertension (both primary or secondary), acute or chronic infectious diseases, uncontrolled hypertension, known case of patients with cerebrovascular diseases, patients with documented malignancy, hematological disorders, patients with hepatic and renal impairment were excluded from the study. After selection, all the patients were thoroughly informed about the aims, objectives and procedure of the study and were encouraged for their voluntary participation. Then an informed written consent was taken from each subject. A detail personal, medical, occupational, educational and smoking history were recorded in a preformed data schedule and thorough physical examinations were done and documented. In this study patient’s complete blood counts were measured by haematology auto analyzer (SYSMEX 4000i), rechecked manually and NLR was calculated in the Department of Clinical Pathology, BSMMU. Laboratory investigations were done in Department of Clinical Pathology: CBC with PBF including differential count of WBC and neutrophil lymphocyte ratio (NLR). Serum lipid profile reports were collected from patient’s file.
3. Results
Out of total 134 patients, 84 cases were considered as Group I (patients with CAD) and 50 controls were Group II (patients without CAD). The mean age of the patients with CAD (Group I) was 54.73±8.94 years, the mean age of the patients without CAD (Group II) was 53.10±9.47 years (Table 1).
|
Study group |
|||
|
Group-I (n=84) |
Group-II (n=50) |
Total |
|
|
n(%) |
n(%) |
||
|
31-40 years |
06(7.1) |
04(8.0) |
10 |
|
41-50 years |
28(33.3) |
22(44.0) |
50 |
|
51-60 years |
34(40.5) |
13(26.0) |
47 |
|
61-70 years |
14(16.7) |
09(18.0) |
23 |
|
>70 years |
02(2.4) |
02(04.0) |
4 |
|
Total |
84(100) |
50(100) |
134 |
|
Mean ±SD |
54.73(±8.94) |
53.10(±9.47) |
Range 35-79 years |
|
p-value <0.05 was significant, Data were presented as mean ±SD for continuous variables. |
|||
Table 1: Age distribution of the study population (N=134).
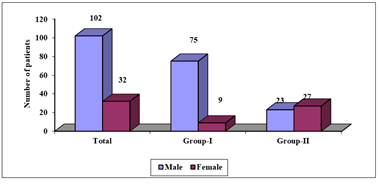
Figure 1: Sex distribution of the study population (N=134).
Figure 1 shows sex distribution of the study population. It was observed that in Group I (patients with CAD) 75 (89.28%) patients were male and 9 (10.71%) patients were found female. In Group II (patients without CAD) 23 (46%) patients were male and 27 (54%) patients were female. Overall, Male female ratio was 3.18:1 which was statistically highly significant (p<0.001).
Table 2 showing there was significant difference in Lipid profile between Group-I and Group-II (all p<0.001).
|
Lipid profile |
Group I |
Group II |
P value* |
|
(n=84) |
(n=50) |
||
|
TC (mg/dl) |
187.75 (±39.16) |
150.0 (±17.87) |
<0.001 |
|
HDL (mg/dl) |
30.61 (±6.12) |
44.22 (±11.55) |
<0.001 |
|
LDL (mg/dl) |
108.77 (±17.83) |
83.20(±10.02) |
<0.001 |
|
TG (mg/dl) |
179.35 (±19.60) |
142.02(±17.65) |
<0.001 |
|
TC=Total cholesterol, HDL=High density lipoprotein, LDL=Low density lipoprotein, TG= Triglyceride. Unpaired sample t test was done to measure level of significance. |
|||
Table 2: Mean difference between Group-I and Group-II with Lipid profile (N=134).
Table 3 showing mean NLR were 2.76 (±0.74) in Group-I and 1.56 (±0.15) in Group-II which was statistically highly significant (p<0.001). In Group-I, NLR was more than the calculated cut off value. The range of NLR in Group-I was 2.0-7.0 and the range of NLR in Group-II was 1.23-1.74.
|
Group-I |
Group-II |
P value* |
|
|
Mean ±SD |
Mean ±SD |
||
|
NLR (Ratio) |
2.76 (±0.74) |
1.56 (±0.15) |
<0.001 |
|
Range (min-max) |
2.0-7.0 |
1.23-1.74 |
|
|
Unpaired sample t test was done to measure level of significance. Cut off value of NLR was 1.74. |
|||
Table 3: Mean NLR difference between Group-I and Group-II (N=134).
Determination of sensitivity and specificity of neutrophil lymphocyte ratio and Group-I (Patients with CAD) by ROC curve which is shown in Figure 2 and Table 4. Receiver-operator characteristic (ROC) curves of NLR also determines about prediction of Coronary Artery Disease (CAD). The test result variable(s): NLR (0.968) has at least one tie between the positive actual state group and the negative actual state group with sensitivity 98%, specificity 58%, 95% Confidence Interval of the difference lower 0.939 and upper 0.997. Then cut off value was 1.74.
|
Cut of value |
Sensitivity |
Specificity |
Area under the ROC curve |
95% Confidence interval (CI) |
||
|
Lower bound |
Upper bound |
|||||
|
Neutrophil lymphocyte ratio (NLR) |
1.74 |
98% |
58% |
0.968 |
0.939 |
0.997 |
Table 4: Receiver-Operator Characteristic (ROC) curve of neutrophil lymphocyte ratio and Group-I (Patients with CAD) for prediction of Coronary Artery Disease (CAD).
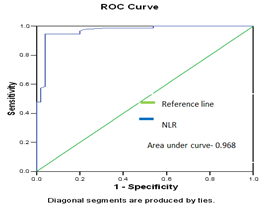
Figure 2: showing determination of sensitivity and specificity of neutrophil lymphocyte ratio (NLR) and Group-I (DM with CAD) by ROC curve.
4. Discussion
Neutrophil Lymphocyte Ratio (NLR) is the sign of balance between neutrophil and lymphocyte levels in the body and an indicator of systemic inflammation [8]. NLR is a new predictor for cardiovascular risk and mortality. NLR could play an important role in early detection of atherosclerosis in diabetic patients and by which we can initiate early treatment [9]. Coronary artery disease occurs at any adult age, but it is the disease of middle and old age. In our study, the mean age of the patients in Group I (patients with CAD) was 54.73 (±8.94) years and in Group II (patients without CAD) was 53.10 (±9.47) years. Similar finding was observed in a couple of previous study [10-13]. There was clear male predominance in Group I (89.28%). In Group II there was 46% male. The difference was statistically significant between the groups (p <0.001). This finding was supported by related previous study [14]. They also found male predominance. They found that in patients with CAD group, male patient was 61.2% and in the other group male patient was 40%. There was also statistically significant association between the groups (p <0.001). Our findings are also similar with the results found in the previous study [7, 15-17]. Our lipid profile findings are similar with previous study [6,18-19].In this study, mean NLR in Group I was 2.76 (±0.74), whereas it was 1.56 (±0.15) in Group II. There was statistically significant association between two groups in this regards (p <0.001).This finding was supported by related previous studies [6]. They also found higher mean NLR in patients with CAD group (1.98±0.85 vs 2.69±1.74) (p <0.001). Another similar study also found higher mean NLR in patients with coronary artery disease (2.3 vs 1.6) (p<0.001) [7]. NLR can be a useful tool to detect and measure the future prognosis of CAD. In this study, we found a relationship between NLR and CAD proven with angiography and NLR is a useful indicator of presence of CAD.
5. Conclusion
Increased Neutrophil Lymphocyte Ratio (NLR) is a risk factor for developing coronary thrombosis leading to Coronary Artery Disease (CAD). With the help of NLR we can take preventive measure and precaution to reduce the risk of coronary artery disease. NLR is a simple, cost effective, readily available test and could be calculated easily to predict the risk of CAD and can take extra measure and preventive intervention to prevent CAD. It can also uses as a simple tool for indicator, prognosis and follow up of CAD.
Acknowledgements
Authors of this study are thankful to the authority of the Department of Cardiology, BSMMU and the Department of Clinical Pathology, BSMMU, for their nice cooperation during sample collection, laboratory procedure and also thankful to the study subjects for their active and enthusiastic participation.
Conflicts of Interest
No conflict of interest relevant to this article was reported.
References
- Folsom AR, Aleksic N, Catellier D, et al. C-reactive protein and incident coronary heart disease in the Atherosclerosis Risk In Communities (ARIC) study.American heart journal144 (2002): 233-238
- Libby P, ridker PM, Maseri a.Inflammation and atherosclerosis. Circulation105 (2002): 1135-1143.
- Ates AH, Canpolat U, Yorgun H, et al. Total white blood cell count is associated with the presence, severity and extent of coronary atherosclerosis detected by dual-source multislice computed tomographic coronary angiography,”Cardiology journal 18 (2011): 371-377.
- Gurm HS, Sarembock IJ, Kereiakes DJ, et al. Horne BD, Anderson JL, John JM, Weaver A, Bair TL, Jensen KR, Renlund DG, Muhlestein JB, for the Intermountain Heart Collaborative (IHC) Study Group. Which White Blood Cell Subtypes Predict Increased Cardiovascular Risk? J Am CollCardiol,”Journal of the American College of Cardiology46 (2005): 1638-1643.
- Madjid M, Awan I, Willerson JT, et al. Leukocyte count and coronary heart disease: implications for risk assessment,”Journal of the American College of Cardiology 44 (2004).1945-1956.
- Sahin S, Sarikaya S, Akyol L, et al. Evaluation of neutrophil to lymphocyte ratio as an indicator of presence of coronary artery disease in diabetic patients,”Natl J Med Res3 (2013): 300-303.
- Sönmez O, Ertas G, Bacaksiz A, et al. Relation of neutrophil-to-lymphocyte ratio with the presence and complexity of coronary artery disease: an observational study,”AnadoluKardiyolDerg 13 (2013): 662-667..
- Zahorec, R., “Ratio of neutrophil to lymphocyte counts-rapid and simple parameter of systemic inflammation and stress in critically ill,”Bratislavskelekarskelisty 102 (2001): 5-14.
- Shen XH, Qi CHEN, LI HW. Association of neutrophil/lymphocyte ratio with long-term mortality after ST elevation myocardial infarction treated with primary percutaneous coronary intervention.Chinese medical journal 123 (2010): 3438-3443.
- Assiri AS, Jamil AM, Mahfouz AA, et al. Diagnostic importance of platelet parameters in patients with acute coronary syndrome admitted to a tertiary care hospital in southwest region, Saudi Arabia,”Journal of the Saudi Heart Association 24 (2012): 17-21.
- Al-Saif SM, AlHabib KF, Ullah A, et al. Age and its relationship to acute coronary syndromes in the Saudi Project for Assessment of Coronary Events (SPACE) registry: the SPACE age study,”Journal of the Saudi Heart Association 24 (2012): 9-16.
- Siddique MA, Shrestha MP, Salman M, et al. Age-related differences of risk profile and angiographic findings in patients with coronary heart disease,”Bangabandhu Sheikh Mujib Medical University Journal 3 (2010): 13-17.
- Ullah M, Sayami LA, Khan MR, et al. In Hospital Outcome of Myocardial Infarcton in nondiabetic patients with high on admission blood glucose level,”Cardiovascular Journal 3 (2011): 143-148.
- Bittencourt C, Piveta VM, Oliveira CS, et al. Association of classical risk factors and coronary artery disease in type 2 diabetic patients submitted to coronary angiography.Diabetology& metabolic syndrome 6 (2014): 1-8.
- Sayeed MA, Mahtab H, Sayeed S, et al. Prevalence and risk factors of coronary heart disease in a rural population of Bangladesh,”Ibrahim Medical College Journal4 (2010): 37-43.
- Paudel R, Panta OB, Paudel B, et al. Acute coronary syndrome in elderly-the difference compared with young in intensive care unit of a tertiary hospital in western Nepal,”J ClinDiagn Res 3 (2009): 1289-1296.
- Joshi P, Islam S, Pais P, et al. Risk factors for early myocardial infarction in South Asians compared with individuals in other countries,”Jama 297 (2007): 286-294.
- Sattar N. Revisiting the links between glycaemia, diabetes and cardiovascular disease,”Diabetologia 56 (2013): 686-695.
- Wilson PW, D’Agostino RB, Levy D, et al. Prediction of coronary heart disease using risk factor categories,”Circulation 97 (1998): 1837-1847.