Alissa Hofmann1,2, Jay S. Mishra2, Pankaj Yadav2, Sri Vidya Dangudubiyyam1,2, Chellakkan S. Blesson3,4, Sathish Kumar1,2,5*
1Endocrinology-Reproductive Physiology Program, University of Wisconsin, Madison, WI 53715, USA
2Department of Comparative Biosciences, School of Veterinary Medicine, University of Wisconsin, Madison, WI 53706, USA.
3Reproductive Endocrinology and Infertility Division, Department of Obstetrics and Gynecology, Baylor College of Medicine, Houston, TX 77030, USA
4Family Fertility Center, Texas Children’s Hospital, Houston, TX 77030, USA
5Department of Obstetrics and Gynecology, School of Medicine and Public Health, University of Wisconsin, Madison, WI 53792, USA
*Corresponding Author: Sathish Kumar. Department of Comparative Biosciences, School of Veterinary Medicine, University of Wisconsin, Madison, WI 53706, USA
Received: 26 September 2023; Accepted: 30 September 2023; Published: 10 October 2023
Perfluorooctane sulfonate (PFOS), a synthetic chemical used in various commercial applications and industrial settings, has led to contamination of drinking water and has been detected in the bloodstream of pregnant women with gestational complications. Recent investigations have indicated that PFOS disrupts placental function; however, the mechanism remains elusive. Given the significant abundance of mitochondria in the placenta, which play a pivotal role in fulfilling the heightened energy requirements of pregnancy, our research aimed to examine the repercussions of PFOS exposure on mitochondrial dynamics within placental trophoblasts. Specifically, human trophoblasts (HTR-8/SVneo) were exposed to environmentally relevant concentrations of PFOS ranging from 0.1 to 50 μM for 48 hours. Findings revealed that PFOS exposure elicited a concentration-dependent decrease in basal, maximal, and ATP-linked respiration. PFOS inhibited the activity of electron transport complexes I, II, and III, resulting in diminished ATP production. Furthermore, PFOS reduced mitochondrial DNA copy number, indicating less mitochondrial content. Concurrently, there was a downregulation in the expression of mitochondrial biogenesis-related genes, including PGC- 1α, NRF1, and NRF2. Notably, PFOS perturbed mitochondrial dynamics by suppressing the expression of fission-related genes (FIS1 and DRP1) and fusion-related genes (MFN1 and MFN2). In summary, our findings suggest that PFOS exposure leads to a decline in mitochondrial content and compromises the bioenergetic capacity of trophoblasts by impairing cellular respiration. This reduction in mitochondrial biogenesis and alterations in fission/fusion dynamics induced by PFOS may contribute to mitochondrial dysfunction in trophoblasts. Consequently, strategies that preserve mitochondrial function in trophoblasts may mitigate PFOSinduced impairment of placental energy metabolism.
PFAS, PFOS, Mitochondria, Placenta, Trophoblast, Biogenesis, Fission, Fusion
PFAS articles; PFOS articles; Mitochondria articles; Placenta articles; Trophoblast articles; Biogenesis articles; Fission articles; Fusion articles
1. Introduction
Perfluoroalkyl substances (PFAS) are a large family of over 10,000 unique fluorinated substances that have at least one fluorinated methylene or methyl carbon atom in their structures [1, 2]. They are commonly employed in industrial manufacturing procedures and consumer goods owing to their combined oleophobic and hydrophobic characteristics [3, 4]. These substances are found in numerous commonly utilized items in daily lives, such as food packaging materials, jackets, papers, paints, cleansers, and more. PFAS resist natural environmental degradation and can be detected in the surroundings, plants, and wildlife [4, 5]. Exposure of human populations to PFAS occurs through consuming contaminated drinking water and food, inhaling polluted air and dust, and direct contact with contaminated substances [4, 6]. Pregnancy poses a unique physiological requirement that necessitates increased daily water intake compared to non-pregnant adults [7], which enhances the vulnerability of pregnant women to exposure to contaminants in drinking water [8-10]. Pregnant women and their developing fetuses are known to be particularly susceptible to PFAS effects, as highlighted by the reported link between PFAS exposure during pregnancy and adverse outcomes such as low birth weight [11, 12], increased maternal weight gain [13], gestational hypertension [14], preeclampsia [15, 16], and gestational diabetes.[17, 18] The placenta, which is implicated in the pathogenesis of these pregnancy complications, is a target organ for PFAS toxicity [19, 20]. PFAS affects various aspects of cellular migration, proliferation, and mitochondrial membrane potential in the JEG-3 human placental trophoblast cells [21]. In addition, PFAS is shown to diminish trophoblast migration, invasion, and the expression of chemokines and their receptors in the HTR-8/SVneo trophoblast cells [22]. PFAS exposure also leads to reduced expression of angiogenic factors in placental BeWo cells [23]. Furthermore, PFAS exposure adversely impacts placental characteristics, including decreased placental weights and relative areas of placental labyrinth zones [24]. PFAS exposure disrupted placental function, including steroidogenesis and lipid metabolism, and decreased transplacental glucose and amino acid transport [24-26]. Thus, understanding the mechanisms by which PFAS dysregulates placental development and function is essential. The normal function and growth of the placenta rely on the vital energy provided by mitochondria, which is the cellular powerhouse. Mitochondria plays a central role in generating ATP through oxidative phosphorylation (OXPHOS), which is essential for fueling placental growth and its nutrient metabolism and transport functions. Moreover, mitochondria serve as the site for steroidogenesis, housing crucial proteins and enzymes like STAR and CYP11A1 for synthesizing glucocorticoids and sex steroids [27]. The efficiency of mitochondrial function is influenced by active changes within the mitochondria, collectively known as mitochondrial dynamics [28]. Mitochondrial dynamics encompass two processes: fusion, where fragmented mitochondria merge together, facilitated by outer mitochondrial membrane proteins Mitofusin1 and 2 (MFN1 and 2) and inner membrane protein OPA1, and fission, where fused mitochondria divide into smaller units, supported by proteins DRP1 and FIS1. These dynamic machinery also involve proteins associated with mitochondrial biogenesis, including PGC-1 (α and β), ERRα, NRF1, and NRF2, which enable mitochondria to adapt to metabolic changes and maintain homeostasis [29]. Conditions that impair mitochondrial dynamics in the placenta can lead to placental insufficiency [30]. Previous studies have shown that exposure to PFOS, the most prominent PFAS, impairs mitochondrial function in various cell types such as hepatocytes [31, 32], oocytes [33, 34], and pancreatic β cells [35]. PFOS also induced excessive ROS production and decreased ATP production in JEG-3 trophoblast cells [36]. However, the mechanisms underlying PFOS effects on placental mitochondrial morphology, respiratory capacity, and dynamics remain unknown. Therefore, this study aimed to examine the role of mitochondrial dynamics and biogenesis in trophoblasts exposed to PFOS. We hypothesized that PFOS disrupts the expression of genes associated with biogenesis and dynamics, leading to mitochondrial dysfunction.
2. Methods
2.1 Cell Culture
HTR-8/SVneo trophoblast cells (CRL-3271, ATCC, Manassa, VA, USA) were cultured in RPMI medium (A10491-01, Gibco, NY) with 5% fetal bovine serum (Gibco, NY) under standard culture conditions (37°C and 5% CO2 in a humidified atmosphere). They were seeded in BioLite 75cm2 flasks at 60% confluence. The culture medium was exchanged with fresh medium every 72 h. Cells were plated at 2-4 x 10⁴ cells/well in a 96-well plate and grown for 24 h. Then, the HTR8 medium was replaced with a 1% fetal bovine serum (FBS) RPMI medium that included PFOS (0.1, 1, 10, or 50 µm) for 48 h.
2.2 Cell Viability
The cell viability was tested with 3-(4,5-dimethylthiazol-2-yl)-5-(3-carboxymethoxyphenyl)-2-(4-sulfophenyl)-2H-tetrazolium (MTS) reagent (Cat# ab197010, Abcam, Chicago, IL, USA). 10% DMSO was used as a positive control. MTS reagent (20 µL) was added per well, and cells were incubated for 30 min. Proliferation was tested at 48 h after cell exposure to PFOS. Optical absorbance at 490 nm was assessed on a microplate reader.
2.3 Mitochondrial Oxygen Consumption
Mitochondrial bioenergetics was assessed using an XF96e Extracellular Flux Analyzer and Seahorse XF Cell Mito Stress Test Kit (Agilent Seahorse, Billerica, MA, USA). The trophoblasts were seeded in V7 Seahorse micro-well plates at 3.5–4.0 × 10⁴ cells/well in 200 µL standard growth media. Cells were treated with PFOS and incubated at 37°C and 5% CO2 for 48 h. Following treatments, the culture media was changed to a non-buffered RPMI media to allow temperature and pH equilibrium. Initially, oxygen consumption rates (OCR) were measured simultaneously three times to establish a baseline rate. Then, to evaluate the mitochondrial function, oligomycin (1 µM), carbonyl cyanide 4-(trifluoromethoxy)phenylhydrazone (FCCP, 0.5 µM), and a mixture of rotenone and antimycin A (Rot/AntA, 0.5 µM) were injected into each well sequentially, with intervals of 3–5 min of mixing between the injections, to inhibit the ATP synthase, uncouple oxidative phosphorylation, and mitochondrial respiration, respectively. OCR measurements were performed before and after each addition of the given compounds. Six mitochondrial respiration parameters were determined: basal, ATP production-linked, maximal, proton leak-linked OCR, and spare respiratory capacity.
2.4 Mitochondrial DNA Copy Number Assay
Mitochondrial DNA (mtDNA) copy number was measured by the real-time method using a mtDNA copy number assay kit (MCN1; Detroit R&D, Detroit, MI, USA) per the manufacturer's instructions. Reactions were performed in duplicate with 10 ng of DNA, and mitochondrial copies of DNA were normalized with copies of nuclear DNA using the 2–ΔΔCT method.
2.5 ATP Assay
Intracellular ATP levels in HTR8 cells were quantified using the EnzyLight ATP Assay Kit (ELDT; BioAssay Systems, CA, USA). Then, the RPMI culture medium was removed, and the cells were treated with 90 µl of ATP reagent. Cells lysed in the ATP reagent were transferred to an opaque 96-well plate for luminescence reading. ATP measurement was read 1 after adding the ATP reagent by a luminometer. 100 µl of buffer containing ATP monitoring enzyme plus nucleotide releasing buffer were used as a blank to determine the background luminescence.
2.6 Western Blot
HTR8 cells were plated 3-4x10⁴ cells/plate on 100 mm plates in culture medium for 24 h. The medium was switched to RPMI medium with PFOS (0.1, 1, 10 and 50 µm). HTR8 cells were homogenized in ice-cold radioimmunoprecipitation assay (RIPA) buffer and kept on ice for 20 min with tapping every 5 min for proper lysis. Lysate was spun at an rpm of 14,000 for 15 min at 4°C. The extracted protein concentration was determined by a BCA kit (Pierce; Thermo Scientific, Waltham, MA, USA). Loading samples were prepared by mixing 40 µg proteins with NuPAGE lithium dodecyl sulfate sample buffer and NuPAGE reducing agent (Invitrogen; Thermo Fisher Scientific, Waltham, MA, USA). The protein was run on NuPAGE 4-12% Bis-Tris Gel (Invitrogen; Thermo Fisher Scientific, Waltham, MA, USA) at 70V for 5-10 min and then 120V for a minute or two at room temperature with Chameleon Duo Pre-stained Protein Ladder (Li-COR, NE, USA). After separation, proteins were transferred onto an Immobilon-FL transfer membrane (Millipore, Billerica, MA, USA) at 20V for 1 h. The membrane was stained with RevertTM 700 Total Protein Stain Kit (Li-COR, NE, USA) and then blocked with 5% (wt/vol) nonfat dried milk in 1% TBS(T) for 1 h at room temperature. Blots were maintained overnight at 4°C and then 30 min to an hour at room temperature with respective primary antibodies against COX IV (4850; Cell Signaling Technologies, Danvers, MA, USA), Cytochrome C (4280; Cell Signaling Technologies, Danvers, MA, USA), HSP60 (12165; Cell Signaling Technologies, Danvers, MA, USA), PHB1 (2426; Cell Signaling Technologies, Danvers, MA, USA), Pyruvate Dehydrogenase (3205; Cell Signaling Technologies, Danvers, MA, USA), SDHA (11998; Cell Signaling Technologies, Danvers, MA, USA), SOD1 (4266; Cell Signaling Technologies, Danvers, MA, USA), VDAC (4661; Cell Signaling Technologies, Danvers, MA, USA) , OXPHOS antibody cocktail (Cat # ab110413, Abcam, Waltham, MA, USA), or GAPDH (Cat #D16H11; Cell Signaling Technologies, Danvers, MA, USA). After washing with 1xTBS(T), the membranes were maintained with a secondary antibody, anti-Rabbit or anti-Mouse (Li-COR, NE, USA) for an hour at room temperature. Blots were imaged with Odyssey XF Imaging System (Li-COR, NE, USA) at 700 or 800 nm.
2.7 Real-time PCR
Total RNA was isolated per the manufacturer's instructions using an RNeasy mini kit (QIAGEN, Valencia, CA, USA). The concentration of RNA and its integrity were determined using a DS-11 spectrophotometer (DeNovix, Wilmington, DE, USA). Total RNA (1 µg) was reverse transcribed with an iScript cDNA synthesis kit from Bio-Rad (Hercules, CA, USA). After dilution, cDNA corresponding to 36 ng of RNA was amplified by qRT-PCR using SYBR green (SsoAdvanced TMUniversal SYBR® Green Supermix, Bio-Rad) serving as the fluorophore in a CF× 96 real-time thermal cycler (Bio-Rad, Hercules, CA, USA) with. PCR primers, PGC-1α, FIS1, DRP1, MFN1, MFN2, and OPA1, were obtained from a previous study [37] and verified using primer-blast software. Gene-specific primers were designed for PGC-1β, NRF1, NRF2, and ERRα were purchased from Integrated DNA Technologies (Coralville, IA, USA). The primers used are listed in Table 1. PCR conditions for the SYBR green Gene Expression Assay were 2 min at 50 °C and 10 min at 95 °C for a cycle, and then 15 s at 95 °C and a minute at 60 °C for 50 cycles. Results were quantified with the 2–ΔΔCT method and presented as fold change in treatment croup compared to controls. All primers exhibited efficiency between 95% and 101%. All reactions were performed in duplicate, and Ubiquitin C was used as an internal control.
Table 1: Primers used for quantitative real-time PCR
|
Gene |
Forward |
Reverse |
Species |
|
PGC-1α |
CGCAGTCACAACACTTACAAGC |
GGGGTCATTTGGTGACTCTG |
Human |
|
PGC-1β |
CTGCTGGCCCAGATACACTGA |
ATCCATGGCTTCATACTTGCTTTT |
Human |
|
ERRα |
TGCCAATTCAGACTCTGTGC |
CCAGCTTCACCCCATAGAAA |
Human |
|
NRF-1 |
CCAAGTGAATTATTCTGCCG |
TGACTGCGCTGTCTGATATCC |
Human |
|
NRF-2 |
ACACGGTCCACAGCTCATC |
TGTCAATCAAATCCATGTCCTG |
Human |
|
FIS-1 |
TACGTCCGCGGGTTGCT |
CCAGTTCCTTGGCCTGGTT |
Human |
|
DRP-1 |
TGGGCGCCGACATCA |
GCTCTGCGTTCCCACTACGA |
Human |
|
MFN-1 |
GGCATCTGTGGCCGAGTT |
ATTATGCTAAGTCTCCGCTCCAA |
Human |
|
MFN-2 |
GCTCGGAGGCACATGAAAGT |
ATCACGGTGCTCTTCCCATT |
Human |
|
OPA-1 |
GGCTCTGCAGGCTCGTCTCAAGG |
TTCCGCCAGTTGAACGCGTTTACC |
Human |
2.8 Statistical Analysis
Statistical analyses were done with GraphPad Prism software. Data are presented as the mean ± SEM. Comparisons between multiple groups were done using ANOVA. Differences were considered to be statistically significant at p < 0.05.
3. Results
3.1 Cytotoxicity of PFOS
Cell viability was assessed to optimize the PFOS concentrations for trophoblast exposure in subsequent experiments. At PFOS concentrations less than 50 μM, the cytotoxicity was not apparent. However, trophoblast cell viability concentration-dependently decreased within the range of 50 to 200 μM (Figure 1). The half-maximal inhibitory concentration (IC50) of PFOS against trophoblasts after 48 hours was 70.71 μM. To explore the mitochondrial effects of PFOS, noncytotoxic concentrations between 0.1 and 50 μM were selected for subsequent experiments.
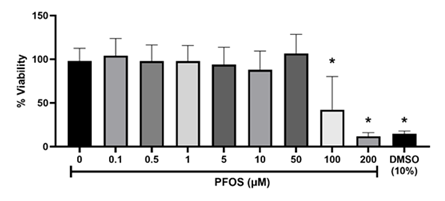
Figure 1: Effect of PFOS on cell viability. HTR-8/SVneo cells were exposed to increasing concentrations of PFOS for 48 h. Cell viability was analyzed by MTS assay. Values are mean ± SEM from five independent experiments *p < 0.05 vs. vehicle control.
3.2 PFOS Inhibited OCR in Trophoblasts
To investigate the impact of PFOS on mitochondrial bioenergetics, a mitochondrial stress test was conducted using a Seahorse extracellular flux analyzer. The results showed that exposure to PFOS decreased the overall OCR in trophoblasts compared to the controls (Figure 2A). Basal respiration, which represents the oxygen consumption necessary for normal cellular ATP synthesis [38], decreased by 20% and 64% at 10 and 50 µM PFOS exposure, respectively (Figure 2B). Similarly, maximum respiration, indicating the cell's capacity to achieve the highest respiration rate, decreased by 17%, 41%, and 73% at 1, 10, and 50 µM PFOS, respectively (Figure 2C). Proton leakage, a measure of residual basal respiration associated with uncoupled ATP synthesis, increased at 0.1 μM PFOS, but the 10 µM and 50 µM PFOS-exposed groups exhibited 12% and 45% lower levels of proton leakage compared to the controls (Figure 2D). ATP generation and ATP-coupled respiration were significantly reduced at 10 µM and 50 µM PFOS concentrations (Figures 2E and F). The spare respiratory capacity, indicating the cell's ability to respond to increased energy demand, decreased with 1, 10, and 50 µM PFOS concentrations (Figure 2G). Notably, non-mitochondrial oxygen consumption diminished at 50 µM PFOS exposure (Figure 2H).
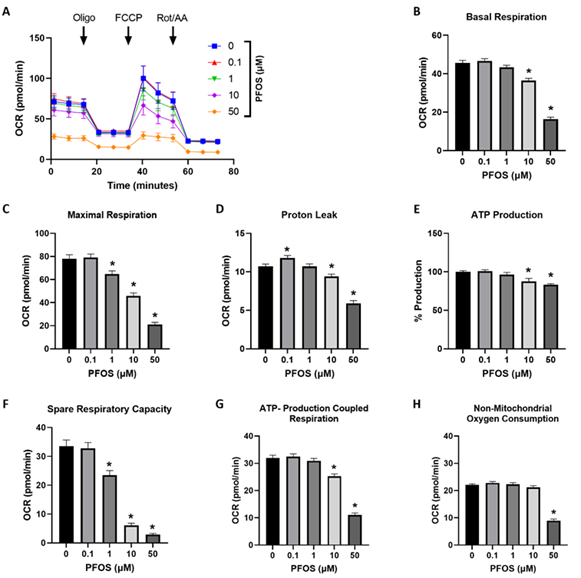
Figure 2: Effects of PFOS on the mitochondrial oxygen consumption rate (OCR) in trophoblast cells.
(A) representative traces of normalized mitochondrial respiration rates; (B) basal respiration; (C) maximal respiration; (D) proton leak; (E) ATP production; (F) ATP linked respiration; (G) spare respiratory capacity; (H) non-mitochondrial respiration. Values are mean ± SEM from five independent experiments. * p < 0.05 vs. vehicle control. Oligo: oligomycin. FCCP: carbonyl cyanide 4-(trifluoromethoxy) phenylhydrazone. Rot/AA: rotenone/antimycin A.
3.3 PFOS decreased mtDNA Copy Number
The impact of PFOS exposure on trophoblast mitochondria was investigated by examining the mtDNA copy number. PFOS exposure significantly decreased mtDNA copy number at 0.1, 1, 10 and 50 µM (Figure 3).
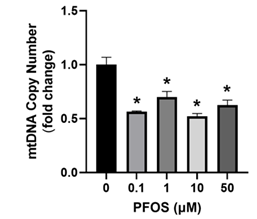
Figure 3: Effect of PFOS on mitochondrial DNA copy number. Mitochondrial DNA copy number was quantified using qRT-PCR. Values are mean ± SEM from five independent experiments. * p < 0.01 vs. vehicle control.
3.4 PFOS altered mitochondrial OXPHOS protein complexes
OXPHOS is a fundamental process through which mitochondria produce ATP. Thus, we analyzed protein abundance to investigate the effects of PFOS exposure on five different OXPHOS systems: complex I (NDUFB8), complex II (SDHB), complex III (UQCRC2), complex IV (COX II), and complex V (ATP5A) in trophoblasts. Trophoblast cells exposed to PFOS exhibited a significant reduction in the protein levels of complexes I, II, and III. In contrast, the protein levels of complexes IV and V were not significantly altered (Figure 4).
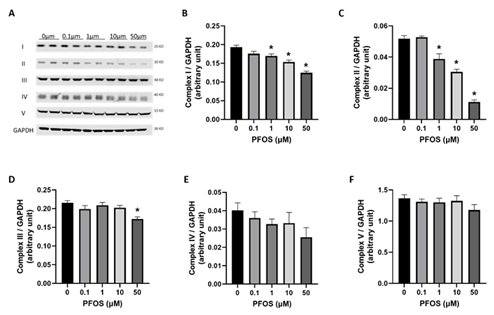
Figure 4: Effects of PFOS on mitochondrial respiratory complex levels:
representative western blot of different mitochondrial complex protein content. (B–F) Fold-change of protein levels for the different subunits of mitochondrial complexes: (B) complex I (CI, NDUFB8); (C) complex II (CII, SDHB); (D) complex III (CIII, UQCCRC2); (E) complex IV (CIV, MTCO); (F) complex V (CV, ATP5α). GAPDH (Glyceraldehyde-3-phosphate dehydrogenase) is used as a loading control for Western blots, and its values are used for normalization. Values are mean ± SEM from five independent experiments. * p < 0.05 vs. vehicle control.
3.5 PFOS altered Mitochondrial Fusion and Biogenesis Genes
Genes that regulate mitochondrial dynamics and biogenesis are crucial markers for assessing mitochondrial health. Thus, we conducted a comprehensive analysis to examine the impact of PFOS on the expression levels of critical genes involved in mitochondrial fission, fusion, and biogenesis using qPCR.
For mitochondrial fusion genes, namely OPA1, MFN1, and MFN2, qPCR analysis revealed that PFOS exposure had no significant effect on OPA1 expression. However, both MFN1 and MFN2 were downregulated by 10 and 50 µM PFOS exposure (Figure 5A). The mRNA expression of fission genes DRP1 and FIS1 was significantly reduced (Figure 5B). Specifically, DRP1 was decreased at 10 and 50 µM PFOS exposure, while FIS1 was decreased only at 50 µM PFOS concentration compared to controls (Figure 5B).
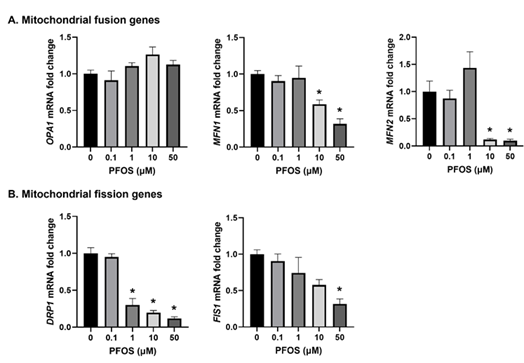
Figure 5: Effects of PFOS on the expression of the genes involved in mitochondrial dynamics.
The mRNA levels of (A) Mitochondrial fusion genes - OPA1, MFN1 and MFN2; and (B) Mitochondrial fission genes - DRP1 and FIS1; were analyzed by qPCR. The mRNA expressions of each gene are normalized to Ubiquitin expression.
Values are mean ± SEM from five independent experiments. * p < 0.05 vs. vehicle control.
Examining the mitochondrial biogenesis-associated genes showed significant downregulation of PGC-1α following 0.1, 1, and 10 µM PFOS exposure compared to controls (Figure 6A). Similarly, PGC-1β decreased at 10 and 50 µM PFOS concentrations, while an increase was observed at 0.1 µM PFOS compared to controls (Figure 6A). Interestingly, downstream genes influenced by PGC-1, such as ERRα, exhibited no significant changes. However, both NRF1 and NRF2 decreased at 10 and 50 µM PFOS compared to controls (Figure 6B).
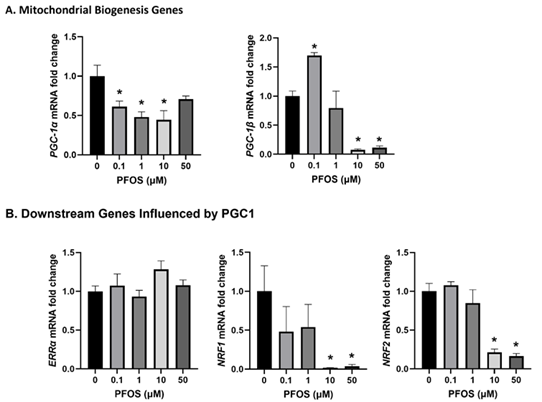
Figure 6: Effects of PFOS on the expression of the genes involved in mitochondrial biogenesis. The mRNA levels of (A) Mitochondrial biogenesis genes- PGC-1α and PGC-1β; and (B) Downstream genes influenced by PGC1 –ERRα, NRF1, and NRF2. The mRNA expressions of each gene are normalized to Ubiquitin expression. Values are mean ± SEM from five independent experiments. * p < 0.05 vs. vehicle control.
4. Discussion
A successful pregnancy relies on the delicate balance of resource allocation between the developing fetus and the mother. The placenta is the intermediary organ between the mother and fetus, allocating these necessary resources. It accomplishes this by metabolizing nutrients and hormones, facilitating the transfer of nutrients and oxygen, and contributing to the health of the mother and the fetus. Within the placenta, mitochondria, the primary sites of cellular metabolism, play a crucial role in maintaining homeostasis [39]. Maintaining optimal mitochondrial health is imperative to ensure efficient cellular metabolism, as impaired mitochondria often lead to placental insufficiency [40]. PFOS, a member of the PFAS family, has gained significant attention due to its presence in the environment and human samples and its association with various adverse birth outcomes [41]. However, no experimental studies have confirmed the placental mitochondrial toxicity of PFOS or explored potential underlying mechanisms. The findings demonstrate that exposure to PFOS reduces oxygen consumption and mtDNA copies in trophoblasts. Additionally, PFOS exposure leads to decreased levels of proteins within the electron transport chain complex. Moreover, PFOS disrupts mitochondrial dynamics by downregulating genes involved in biogenesis, fission, and fusion. The viability of cells was unaffected by PFOS at concentrations up to 50 μM. However, higher concentrations of PFOS resulted in significant cell death in trophoblasts, which aligns with previous in vitro and in vivo studies [21, 36, 42, 43]. In the mitochondrial stress test, cells exposed to higher PFOS concentrations exhibited consistently lower OCR throughout the experiment, indicating that mitochondria are dysfunctional. Specifically, the reduced OCR in basal and ATP-linked respiration suggests the impaired ability of the mitochondria to perform fundamental respiratory functions. Additionally, the decreased OCR in both proton leak and uncoupler-stimulated respiration (maximal respiration) indicates changes in membrane potential due to dysfunctional mitochondria. Consistently, previous studies show that exposure to 1 and 10 µM PFOS in JEG-3 trophoblast cells resulted in more pronounced depolarization of mitochondrial membrane potential [36]. Interestingly, PFOS also caused a reduction in mtDNA copy numbers within the concentration range of 0.1 to 50 µM. These findings indicate that PFOS exposure diminishes the abundance of mitochondria and reduces oxygen consumption, resulting in functional impairments in mitochondria. We conducted further investigations to elucidate the molecular mechanisms underlying mitochondrial dysfunction in trophoblasts exposed to PFOS. OXPHOS is a process that relies on the coordinated functions of five enzyme complexes located on the inner mitochondrial membrane, collectively forming the mitochondrial respiratory chain and facilitating ATP production [44]. We observed decreased activity in all mitochondrial complexes, with complex II being the most prominently affected in trophoblasts exposed to PFOS concentrations ranging from 1 to 50 µM. Interestingly, a study focusing on a PFAS mixture demonstrated no impact on the activity of mitochondrial complexes in Zebrafish larvae [45]. This discrepancy may be attributed to the specific nature of the substances investigated (PFOS vs. PFAS mixture) as well as the different cell types studied (trophoblasts vs. Zebrafish). Mixtures of PFAS and Zebrafish may exhibit distinct responses compared to the effect of a single PFAS (i.e., PFOS) on trophoblasts. Considering that the ETC complexes are the primary contributors to ATP production, alterations in the proteins comprising the catalytic domains of these complexes may lead to reduced ATP production induced by PFOS. Our mito-stress analysis supported this, which revealed decreased basal- and ATP-linked respiration and proton leak in cells exposed to PFOS. Hence, the compromised function of all ETC complexes could be one of the mechanisms contributing to placental mitochondrial dysfunction in trophoblasts exposed to PFOS. However, the specific mechanism in which PFOS downregulates ETC complexes remains unknown and necessitates further investigation. Prior research has shown that abnormal mitochondrial structure and dysregulated fission and fusion processes are implicated in human diseases [46]. The fusion of the outer mitochondrial membrane relies on the interaction between MFN1 and MFN2 proteins, which are critical for maintaining a healthy mitochondrial network [47]. Earlier reports have also highlighted the importance of MFN1 and MFN2 in maintaining glucose homeostasis [48]. Our findings indicate a decrease in the expression of MFN1/MFN2 in trophoblasts exposed to PFOS, which may contribute to the observed abnormal mitochondrial structure and potentially result in mitochondrial dysfunction. FIS1 serves as a mitochondrial receptor protein that facilitates the recruitment of DRP1 for mitochondrial fission. Additionally, independent of its association with DRP1, FIS1 can also promote fission by acting as a negative regulator of the fusion machinery involving OPA1 and MFN1/MFN2 [49]. Our data demonstrate reduced expression of the FIS1 mRNA in PFOS-exposed trophoblasts, suggesting a potential disruption in the mitochondrial fission mechanism. It is well-known that a well-balanced fusion and fission process is a critical regulator for adapting to environmental conditions and maintaining a healthy population of mitochondria [50]. Damaged mitochondria are typically removed and recycled through mitophagy, which begins with the fission of damaged mitochondria from the healthy mitochondrial network. FIS1 is involved in regulating mitophagy [51]. Therefore, the reduced expression of the FIS1 may disrupt the mitophagy process, potentially leading to the accumulation of unhealthy mitochondria and ultimately resulting in suboptimal cellular metabolism [52, 53]. Moreover, our findings revealed downregulation of mitochondrial biogenesis genes, namely PGC-1α and PGC-1β, as well as their downstream genes NRF1 and NRF2, in trophoblasts exposed to PFOS. This downregulation indicates a decrease in mitochondrial biogenesis. Consistent with our findings, previous reports have documented that PFOS reduces the expressions of PGC-1α and MFN2 in embryonic stem cell-derived cardiomyocytes [54]. These observations collectively suggest that mitochondrial function may be suboptimal in PFOS-exposed trophoblasts. However, in the absence of mitophagy, the cellular recycling mechanism for mitochondria, the trophoblasts' ability to generate new mitochondria and maintain mtDNA copy number may be impaired. Furthermore, considering that NRF2 serves as the master regulator of a broad range of antioxidant enzymes, the decreased expression of NRF2 in PFOS-exposed trophoblasts implies a potential inability to counteract the increased oxidative stress caused by PFOS exposure [55]. However, further studies are needed to fully understand the role of NRF2 and the redox system in PFOS-induced mitochondrial dysfunction.
In conclusion, our findings indicate that exposure to PFOS may impair the bioenergetic capacity of trophoblasts by reducing OCR associated with basal and ATP-linked respiration. Additionally, PFOS exposure downregulates the expression of genes involved in mitochondrial fission, fusion, and biogenesis in trophoblasts. Collectively, these results indicate that PFOS exposure has the potential to induce mitochondrial dysfunction in trophoblasts and possibly contributing to placental insufficiency (Figure 7). The impact on mitochondrial dysfunction was evident within the 0.1 to 50 µM PFOS concentration range. Considering the general population data from the National Health and Nutrition Examination Survey, serum PFOS concentrations have been reported to range from 0.8 nM to 0.9 μM, with occupational workers exhibiting higher levels ranging from 0.3 to 6.9 μM compared to the general population [56, 57]. Furthermore, It is also important to note that the local concentration of PFOS in the placenta is much higher than the serum concentrations due to its bioaccumulation [58, 59, 60]. Therefore, the PFOS concentration investigated in our study holds environmental and human health implications. Efforts to preserve and enhance mitochondrial function in trophoblasts may have potential benefits in mitigating impaired placental energy metabolism and nutrient handling caused by PFOS exposure.
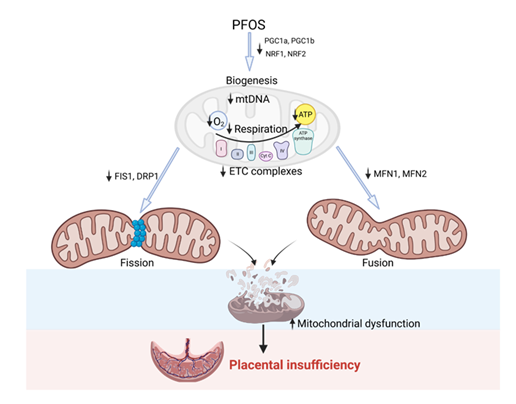
Figure 7: Overview schematic of PFOS effects on placental mitochondria. PFOS exposure leads to inhibition of PGC-1 (α and β) and its downstream genes NRF1/NRF2. This may result in decreased mtDNA, respiration, ATP production, and electron transport chain activity in the mitochondria. Additionally, PFOS exposure decreases fission genes FIS1/DRP1 and fusion genes MFN1/MFN2. All of these changes contribute to increased mitochondrial dysfunction, which can potentially lead to placental insufficiency.
Competing Interests
The authors declare that they have no known competing financial interests or personal relationships that could have appeared to influence the work reported in this paper.
Funding
Financial Support from the National Institute of Health (NIH) through grants R01ES033345 and R01HL134779, awarded to S.K., is greatly appreciated. The content is solely the authors' responsibility and does not necessarily represent the official views of NIH. The funding agency was not involved in the design, analysis, or interpretation of the data reported.
References
- Wang Z, Buser AM, Cousins IT, et al. A New OECD Definition for Per- and Polyfluoroalkyl Substances. Environ Sci Technol 55 (2021): 15575-15578.
- Williams AJ, Grulke CM, Edwards J, et al. The CompTox Chemistry Dashboard: a community data resource for environmental chemistry. J Cheminform 9 (2017): 61.
- Lindstrom AB, Strynar MJ and Libelo EL. Polyfluorinated compounds: past, present, and future. Environ Sci Technol 45 (2011): 7954-7961.
- Sunderland EM, Hu XC, Dassuncao C, et al. A review of the pathways of human exposure to poly- and perfluoroalkyl substances (PFASs) and present understanding of health effects. J Expo Sci Environ Epidemiol 29 (2019): 131-147.
- Boiteux V, Dauchy X, Bach C, et al. Concentrations and patterns of perfluoroalkyl and polyfluoroalkyl substances in a river and three drinking water treatment plants near and far from a major production source. Sci Total Environ 583 (2017): 393-400.
- Cao W, Liu X, Liu X, et al. Perfluoroalkyl substances in umbilical cord serum and gestational and postnatal growth in a Chinese birth cohort. Environ Int 116 (2018): 197-205.
- Zhang N, Zhang F, Chen S, et al. Associations between hydration state and pregnancy complications, maternal-infant outcomes: protocol of a prospective observational cohort study. BMC Pregnancy Childbirth 20 (2020): 82.
- Rickard BP, Rizvi I and Fenton SE. Per- and poly-fluoroalkyl substances (PFAS) and female reproductive outcomes: PFAS elimination, endocrine-mediated effects, and disease. Toxicology 465 (2022): 153031.
- Fenton SE, Ducatman A, Boobis A, et al. Per- and Polyfluoroalkyl Substance Toxicity and Human Health Review: Current State of Knowledge and Strategies for Informing Future Research. Environ Toxicol Chem 40 (2021): 606-630.
- Post GB, Gleason JA and Cooper KR. Key scientific issues in developing drinking water guidelines for perfluoroalkyl acids: Contaminants of emerging concern. PLoS Biol 15 (2017): 2002855.
- Johnson PI, Sutton P, Atchley DS, et al. The Navigation Guide - evidence-based medicine meets environmental health: systematic review of human evidence for PFOA effects on fetal growth. Environ Health Perspect 122 (2014): 1028-1039.
- Fei C, McLaughlin JK, Tarone RE, et al. Perfluorinated chemicals and fetal growth: a study within the Danish National Birth Cohort. Environ Health Perspect 115 (2007): 1677-1682.
- Ashley-Martin J, Dodds L, Arbuckle TE, et al. Maternal and Neonatal Levels of Perfluoroalkyl Substances in Relation to Gestational Weight Gain. Int J Environ Res Public Health 13 (2016).
- Holtcamp W. Pregnancy-induced hypertension "probably linked" to PFOA contamination. Environ Health Perspect 120 (2012): 59.
- Bommarito PA, Ferguson KK, Meeker JD, et al. Maternal Levels of Perfluoroalkyl Substances (PFAS) during Early Pregnancy in Relation to Preeclampsia Subtypes and Biomarkers of Preeclampsia Risk. Environ Health Perspect 129 (2021): 107004.
- Wikstrom S, Lindh CH, Shu H, et al. Early pregnancy serum levels of perfluoroalkyl substances and risk of preeclampsia in Swedish women. Sci Rep 9 (2019): 9179.
- Wang H, Yang J, Du H, e al. Perfluoroalkyl substances, glucose homeostasis, and gestational diabetes mellitus in Chinese pregnant women: A repeat measurement-based prospective study. Environ Int 114 (2018): 12-20.
- Matilla-Santander N, Valvi D, Lopez-Espinosa MJ, et al. Exposure to Perfluoroalkyl Substances and Metabolic Outcomes in Pregnant Women: Evidence from the Spanish INMA Birth Cohorts. Environ Health Perspect 125 (2017): 117004.
- Hall SM, Zhang S, Hoffman K., et al. Concentrations of per- and polyfluoroalkyl substances (PFAS) in human placental tissues and associations with birth outcomes. Chemosphere 295 (2022): 133873.
- Lu Y, Meng L, Ma D, et al. The occurrence of PFAS in human placenta and their binding abilities to human serum albumin and organic anion transporter 4. Environ Pollut 273 (2021): 116460.
- Blake BE, Rickard BP and Fenton SE. A High-Throughput Toxicity Screen of 42 Per- and Polyfluoroalkyl Substances (PFAS) and Functional Assessment of Migration and Gene Expression in Human Placental Trophoblast Cells. Front Toxicol 4 (2022): 881347.
- Szilagyi JT, Freedman AN, Kepper SL, et al. Per- and Polyfluoroalkyl Substances Differentially Inhibit Placental Trophoblast Migration and Invasion In Vitro. Toxicol Sci 175 (2020): 210-219.
- Pham A, Zhang J and Feng L. Exposure to perfluorobutane sulfonate and perfluorooctanesulfonic acid disrupts the production of angiogenesis factors and stress responses in human placental syncytiotrophoblast. Reprod Toxicol 98 (2020): 269-277.
- Wan HT, Wong AY, Feng S, et al. Effects of In Utero Exposure to Perfluorooctane Sulfonate on Placental Functions. Environ Sci Technol 54 (2020): 16050-16061.
- Dangudubiyyam SV, Mishra JS and Kumar S. Perfluorooctane sulfonic acid modulates expression of placental steroidogenesis-associated genes and hormone levels in pregnant rats. Reprod Toxicol 118 (2023): 108390.
- Yao W, Xu J, Tang W, et al. Developmental toxicity of perfluorohexane sulfonate at human relevant dose during pregnancy via disruption in placental lipid homeostasis. Environ Int 177 (2023): 108014.
- Chatuphonprasert W, Jarukamjorn K and Ellinger I. Physiology and Pathophysiology of Steroid Biosynthesis, Transport and Metabolism in the Human Placenta. Front Pharmacol 9 (2018): 1027.
- Tilokani L, Nagashima S, Paupe V, et al. Mitochondrial dynamics: overview of molecular mechanisms. Essays Biochem 62 (2018): 341-360.
- Giacomello M, Pyakurel A, Glytsou C, et al. The cell biology of mitochondrial membrane dynamics. Nat Rev Mol Cell Biol 21 (2020): 204-224.
- Holland O, Dekker Nitert M, Gallo LA, et al. Review: Placental mitochondrial function and structure in gestational disorders. Placenta 54 (2017): 2-9.
- Wang J, Wang J, Qiu T, et al. Mitochondrial iron overload mediated by cooperative transfer of plasma membrane ATP5B and TFR2 to mitochondria triggers hepatic insulin resistance under PFOS exposure. Ecotoxicol Environ Saf 253 (2023): 114662.
- Dong Z, Wang J, Qiu T, et al. Perfluorooctane sulfonate induces mitochondrial calcium overload and early hepatic insulin resistance via autophagy/detyrosinated alpha-tubulin-regulated IP3R2-VDAC1-MICU1 interaction. Sci Total Environ 825 (2022): 153933.
- Wei KN, Wang XJ, Zeng ZC, et al. Perfluorooctane sulfonate affects mouse oocyte maturation in vitro by promoting oxidative stress and apoptosis induced bymitochondrial dysfunction. Ecotoxicol Environ Saf 225 (2021): 112807.
- Jiao X, Liu N, Xu Y, et al. Perfluorononanoic acid impedes mouse oocyte maturation by inducing mitochondrial dysfunction and oxidative stress. Reprod Toxicol 104 (2021): 58-67.
- Duan X, Sun W, Sun H, et al. Perfluorooctane sulfonate continual exposure impairs glucose-stimulated insulin secretion via SIRT1-induced upregulation of UCP2 expression. Environ Pollut 278 (2021): 116840.
- Zhao Y, Zhao H, Xu H, et al. Perfluorooctane sulfonate exposure induces preeclampsia-like syndromes by damaging trophoblast mitochondria in pregnant mice. Ecotoxicol Environ Saf 247 (2022): 114256.
- Mishra JS, Blesson CS and Kumar S. Testosterone Decreases Placental Mitochondrial Content and Cellular Bioenergetics. Biol (Basel) 9 (2020).
- Seo BJ, Choi J, La H, et al. Role of mitochondrial fission-related genes in mitochondrial morphology and energy metabolism in mouse embryonic stem cells. Redox Biol 36 (2020):
- Kluge MA, Fetterman JL and Vita JA. Mitochondria and endothelial function. Circ Res 112 (2013): 1171-1188.
- McElwain CJ, Tuboly E, McCarthy FP, et al. Mechanisms of Endothelial Dysfunction in Preeclampsia and Gestational Diabetes Mellitus: Windows Into Future Cardiometabolic Health? Front Endocrinol (Lausanne) 11 (2020): 655.
- Kaiser AM, Forsthuber M, Widhalm R, et al. Prenatal exposure to per- and polyfluoroalkyl substances and pregnancy outcome in Austria. Ecotoxicol Environ Saf 259 (2023): 115006.
- Li J, Quan X, Lei S, et al. PFOS Inhibited Normal Functional Development of Placenta Cells via PPARgamma Signaling. Biomed 9 (2021).
- Chen G, Xu LL, Huang YF, et al. Prenatal Exposure to Perfluorooctane Sulfonate impairs Placental Angiogenesis and Induces Aberrant Expression of LncRNA Xist. Biomed Environ Sci 31 (2018): 843-847.
- Byrnes J, Ganetzky R, Lightfoot R, et al. Pharmacologic modeling of primary mitochondrial respiratory chain dysfunction in Zebrafish. Neurochem Int 117 (2018): 23-34.
- Liu Y, Liu S, Huang J, et al. Mitochondrial dysfunction in metabolic disorders induced by per- and polyfluoroalkyl substance mixtures in zebrafish larvae. Environ Int 176 (2023): 107977.
- Archer SL. Mitochondrial dynamics--mitochondrial fission and fusion in human diseases. N Engl J Med 369 (2013): 2236-2251.
- Eura Y, Ishihara N, Yokota S, et al. Two mitofusin proteins, mammalian homologues of FZO, with distinct functions are both required for mitochondrial fusion. J Biochem 134 (2003): 333-344.
- Chen H, Vermulst M, Wang YE, et al. Mitochondrial fusion is required for mtDNA stability in skeletal muscle and tolerance of mtDNA mutations. Cell 141 (2010): 280-289.
- Yu R, Jin SB, Lendahl U, et al. Human Fis1 regulates mitochondrial dynamics through inhibition of the fusion machinery. EMBO J 38 (2019).
- Bernhardt D, Muller M, Reichert AS, et al. Simultaneous impairment of mitochondrial fission and fusion reduces mitophagy and shortens replicative lifespan. Sci Rep 5 (2015): 7885.
- Liou YH, Personnaz J, Jacobi D, et al. Hepatic Fis1 regulates mitochondrial integrated stress response and improves metabolic homeostasis. JCI Insight 7 (2022).
- Wilkinson KA and Guo C. Iron chelation promotes mitophagy through SENP3-mediated deSUMOylation of FIS1. Autophagy 18 (2022): 1743-1745.
- Varuzhanyan G, Ladinsky MS, Yamashita SI, et al. Fis1 ablation in the male germline disrupts mitochondrial morphology and mitophagy, and arrests spermatid maturation. Dev 10 (2021): 148.
- Tang LL, Wang JD, Xu TT, et al. Mitochondrial toxicity of perfluorooctane sulfonate in mouse embryonic stem cell-derived cardiomyocytes. Toxicology 382 (2017): 108-116.
- Ngo V and Duennwald ML. Nrf2 and Oxidative Stress: A General Overview of Mechanisms and Implications in Human Disease. Antioxidants (Basel) 4 (2022): 11
- Calafat AM, Wong LY, Kuklenyik Z, et al. Polyfluoroalkyl chemicals in the U.S. population: data from the National Health and Nutrition Examination Survey (NHANES) 2003-2004 and comparisons with NHANES 1999-2000. Environ Health Perspect 115 (2007): 1596-1602.
- Olsen GW, Burris JM, Ehresman DJ, et al. Half-life of serum elimination of perfluorohexanesulfonate, and perfluorooctanoate in retired fluorochemical production workers. Environ Health Perspect 115 (2007): 1298-1305.
- Mamsen LS, Bjorvang RD, Mucs D, et al. Concentrations of perfluoroalkyl substances (PFASs) in human embryonic and fetal organs from first, second, and third trimester pregnancies. Environ Int 124 (2019): 482-492.
- Mamsen LS, Jonsson BAG, Lindh CH, et al. Concentration of perfluorinated compounds and cotinine in human foetal organs, placenta, and maternal plasma. Sci Total Environ 596 (2017): 97-105.
- Bangma J, Eaves LA, Oldenburg K, et al. Identifying Risk Factors for Levels of Per- and Polyfluoroalkyl Substances (PFAS) in the Placenta in a High-Risk Pregnancy Cohort in North Carolina. Environ Sci Technol 54 (2020): 8158-8166.