Miora Koloina Ranaivosoa1*, Tinà Rakotoniaina2, Valdo Rahajanirina2, Tahinamandranto Rasamoelina3, Zely Arivelo Randriamanantany4, Olivat Rakoto Alson5, Andry Rasamindrakotroka6
1Biologist. Laboratory of Biochemistry of Joseph Ravoahangy Andrianavalona University Hospital Antananarivo, Madagascar
2Medical Biology Student, Laboratory of Joseph Raseta Befelatanana University Hospital Antananarivo, Madagascar
3Scientist, Centre d’Infectiologie Charles Mérieux, University of Antananarivo, Madagascar
4Professor of Immunology, National Center for Blood Transfusion Antananarivo, Madagascar
5Professor of Biological Haematology, Medical Biology Department of the Faculty of Medicine Antananarivo, Madagascar
6Professor of Immunology, Laboratory of Training and Research in Medical Biology, University of Antananarivo, Madagascar
*Corresponding Author: Miora Koloina Ranaivosoa, Laboratory of Biochemistry of Joseph Ravoahangy Andrianavalona University Hospital Antananarivo, Madagascar
Received: 31 December 2019; Accepted: 09 January 2020; Published: 14 January 2020
DOI: 10.26502/jbb.2642-91280023
ShareThe main reason of this study is to determine from which serum hemolysis index the interference was positive for the kaliemia dosage on automaton BS 300 (Mindray®). The secondary aim was to establish a reliable reporting for the clinicians in front of hemolysed samples for the kaliemia dosage. The hemolysis additions method was run to create an increasing hemoglobin range of concentration varying from 0 to 12 g/dl. To determine an influence of the hemolysis on the measure, the variation limit of 10% was chosen. Statistic analysis was done by XLSTAT, therefore the student paired t-test allowed us to compare parameters rates dosed before and after hemolysis. The threshold for statistical significance was 0.05. According to this study, kaliemia positive interference became significant from hemolysis index [+++]: H4 = 1.5 g/dl.
BS 300, Hemolysis, Interference, Kaliemia
1. Introduction
The interference is defined as a source of bias in the concentration measure of an analyte caused by another component or by one property of the sample [1]. Hemolysis is defined as the passage of blood cells constituents in the plasma or in the serum [2]. Hemoglobin released by the erythrocytes was responsible for the reddish staining of the serum or plasma after centrifugation [3, 4]. A high number of second test requests for reasons of non-feasibility of analysis were recorded at Hospital Joseph Ravoahangy Andrianavalona Biochemistry for the dosage of blood electrolyte because the positive interference of hemolysis on the determination of potassium was already known in account of the intra erythrocyte prevalence of potassium. Given the quite urgent nature of the blood electrolyte request, the main reason of this study is to determine from which serum hemolysis index the interference was positive for the kaliemia dosage on automaton BS 300 (Mindray®). The secondary aim was to establish a reliable reporting for the clinicians in front of hemolysed samples for the kaliemia dosage.
2. Materials and Methods
- Constitution of plasma pools
Plasma pools were constituted from the remainders of patients samples collected from laboratory. The plasma was collected after analysis realization. Visibly hemolysed, icterical or lactescent samples including one or several biological results outside the normal range were excluded. The constitution of plasma pools was realized from April 8th to April 12th 2019.
2.2 Overloading of plasma sample
2.2.1 Preparation of hemolysat: Plasma pools consisted of a preparation of the hemolysat from full blood pool obtained on sodium heparinate. These blood samples were centrifuged at 2 500 g during 10 minutes at 25°C on a centrifuge GR4i (Jouan®). Supernatants were expelled and red blood cells collected after plasma removal and the Buffy coat were pooled. Three washes volume to volume of these collected cells were thereafter hemolysed by addition of distilled water volume to volume. A centrifugation at 4000 g enabled to remove cells debris. Therefore we got hemolysat. Then hemoglobin on the hemolysat was measured on semi- automatic spectrophotometer Secomam (BASIC®). The hemoglobin concentration within the hemolysat was adjusted at 12g/dL, then a series of 8 dilutions was realized in order to obtain a concentration range of H1 to H9 ( H1=12g/dL H2=6g/dL H3=3g/dL H4=1.5g/dL H5=0.75g/dL H6=0.37g/dL H7= 0.187g/dL H8=0.093g/dL H9=0.046 g/dL) (Figure 1).
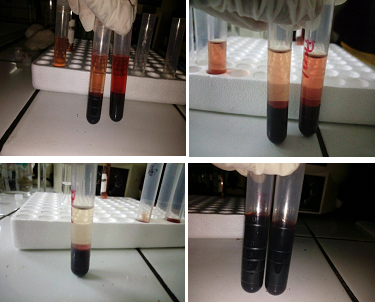
Figure 1: Three volume to volume successive washes of red blood cells and hemolysat process of creation.
From the hemolysat concentration range, hemoglobin overloading was realized by mixing volume to volume the hemolysat of each point of range with plasmas for each studied parameter. And then each parameter was dosed on BS300 (Mindray®). The performing automaton of clinical biochemistry was the automaton BS300 (Mindray®) by Shenzhen Mindray Bio-medical Electronics.
It is an open system including:
- A specimen processing system and the reactive plateau.
- A management system of the reaction mixture with disposal optical bowls.
- A photometric measure system ( UV-Visible photometry and an ISE module).
An information processing system (patients data, calibration and control data) which consists of a computer with the Chemistry Analyzer Software BS300 (Mindray®). The automaton BS300 allows the dosage of routine biochemical parameters such as substrates, electrolytes and enzymatic activities. The principle of kaliemia dosage was the potentiometric method. The validity of measures was guaranteed by the passage of the calibrator and the control before the parameters dosage. The multi-calibrator was a freeze-dried human serum (Multi-calibrator CC/H Chromatest®REF1975005). It was diluted with distilled water according to the provider instructions. The control solutions were freeze-dried. They were diluted with distilled water according to the provider instructions. Only qualified technicians were able to reconstitute them. Two control levels were used, an abnormal one and a pathological one. The choice was made about the 10% threshold of the variation coefficient compared to real value defining a perturbation by American standards [5]. Statistic analysis was done by XLSTAT, therefore the student paired t-test allowed us to compare parameters rates dosed before and after hemolysis. The threshold for statistical significance was 0.05.
2.2.2 Seric indexes measure: Automaton BS300 (Mindray®) was not able to identify the seric index. The correspondence between hemolysis index and hemoglobin concentration was visually determined. This correspondence was carried out by 4 interns in the course of specialization for medical biology, two of them were second year interns and another one was a third-year interns, by three laboratory technicians respectively with 10 years, 6 years and 1-year experiences.
3. Results
3.1 Visual evaluation of hemolysis index
The achieved results were collected and were as follows:
- The hemolysis index [++++] corresponds to a rate of hemoglobin concentration from H1 to H3.
- The hemolysis index [+++] corresponds to H4.
- The hemolysis index [++] corresponds to H5 and H6.
- The hemolysis index [+] corresponds to H7, H8 and H9 (Figure 2, Figure 3).
Its degrees of hemolysis were obtained by the averages of visual evaluations made by all the people involved in the research and then confirmed by a 7 years experienced biologist.
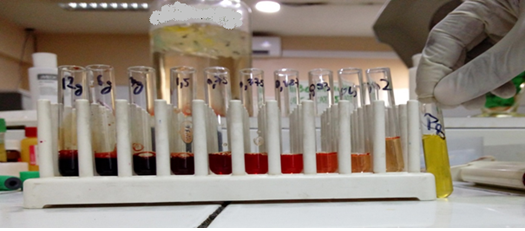
Figure 2: Hemoglobin concentration range.
Source: Biochemistry Joseph Ravoahangy Andrianavalona University Hospital.
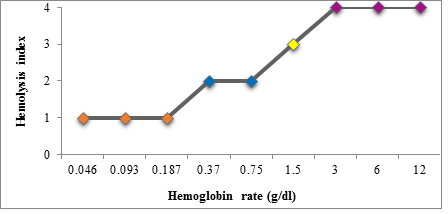
Figure 3: Interference degrees curve (the hemolysis index).
- Hemolysis interference within kaliemia dosage
(Table 1) Showed kaliemia dosage results of each overloaded pool. From hemolysis [+++]: H4=1.5g/dl, the positive interference was significant on kaliemia value. (Table 2) Showed interference of hemolysis on determination analytes.
|
K+(mmol/l) Hb(g/dl) |
1st dosage |
Second dosage |
Third dosage |
Fourth dosage |
Fifth dosage |
Sixth dosage |
Seventh dosage |
Eith dosage |
ninth dosage |
Tenth dosage |
Ave-rage |
|
H1=12 |
19.7 |
20.1 |
19.1 |
19.5 |
19.3 |
19.2 |
20.0 |
19.4 |
19.2 |
19.1 |
19.46 |
|
H2=6 |
12.5 |
12.6 |
12.5 |
12.5 |
12,6 |
12.4 |
12.7 |
12.6 |
12.4 |
12,5 |
12.53 |
|
H3=3 |
9,8 |
9,7 |
9,7 |
9,7 |
9,6 |
9,5 |
9,1 |
9,3 |
9,8 |
8,6 |
9.28 |
|
H4=1,5 |
5,9 |
6.1 |
6.3 |
6,1 |
4,9 |
5 |
5,1 |
5,3 |
5,1 |
5,1 |
5,49 |
|
H5=0,75 |
4,5 |
4,6 |
4,5 |
4,6 |
4,5 |
4.3 |
4.6 |
4.0 |
4,1 |
4,2 |
4.39 |
|
Without any overload |
4,5 |
4,6 |
4,5 |
4,5 |
4,4 |
4,5 |
4,5 |
4,5 |
4,5 |
4,4 |
4,49 |
Table 1: Kaliemia dosage results of each overloaded pool.
|
Hemoglobin rate (g/dl) |
The average of the differences±SD |
p |
|
Hemolysis 0.75 g/dl |
0.1±0.16 |
0.18 |
|
Hemolysis 1.5 g/dl |
-1±0.48 |
<0.0001* |
|
Hemolysis 3 g/dl |
-4.79±0.61 |
<0.0001* |
|
Hemolysis 6 g/dl |
-8.04±0.03 |
<0.0001* |
|
Hemolysis 12 g/dl |
-14.97±0.30 |
<0.0001* |
* significant result
Table 2: Interference of hemolysis on determination analytes.
4. Discussion
For any hemolysis there was no consensus concerning the threshold from which a result was considered as wrong, nevertheless the standard NF EN ISO 15189 enforced the laboratories to assess the interferences impact [6]. In this study, American standards were carried on, the interference threshold was the concentration from which a 10% variation of the value without any interference was observed [5]. According to these requirements, kaliemia positive interference became significant from hemolysis index [+++]: H4 = 1.5g/dl. This result was similar to other studies [4], [7], [8]. At the moment, the majority of automatons are fitted with tools allowing the evaluation of the samples serum hemolysis indexes and the expression of the hemolysis quantitative results for each of the tools has become standardized and automatically expressed in mg/dl. But it is not yet the case for our laboratory. Hence the value of this hemolysis influence study for kaliemia. The decision for not delivering the result in the case of hemolysis index [++++]: from H5 or from a simple comment associated to the latter must be the subject of an agreement with the prescribing physicians within clinical biological contracts.
5. Conclusion
The way to proceed in the case of hemolysed sample must be included in technicians and biologists training. It must be incorporated into the validation and empowerment procedures. The report intended for the clinician must mention the presence of detected interference. The results of indexes measure and/or their interpretation must be clearly stated during the biological validation step.
Acknowledgements
We would like to thank all the staff of the laboratory of University Hospital of Ravoahangy Andrianavalona and all the laboratory technicians. Similarly, we would like to express our gratitude to the director of establishment for authorizing us to carry out this study.
Conflict of interest
None
References
- Wayne, PA. CLSI Interference testing in clinical chemistry. Approved guidelined-second edition.CLSI document EP07-A2. Clinical and Laboratory Standards Institute (2005).
- Benchekroun L, Rtabi N, Guedira A, et al. Hemolysis interference on the determination of the clinical biochemistry parameters. Maroc Médical, tome 29 n°4, décembre (2007).
- Kroll MH, Elin RJ. Interference with clinical laboratory analyses. Clin. Chem 40 (1994): 1996-2005.
- Kroll MH, Ruddel M, Blank DW, RJ Elin. A model for assessing interference. Clin. Chem 33 (1987): 1121 -1123.
- Snyder JA, Rogers MW, King MS, et al. The impact of hemolysis on Ortho-Clinical Diagnostic’s ECi and Roche’s elecsys immunoassay systems. Clin Chim Acta 348 (2004): 181-187.
- Carole Poupon, Guillaume Lefèvre, Sandrine Ngo-François, et al. Hemolysis interferences on frequently required stat analysis: a French multicentric study. Ann Biol Clin 73 (2015): 705-716.
- Frank JJ, Bermes EW, Bickel MJ, et al. Effect of in vitro hemolysis on chemical values for serumClin. Chem 24 (1978): 1966-1970.
- Yucel DD, Dalva K. Effect of in vitro hemolysis on 25 common biochemical tests. Clin. Chem 38 (1992):575-577.