Fei Gao1*, Baptiste Boukebous3, 4, Pozzar Mario1, 2, Alaoui Enora1, 2, Sano Batourou1, 2, Sahar Bayat-Makoei1
1University of Rennes, EHESP, CNRS, Inserm, Research on Health Services and Management, Rennes, France
2University of Rennes, Rennes, France
3ECAMO, UMR1153, Centre of Research in Epidemiology and StatisticS, INSERM, Paris, France
4Hoptial Bichat /Beaujon, APHP, Paris, France
*Corresponding Author: Fei Gao, EHESP School of Public Health, Department of Quantitative Methods for Public Health, Avenue of Professor Léon Bernard, 35043 Rennes, France
Received: 15 March 2022; Accepted: 25 March 2022; Published: 05 April 2022
Background: Recently, many research groups have tried to develop emergency department triage decision support systems based on big volumes of historical clinical data to differentiate and prioritize patients. Machine learning models might improve the predictive capacity of emergency department triage systems. The aim of this review was to assess the performance of recently described machine learning models for patient triage in emergency departments, and to identify future challenges.
Methods: Four databases (ScienceDirect, PubMed, Google Scholar and Springer) were searched using key words identified in the research questions. To focus on the latest studies on the subject, the most cited papers between 2018 and October 2021 were selected. Only works with hospital admission and critical illness as outcomes were included in the analysis.
Results: Eleven articles concerned the two outcomes (hospital admission and critical illness) and developed 55 predictive models. Random Forest and Logistic Regression were the most commonly used prediction algorithms, and the receiver operating characteristic-area under the curve (ROC-AUC) the most frequently used metric to assess the algorithm prediction performance. Random Forest and Logistic Regression were the most discriminant models according to the selected studies.
Conclusions: Machine learning-based triage systems could improve decision-making in emergency departments, thus leading to better patients’ outcomes. However, there is still scope for improvement concerning the prediction performance and explicability of ML models.
Triage, Emergency Department/Emergency Room, Machine Learning, Modeling,Model, Classification,Predictive, Artificially Intelligence, Decision Support Systems, Patient Prioritization
1. Background
Emergency departments (ED), where diagnostic and therapeutic interventions must be executed rapidly and effectively [1], are one of the biggest sources of hospitalization [2, 3]. On arrival at the ED, patients are first classified according to the severity of their condition, in order to prioritize those requiring immediate medical intervention. This triage is usually performed by a nurse on the basis of the patients’ vital signs and main complaint [4-5]. Recently, there has been increased interest in developing ED triage decision support systems based on big volumes of historical clinical data to differentiate and prioritize patients. Several studies showed that machine learning (ML) prediction models are valuable for improving ED triage of patients [3, 6-10]. The aim of this review was to assess the performance of recently described ML models used for patient triage in ED, and to identify the future challenges.
2. Method
2.1 Study search and eligibility criteria
Four databases (ScienceDirect, PubMed, Google Scholar and Springer) were manually searched using key words (“triage”, “emergency department”/ “emergency room”, “machine learning”, “modeling”, “model”, “classification” ,“predictive”, “artificially intelligence”, “decision support systems”, “patient prioritization”) identified in the research questions , as done in previous studies [11-16]. Studies were selected in two steps. First, studies published between 2018 and October 2021, with the highest number of citations, and with hospital admission and/or critical illness as outcomes were pre-selected. Then, the final selection was based on sample size, number and type of feature variables, type of model (s) constructed, and programming language/statistical tools.
3. Results
3.1 Study selection
First, 19 papers published between 2018 and October 2021 were pre-selected. Their characteristics are summarized in Table 1. Then, 11 studies were analy-zed in detail (final selection: highlighted in Table 1): six studies performed in the USA (one included data from USA and Portugal), two in Korea, one in the Netherlands, one in Northern Ireland, and one in Australia.
3.2 Data sample and predictors
In all selected articles, the study population conce-rned patients visiting the ED, with the exception of the article by Kim et al. in which the study focused on the prehospital environment [17]. Sample sizes varied from ~20,000 to ~3,000,000 individuals. Figure 1 summarizes the variables used to build the ML models in each study. Hong et al. [18] included 972 explanatory variables, while the other articles used fewer than 20 predictors. Although the data used for the ML model implementation were specific to each study, several common categories could be identified, such as demographic variables (age and sex), clinical variables (vital signs and diagnosis), arrival information (time and transport mode), ED visit outcome (hospital admission or discharge). Hong et al., Raita et al. and Araz et al. took into account also the Emergency Severity Index [19, 18, 20]. Seven articles linked data to the common main complaints, but only Goto et al. [21] included information on comorbidities. Less than half of the articles presented information on the use of hospital metrics (e.g. number of previous ED visits and number of previous hospitalizations). Only Hong et al. [18], Rendell et al. [22] and Levin et al. [23] included the patients’ past medical history. Hong et al. [18] and De Hond et al. [24] added also information on historical laboratory test results, and imaging and electrocardiogram exams. For each article, the included variables are shown by a green diamond. Variables that were not included (or not available) and variables for which no clear information was found are shown with red and gray diamonds, respectively.
3.3 Machine learning process
3.3.1 Candidate variable handling and feature engineering: In the majority of the selected studies, all variables were included in the implemented models (Figure 2). Rendell et al. [22], Kwon et al. [25], Fernandes et al. [26] and Araz et al. [19] used Stepwise or Correlation-based methods for feature selection to reduce the number of input variables. When building a predictive model, it is often possible to improve its predictive performance by trans-forming variables. The most common transformation methods include categorization (e.g. bucketing, binning), interactions, and polynomial or spline transformation for numerical variables. Only Rendell et al. proposed predictor interactions features [22]. None of the authors used polynomial or spline transformation. Levin et al. [27] and Kim et al. [17] did not provide any clear information on the variables retained in their models.
3.3.2 Data resampling: In most articles, the datasets were randomly partitioned into training and test datasets (Table 1). The percentage of data contained in each dataset differed among studies (e.g. 90:10 in the study by Hong et al. [18], and 70:30 in the study by Raita et al. [20]). Levin et al. used the boot-strapping resampling technique [23]. Nine studies used the cross-validation method to validate the model performance or to tune hyperparameters, which helps to avoid the risk of overfitting or underfitting [28, 29].
3.3.3 Prediction algorithms and calibration of hyperparameters: In total, 55 models were used to predict hospital admission or critical illness outcomes (Figure 3). Random Forest and Logistic Regression were the two most widely used models (n=9/11 articles), followed by Gradient Boosting and Deep Neural Network models (n=6/11 studies). Conv-ersely, some models were only used in one study: K-Nearest Neighbors and Naive Bayes (Rendell et al. [30]), Support Vector Machine (Araz and al. [19]), and Random Under Sampling Boost (Fernandes et al. [26]). Among the used tools, R and Python were the most common, followed by Matlab and the SQL language. With the exception of the articles by Rendell et al. [30] and Levin et al. [27], in all other studies at least one hyperparameter was calibrated, depending on the method used.
3.3.4 Evaluation metrics: The metrics used to evaluate the performance of the different models (Figure 4) included the F1 score, the receiver operating characteristic-area under the curve (ROC-AUC), sensitivity and specificity, and accuracy. The sensitivity and specificity and ROC-AUC metrics were the most used.
3.3.5 Model agnostic methods: Most authors used Logistic Regression coefficients to identify signify-cant variables. For models that cannot be interpreted directly, such as Random Forests, Gradient Boosting and Neural Networks, the Permutation Feature Importance model-agnostic method was used in seven studies to identify the variables that most contributed to discrimination [17, 18, 20, 21, 24, 26, 27]. This method assesses the predictor importance by measuring the increase of the prediction error when the feature values are permuted.
3.4 Model performance assessment
3.4.1 Hospitalization outcome: In the selected studies, 44 models were developed (Table 1) with hospital admission as outcome. Figure 5 illustrates the performance of the prediction models based on the C-statistic method (AUC). Gradient Boosting was the most discriminant (median AUC = 0.860 and interquartile ranges (IQR) = 0.859-0.863), compared with Logistic Regression (median AUC = 0.840, IQR = 0.815-0.850) and Single Layer Neural Networks (median AUC = 0.825, IQR = 0.820-0.830), and also Deep Neural Networks and K-Nearest Neighbors (median AUC = 0.82 for both, IQR = 0.800-0.860 and 0.815-0.850, respectively).
3.4.2 Critical illness: Eleven models used critical illness as outcome measure (Figure 6). Deep Neural Networks displayed the best performance in differentiating between patients with and without a critical illness (median AUC = 0.875, IQR = 0.857-0.895), followed by Random Forest (median AUC = 0.870, IQR = 0.850-0.881), Logistic Regression (median AUC = 0.851, IQR = 0.846-0.860), and GradientBoosting (median AUC = 0.840, only one model). Figure 7 shows the most relevant variables according to the Permutation Feature Importance model-agnostic method: age, sex, mode of transport to the ED, vital signs, and common chief complaints. For each article, the significant variables are shown by green diamonds. Not relevant variables and variables for which no clear information on their relevance was given in the selected articles are indicated by red and gray circles with a cross, respectively.
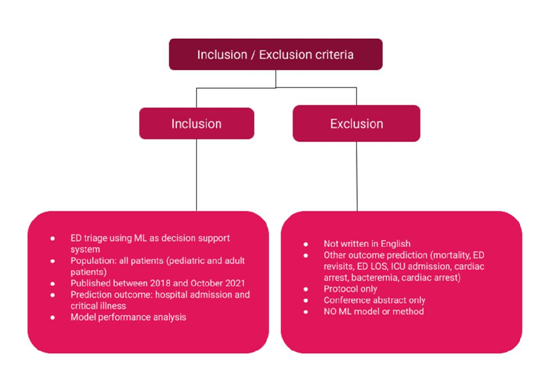
Figure 1: Predictors/candidate variables included in the selected articles.
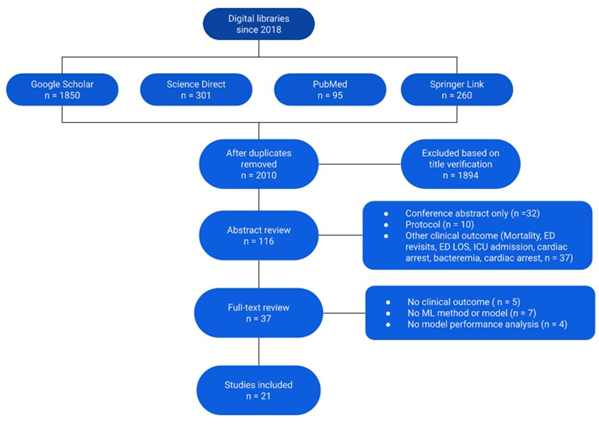
Figure 2: Candidate variable handling and feature engineering for model building in the different studies. Green diamond, yes; red circle with a cross, no; gray circle with a cross, no clear information.
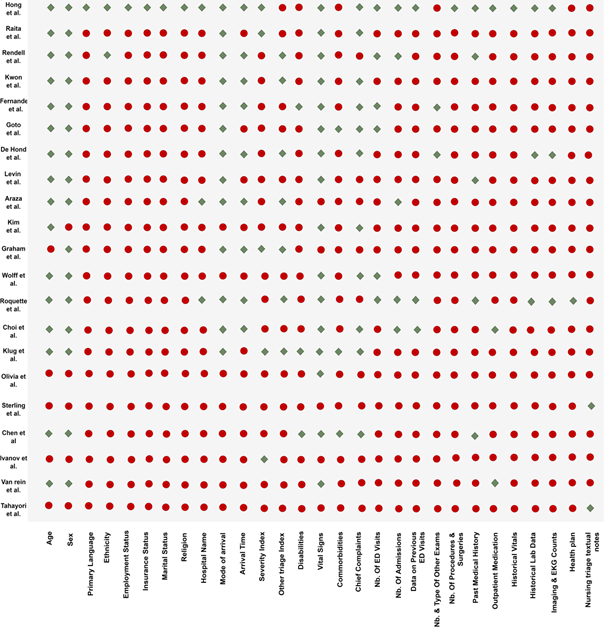
Figure 3: Algorithms used in the selected studies. Green diamond, algorithm used in that study; red circle with a cross, not used in that study.
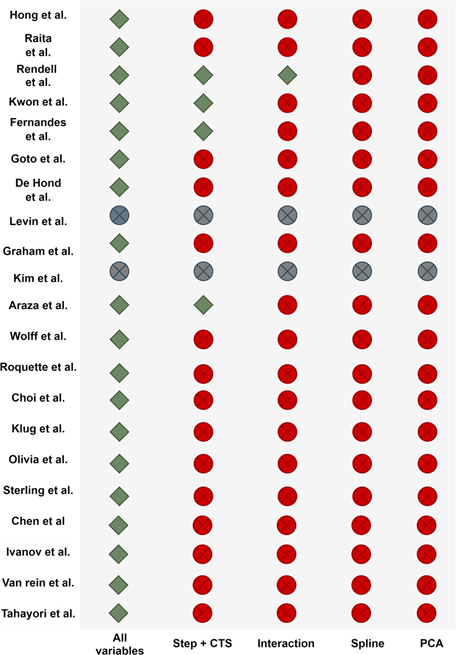
Figure 4: Evaluation metrics used in the included studies.
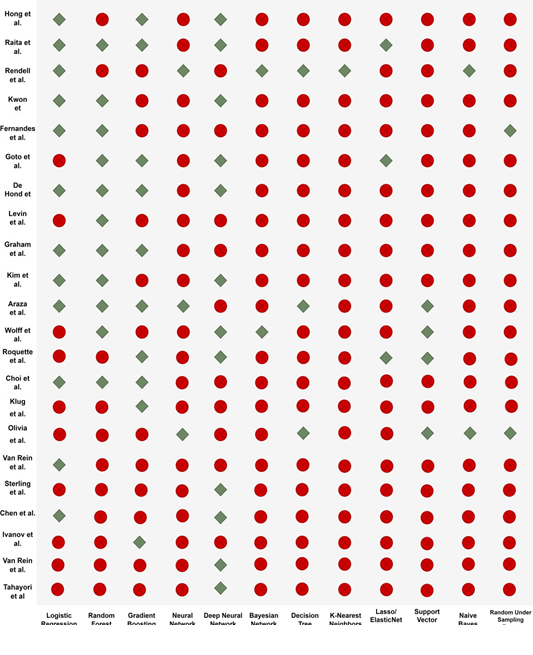
Figure 5: C-statistic of the algorithms used to predict hospitalization.
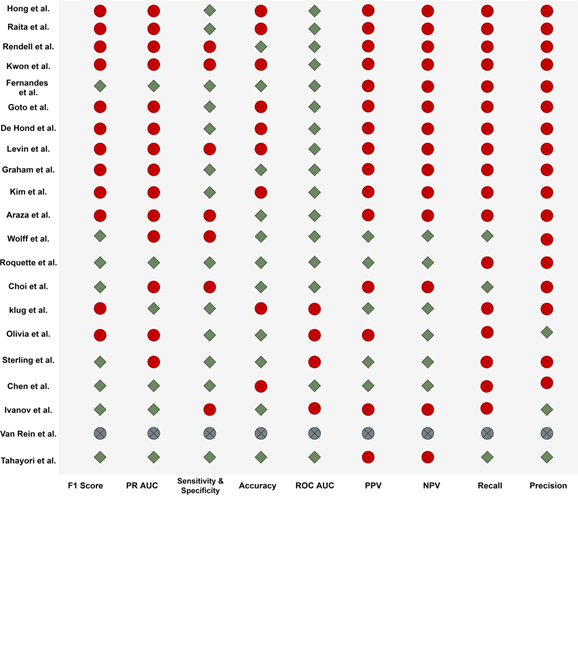
Figure 6: C-statistic of the algorithms used to predict critical illness.
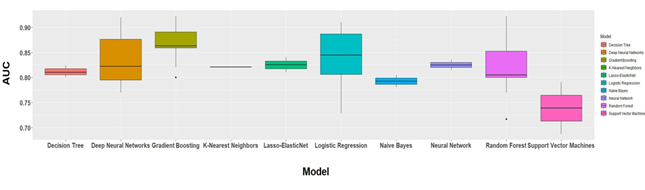
Figure 7: Relevant variables.
 |
Table 1: Characteristics of the selected articles.
4. Discussion
The objective of these studies that developed ED triage algorithms was to propose decision support systems to help health professionals in prioritizing high-risk patients. As mentioned in previous review articles [17-21, 25-27, 31], the reference standard on which ED triage is currently based, such as the Emergency Severity Index, can hardly recognize critically ill patients. Indeed, it is hard to deal with such detailed data on the little time available. Advanced artificial intelligence (AI) models based on big volumes of historical clinical data may allow overcoming this obstacle.
The aim of the present review was to identify the tools needed to build robust and efficient prediction algorithms that offer higher discrimination perfor-mance than the reference standard models. The eleven recent and most cited studies from 2018 to October 2021, selected for this review, described ML-based decision support systems to improve patient triage in ED. Two outcomes were selected: hospital admission and critical illness. The most common methods were Random Forest and Logistic Regression (12 models/each), followed by Gradient Boosting (11 models) and Deep Neural Networks (10 models).
The objective of this review was not only to describe the developed methods and techniques, but also to identify possible improvements. A common problem with the selected studies was that they did not describe in detail or did not report their feature engineering process. Only one study mentioned that they took into account the predictor interactions [30]. No study explained how they would model non-linear numerical predictors and non-linear relationships (e.g. polynomials or splines). Furthermore, nine of the included studies mentioned that they took into account the hyperparameter calibration [18-21, 24, 26, 31]. However, the majority did not explain the rationale behind the choice of calibration method and did not include the results of this analysis. Yet, the calibration result analysis might be crucial during the development of a transportable model that needs to be adapted to new settings [10, 38-40].
Many authors mentioned the necessity to offer the widest possible range of prediction approaches. For example, Rendell et al. highlighted the different advantages of each ML algorithm and emphasized that these algorithms overcome the limitations of more traditional regression techniques by offering both linear and non-linear decision forms. However, in our selected studies, only two studies implemented six models [19, 22], and most proposed only three to four prediction algorithms. Lastly, model-agnostic interpretation methods help to understand how features can affect the model prediction. They are flexible and can be applied to any ML model to find new patterns and to know more about the dataset [41-43]. In the selected studies, the authors used exclusively the Permutation Feature Importance method to identify relevant features. Other methods, such as Partial Dependence Plot, Accumulated Local Effect Plots, Feature interaction (H-statistic), Functional Decomposition, and Global Surrogate Models, could be investigated in future works to identify predictors that might affect the patient triage prediction [41].
5. Conclusion
This review found that combining machine learning with historical clinical data for patient triage in ED has a clear advantage over the reference standard currently in use. However, there is still scope for improvement to enhance the prediction performance and explicability of ML models: 1) integration of predictors’ interactions and non-linear relationships; 2) precise information on hyperparameter calibration to make models more transportable, and 3) more studies on the different model-agnostic interpretation methods to identify predictors that affect the triage process. The goal is to optimize the patient flow in order to improve their management, reduce waiting time, and efficiently use resources [44, 45].
Declarations
Ethics approval and consent to participate
Not applicable
Consent for publication
Not applicable
Availability of data and material
All data generated or analyzed during this study are included in this published article. If readers need supplementary information, they can contact me (fei.gao@ehesp.fr).
Competing interests
The authors declare that they have no competing interests.
Funding
Not applicable.
Authors’ contributions
FG designed the project, performed the statistical analysis and drafted the manuscript. SD supervised the overall project, oversaw the statistical analysis, and helped to draft and revised the manuscript. CL, KK and MG performed the statistical analysis with FG and SD. BB gave important suggestions to this study. All authors interpreted the data and reviewed the manuscript for important intellectual content. All authors have read and approved the final version of the manuscript.
Acknowledgements
This research is supported by EHESP Rennes, Univ Rennes, EHESP, CNRS, Inserm, Arènes - UMR 6051, RSMS - U 1309, ECAMO, Hoptial Bichât - APHP and ENSAI. Points of view or opinions in this article are those of the authors and do not necessarily represent the official position or policies of the EHESP Rennes, UMR 6051, RSMS - U 1309, ECAMO, Hoptial Bichât - APHP and ENSAI.
References
- Shafaf N, Malek H. Applications of Machine Learning Approaches in Emergency Medic-ine; a Review Article. Arch Acad Emerg Med 7 (2019): 34.
- Greenwald PW, Estevez RM, Clark S, et al. The ED as the primary source of hospital admission for older (but not younger) adults. Am J Emerg Med 34 (2016): 943-947.
- Oberlin M, Andrès E, Behr M, et al. La saturation de la structure des urgences et le rôle de l'organisation hospitalière : réflexions sur les causes et les solutions [Emergency overcrowding and hospital organization: Causes and solutions]. Rev Med Interne 41 (2020): 693-699.
- Gottlieb M, Farcy DA, Moreno LA, et al. Triage Nurse-Ordered Testing in the Emergency Department Setting: A Review of the Literature for the Clinician. J Emerg Med 60 (2021): 570-575.
- Nevill A, Kuhn L, Thompson J, et al. The influence of nurse allocated triage category on the care of patients with sepsis in the emergency department: A retrospective review. Australas Emerg Care 24 (2021): 121-126.
- Stewart J, Sprivulis P, Dwivedi G. Artificial intelligence and machine learning in emerg-ency medicine. Emerg Med Australas 30 (2018): 870-874.
- Blomberg SN, Christensen HC, Lippert F, et al. Effect of Machine Learning on Dispatcher Recognition of Out-of-Hospital Cardiac Arrest During Calls to Emergency Medical Services: A Randomized Clinical Trial. JAMA Netw Open 4 (2021): e2032320.
- Choi SW, Ko T, Hong KJ, et al. Machine Learning-Based Prediction of Korean Triage and Acuity Scale Level in Emergency Department Patients. Healthc Inform Res 25 (2019): 305-312.
- Salman OH, Taha Z, Alsabah MQ, et al. A review on utilizing machine learning techno-logy in the fields of electronic emergency triage and patient priority systems in tele-medicine: Coherent taxonomy, motivate-ons, open research challenges and recomme-ndations for intelligent future work. Comput Methods Programs Biomed 209 (2021): 106357.
- Miles J, Turner J, Jacques R, et al. Using machine-learning risk prediction models to triage the acuity of undifferentiated patients entering the emergency care system: a syste-matic review. Diagn Progn Res 4 (2020): 16.
- Pombo N, Araújo P, Viana J. Knowledge discovery in clinical decision support systems for pain management: a systematic review. Artif Intell Med 60 (2014): 1-11.
- Fernandes M, Vieira SM, Leite F, et al. Clinical Decision Support Systems for Triage in the Emergency Department using Intelli-gent Systems: a Review. Artif Intell Med 102 (2020): 101762.
- Pereira CR, Pereira DR, Weber SA, et al. A survey on computer-assisted parkinson's disease diagnosis. Artificial intelligence in medicine (2018).
- Haddaway NR, Collins AM, Coughlin D, et al. The role of google scholar in evidence reviews and its applicability to grey literature searching. PloS one 10 (2015): e0138237.
- Lidal IB, Holte HH, Vist GE. Triage systems for pre-hospital emergency medical services-a systematic review. Scandinavian journal of trauma, resuscitation and emergency medic-ine 21 (2013): 28.
- Belard A, Buchman T, Forsberg J, et al. Precision diagnosis: a view of the clinical decision support systems (CDSS) landscape through the lens of critical care. Journal of clinical monitoring and computing 31 (2017): 261-271.
- Kim D, You S, So S, et al. A data-driven artificial intelligence model for remote triage in the prehospital environment. PLOS (2018).
- Hong W S, Haimovich A D, Taylor R A. Predicting hospital admission at emergency department triage using machine learning. PLOS (2018).
- Araz O M, Olsona D, Ramirez-Nafarrateb A. Predictive analytics for hospital admissions from the emergency department using triage information. International Journal of Produ-ction Economics (2019): 199-207.
- Raita Y, Goto T, Faridi M K, et al. Emergency department triage prediction of clinical outcomes using machine learning models - Critical Care. Critical Care (2019).
- Goto T, Camargo Jr C A, Faridi M K, et al. Machine Learning-Based Prediction of Clinical Outcomes for Children During Emergency Department Triage. Jama Network Open (2019).
- Roquette B P, Nagano H, Marujo E C, et al. Prediction of admission in pediatric emergency department with deep neural networks and triage textual data. Neural Networks (2020): 170-177.
- Levin S, Toerper M, Hamrock E, et al. Machine-Learning-Based Electronic Triage More Accurately Differentiates Patients With Respect to Clinical Outcomes Compared With the Emergency Severity Index. Ann Emerg Med 71 (2018): 565-574.e2
- De Hond A, Raven W, Schinkelshoek L, et al. Machine learning for developing a prediction model of hospital admission of emergency department patients: Hype or hope?. International Journal of Medical Informatics (2021).
- Kwon J, Jeon K-H, Lee M, et al. Deep Learning Algorithm to Predict Need for Critical Care in Pediatric Emergency Departments. Pediatric Emergency Care (2019).
- Fernandes M, Mendes R, VieiraI S M, et al. Predicting Intensive Care Unit admission among patients presenting to the emergency department using machine learning and natural language processing. PLOS (2020).
- Levin S, Toerper M, Hamrock E, et al. Machine-Learning-Based Electronic Triage More Accurately Differentiates Patients With Respect to Clinical Outcomes Compared With the Emergency Severity Index. Ann Emerg Med 71 (2018): 565-574.e2
- Jabbar H, Khan RZ. Methods to avoid over-fitting and under-fitting in supervised machine learning (comparative study). Computer Science. Communication and Instrumentation Devices (2015).
- Lei J. Cross-validation with confidence. Journal of the American Statistical Associ-ation 115 (2020): 1978-1997.
- Rendell K, Koprinska I, Kyme A, et al. The Sydney Triage to Admission Risk Tool (START2) using machine learning techniques to support disposition decision-making. Emergency Medicine Australasia (2018).
- Graham B, Bond R, Quinn M, et al. Using Data Mining to Predict Hospital Admissions From the Emergency Department. IEEE Access 6 (2018): 10458 - 10469.
- Klug M, Barash Y, Bechler S, et al. A Gradient Boosting Machine Learning Model for Predicting Early Mortality in the Emergency Department Triage: Devising a Nine-Point Triage Score. Journal of General Internal Medicine (2019): 220-227.
- Nemati S, Holder A, Razmi F, et al. An Interpretable Machine Learning Model for Accurate Prediction of Sepsis in the ICU. Critical Care Medicine (2018).
- Olivia D, Nayak A, Balachandra M. Machine learning based electronic triage for emergency department. Springer (2018).
- Sterling N W, Patzer R E, Di M, et al. Prediction of emergency department patient disposition based on natural language processing of triage notes. International Journal of Medical Informatics (2019): 184-188.
- van Rein E A J, van der Sluijs R, Voskens F J, et al. Development and Validation of a Prediction Model for Prehospital Triage of Trauma Patients. Jama Surgery (2019).
- Wolff P, Ríos S A, Graña M. Setting up standards: A methodological proposal for pediatric Triage machine learning model construction based on clinical outcomes. Expert Systems with Applications (2019).
- Jon J Williams, Luciana S Esteves. Guidance on Setup, Calibration, and Validation of Hydrodynamic, Wave, and Sediment Models for Shelf Seas and Estuaries, Advances in Civil Engineering (2017).
- Tomasz Konopka. Correcting machine learning models using calibrated ensembles with ‘mlensemble’. bioRxiv (2021).
- Fehr J, Piccininni M, Kurth T, et al. A causal framework for assessing the transportability of clinical prediction models. medRxiv (2022).
- Molnar C. Interpretable Machine Learning: A Guide for Making Black Box Models Explainable (2nd ed.) (2022).
- Liu X, Taylor MP, Aelion CM, et al. Novel Application of Machine Learning Algorithms and Model-Agnostic Methods to Identify Factors Influencing Childhood Blood Lead Levels. Environ Sci Technol. 55 (2021): 13387-13399.
- Neves I, Folgado D, Santos S, et al. Interpretable heartbeat classification using local model-agnostic explanations on ECGs. Comput Biol Med 133 (2021): 104393.
- Barnes S, Hamrock E, Toerper M, et al. Real-time prediction of inpatient length of stay for discharge prioritization. Journal of the American Medical Informatics Association (2015): e2-e10.
- Fairley M, Scheinker D, Brandeau ML. Improving the efficiency of the operating room environment with an optimization and machine learning model. Health Care Manag Sci 22 (2019): 756-767.