Sawhney JPS1, Abraham Oomman2, Ponde CK3, Dhiman Kahali4, Nakul Sinha5, Sameer Chaudhari6, Pallavi Kawatra7, Girish Navasundi8
1Chairman, Cardiology, Sir Ganga Ram Hospital, Delhi, India
2Senior Consultant Cardiologist, Apollo Hospitals, Greams Road, Chennai, India
3Section Head, Invasive and non-invasive Cardiology, PD Hinduja Hospital and Medical Research center, Mahim, Mumbai- 400016
4Director of Interventional Cardiology, BM Birla Heart Research Center, Kolkata
5Chairman, Cardiology, Max Hospital, Lucknow
6Senior Medical Lead, Novartis Healthcare Pvt Ltd, Mumbai, India
7Franchise Medical Head, Novartis Healthcare Pvt Ltd, Mumbai, India
8Director of Cathlab, Senior Interventional Cardiologist, Apollo hospital, BG road, Bangalore – 560076
*Corresponding author: Pallavi Kawatra. Franchise Medical Head, Novartis Healthcare Pvt Ltd, Mumbai, India.
Received: 09 August 2026; Accepted: 19 August 2026; Published: 21 August 2026
Background: Lipoprotein(a) [Lp(a)] is a genetically determined and independent risk factor for atherosclerotic cardiovascular disease (ASCVD). South Asians, particularly Indians have a greater burden of premature cardiovascular disease. However, prevalence and distribution of elevated Lp(a) levels across Indian populations remain scattered and inconsistently reported.
Objective: To systematically evaluate the prevalence and distribution of elevated Lp(a) in Indian adults across healthy populations and various clinical conditions.
Methods: A systematic search of electronic databases was conducted to identify studies reporting Lp(a) levels in Indian adults. Randomized controlled trials (RCTs), post hoc analyses, and all observational investigations, including cross-sectional, cohort, and registry-based studies, retrospective studies, conference abstracts evaluating Lp(a) concentrations in healthy Indian individuals or Indian patients with cardiovascular or metabolic conditions were included.
Results: A total of 53 studies comprising 20,486 Indian adults were included in the qualitative synthesis. Mean Lp(a) levels in healthy or control Indian populations ranged from 6.68 to 33.51 mg/dL, with median levels typically between 12–20 mg/dL. Among Indian patients with coronary artery disease, the prevalence of elevated Lp(a) levels >30 mg/dL ranged from 32% to 70%, with some studies reporting Lp(a) ≥50 mg/dL in 34% and 37% of Indian patients with ACS and ASCVD, respectively. Elevated Lp(a) levels were also reported in Indian patients with dyslipidemia, stroke, diabetes, and familial hypercholesterolemia.
Conclusion: Indian adults have a high burden of elevated Lp(a) across both healthy and clinical populations. These findings highlight the need for greater awareness and broader implementation of Lp(a) testing to improve cardiovascular risk stratification in India.
Lipoprotein(a); Cardiovascular disease; Dyslipidemia; Prevalence; Atherosclerotic cardiovascular disease; Systematic review
Lipoprotein(a) articles; Cardiovascular disease articles; Dyslipidemia articles; Prevalence articles; Atherosclerotic cardiovascular disease articles; Systematic review articles.
Introduction
Atherosclerotic cardiovascular disease (ASCVD) is a major cause of morbidity and mortality worldwide, with cardiovascular diseases (CVD) responsible for nearly 17.9 million deaths annually [1]. South Asians, particularly Indians, suffer from premature and more severe ASCVD compared to other ethnicities, often manifesting at younger ages and lower body mass indices [2]. The incidence of acute myocardial infarction (MI) is reported to be three- to fivefold higher among young Indians compared with individuals from other ethnic groups [3]. This excess burden and early manifestation in young Indians are not fully explained by traditional cardiovascular (CV) risk factors, which has triggered increasing interest in non-traditional and emerging risk markers [3].
Lipoprotein (a) [Lp(a)] is an inherited, independent, and causal risk factor for ASCVD, and has also been associated with premature coronary artery disease (CAD) [3]. Elevated Lp(a) concentrations are frequently observed among Indians with aggressive or malignant forms of CAD [3,4]. High Lp(a) levels confer a two- to threefold increased risk of developing CAD [3,5]. Moreover, Lp(a) is considered substantially more atherogenic than LDL-C, with evidence suggesting that, on a particle-for-particle basis, Lp(a) may be up to six times more atherogenic due to its unique apolipoprotein(a) component [6]. Among different ethnic groups, South Asians have the second highest Lp(a) concentrations and the greatest risk of acute MI attributable to elevated Lp(a) [3]. While Lp(a) levels ≥50 mg/dL are widely considered as high and clinically significant, with increased risk of premature and aggressive ASCVD, emerging expert opinions suggest that lower thresholds may also be clinically relevant [7-11]. In an Indian expert consensus, panelists emphasized that Lp(a) levels >30 mg/dL are associated with an increased risk of CV events and should be incorporated into CV risk assessment, particularly in high-risk populations [11].
Despite its clinical relevance and recommendations by major guidelines for Lp(a) testing in high-risk opulations and once in a lifetime, routine testing for Lp(a) is low worldwide and particularly in India, both in the general population and in patients with established ASCVD [12,13]. Considering the fact that measuring Lp(a) can help to identify patients who may benefit from more aggressive risk factor optimization, including intensification of treatment, low testing frequency is concerning [14]. In fact, Lp(a) testing can improve CV risk stratification, especially in individuals with very high Lp(a), and increases CVD risk prediction, allowing re-classification of individuals or patients into higher risk categories who may otherwise not meet guideline criteria for lipid-lowering therapy [8,15].
Despite compelling evidence that elevated Lp(a) is a causal and independent CV risk factor, its epidemiologic profile in India is poorly defined. Systematic data on Lp(a) levels and prevalence in Indian populations are fragmented. No prior systematic review has comprehensively synthesized Indian evidence across diverse clinical groups. In the context of India’s disproportionately high rates of premature ASCVD and the growing relevance of therapies that lower Lp(a), a rigorous synthesis of all available Indian data is essential. This systematic review addresses these gaps by providing the first consolidated estimation of Lp(a) burden, and disease-specific patterns in Indian adults, thereby generating evidence needed to inform screening policies, improve risk stratification, and guide future therapeutic decision-making.
Methods
This study is designed as a systematic review of published literature and eligible conference abstracts reporting Lp(a) levels in Indian populations. The study was conducted in accordance with the updated Preferred Reporting Items for Systematic Reviews and Meta-Analyses (PRISMA) 2020 Guidelines.[16] The review protocol was prospectively registered with the International Prospective Register of Systematic Reviews (PROSPERO) under the registration number CRD420251228987. This study aims to determine the prevalence and distribution of elevated Lp(a) levels (>30 mg/dL, >50 mg/dL, >70 mg/dL) in Indian populations; to compare mean/median Lp(a) levels across clinical subgroups (ASCVD, diabetes, stroke, familial hypercholesterolemia (FH), and healthy individuals); and to evaluate demographic variation in Lp(a) levels.
Search Strategy
A comprehensive search was conducted in the following electronic databases: PubMed/MEDLINE, EMBASE, Scopus, Web of Science, Cochrane Central Register of Controlled Trials (CENTRAL), and Google Scholar (first 200 results) for grey literature. Additionally, literature was identified through conference proceedings and abstract repositories of Cardiological Society of India (CSI), Lipid Association of India (LAI), European Society of Cardiology (ESC), American College of Cardiology (ACC), and European Atherosclerosis Society (EAS). The search strategy focused on studies reporting Lp(a) levels in Indian populations, published between January 1, 2000, and July 31, 2025. A combination of controlled vocabulary (e.g., MeSH terms) and free-text keywords was used to maximize retrieval sensitivity.
Eligibility Criteria
Inclusion Criteria
Population: Indian adults (≥18 years), including both healthy individuals and patients with established or high risk for ASCVD, diabetes mellitus, stroke, familial hypercholesterolemia, or other CV conditions, in whom Lp(a) levels have been measured.
Intervention / Exposure: Measurement and reporting of Lp(a) levels.
Comparator(s) or control(s): Patients tested vs not tested within the same study population; Lp(a) levels in patients with ASCVD, diabetes, stroke, familial hypercholesterolemia, healthy individuals; demographic factors such as age groups, and sex.
Study Designs: We included randomized controlled trials (RCTs), post hoc analyses, and observational investigations, including cross-sectional, cohort, and registry-based studies, retrospective studies, and conference abstracts that reported measured Lp(a) levels in Indian populations. Studies were eligible if they provided prevalence estimates of normal, or elevated Lp(a), mean or median Lp(a) levels, either overall or stratified by clinical subgroups.
Language: Only studies published in English were considered.
Exclusion criteria
Case reports, case series, letters to the editor, narrative reviews, systematic reviews, and meta-analyses; studies conducted in non-Indian populations, or where Indian data could not be extracted separately; and studies conducted in children or adolescents (<18 years), animal models, and those reporting only genetic determinants of Lp(a) without actual plasma level measurements.
Outcome measures
The outcomes included prevalence of elevated Lp(a) levels at defined thresholds (e.g., >30 mg/dL, >50 mg/dL, or >70 mg/dL), and mean/median Lp(a) levels across different populations and clinical groups.
Data Extraction
Two reviewers independently screened all retrieved studies by titles and abstracts, followed by full-text evaluation of potentially relevant studies against predefined inclusion and exclusion criteria. Discrepancies in study selection or data interpretation were resolved through discussion or consultation with a third reviewer. For each eligible study, data were extracted using a standardized form. All extracted data were cross-verified for accuracy and completeness before inclusion in the final evidence synthesis.
Quality assessment
Risk of bias and methodological quality were appraised independently by two reviewers for all included studies, with disagreements resolved by discussion or a third reviewer. We used design-appropriate, validated tools. For randomized controlled trials, Cochrane Risk of Bias 2 (RoB-2) was used [17]. Cross-sectional studies were assessed using Joanna Briggs Institute (JBI) critical appraisal tool of 8 items [18]. Observational studies underwent evaluation with Newcastle Ottawa Scale (NOS) (ranging for 0-9) [19].
Results
Search results
A total of 208 articles were initially retrieved through the database search. After screening titles and abstracts, 150 articles were selected for full-text review, along with three conference abstracts. Following full-text assessment, 97 studies were excluded for the following reasons: not conducted in Indian population (n=26), study design did not match inclusion criteria (n=26), involved pediatric population (n=1), Lp(a) assessment either not undertaken or performed in a heterogeneous population (n=41), non-English publication (n=1), full text unavailable (n=1), and duplicate publication (n=1). Overall, 50 studies met the predefined eligibility criteria and were included in the qualitative synthesis [2,4,20-28,30-47,49-69]. In addition, three eligible conference abstracts published in peer-reviewed journals were also included in this review [29,48,70]. Thus, a total of 53 records reporting Lp(a) data in Indian population, including healthy individuals, patients with various clinical conditions, and individuals of Indian origin residing outside India were included in the final analysis (Figure 1). The findings presented in the subsequent sections relate to Indian populations included in this review, comprising both individuals residing in India and, where applicable, populations of Indian origin residing outside India.
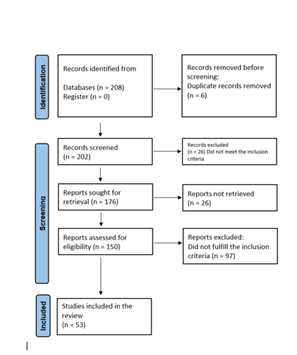
Figure 1: PRISMA flow diagram of included studies.
Study characteristics
A total of 53 studies with 20,486 Indian participants were analyzed.[2,4,20–70] Most studies were observational studies; case-control (n=24), [4,22,23,27,32,34,35,37,41-44,46,47,49-51,56,57,61,65,66,68,69] cross-sectional (n=18), [2,21,24,25,33,38,39,45,52,54,55,58-60,62-64,67] retrospective cohort (n=3), [20,28,36] prospective (n=2), [30,53] retro-prospective registry (n=1), [26] pre-post intervention (n=1), [40] and randomized clinical trial (n=1) [31]. For three studies, the study design was not reported (Table 1) [29,48,70]. The mean age of patients ranged from 20 years to 56 years. The study cohort predominantly comprised men, with 53.49% males (n=10,957) and 18.02% (n=3,692) females. For 5,837 participants, sex distribution was not provided. The majority of studies (n=48) were conducted in a hospital setting, 4 studies were community-based, [2,45,52,67] and one reported data from both hospital and community settings [54]. Clinical populations most frequently included ASCVD (n=5,914), CAD (n=3,616), type 2 diabetes (T2D) (n=2,066), and acute coronary syndrome (ACS) (n=1,717), cohorts, followed by MI (n=1,199), CHD (n=560), dyslipidemia (n=200), stroke (n=214), FH (n=181), and hypertension (n=100) groups. Lp(a) concentrations were variably reported as mean, median, or percentage above predefined thresholds (Table 1). Units were reported mainly in mg/dL; a few studies used nmol/L or ng/mL. Although prevalence of elevated Lp(a) levels >70 mg/dL was a predefined outcome, none of the included studies reported prevalence estimates using this threshold.
Lipoprotein (a) Assessment in Healthy Indian Individuals / Controls
A total of 32 studies (n=4016) included Lp(a) assessment data from a healthy Indian population.[2,4,22,24,27,32,34-37,41-47,49-52,54-57,61,62,65-69]. The healthy Indian individuals presented with mean Lp(a) levels ranging from 6.68 ± 3.4 mg/dL to 33.51 ± 23.0 mg/dL (Table 1) [2,22,24,32,34-37,41-47,49,50,54-56,61,62,65-69]. The median Lp(a) ranged from 12 mg/dL to 20 mg/dL [34,42,51,57]. Joseph et al. (2022) reported 28.9% of Indian non-CAD controls with elevated Lp(a) of >30 mg/dL [4]. Sontakke et al. (2014) reported 46% of healthy Indian women had elevated Lp(a), although the study did not define a specific threshold or criterion for elevated Lp(a) [67].
|
Author (Year) |
Study Design (study location) |
Study Population and Sample Size |
Mean Age (years) and Gender |
Lp(a) Threshold |
Key findings |
|
Amin et al. (2024)[30] |
Prospective Observational |
CAD; n= 600 |
475 M / 125 F |
30 |
58.3% had Lp(a) ≥30 mg/dL |
|
(Manipal, India) |
|||||
|
Dudum et al. (2024)[20] |
Retrospective |
ASCVD risk patients; n=2670 (Asian Indians) |
44.7 ± 9.6 |
50 |
Median (IQR): 34 mg/dL (18-66) |
|
(California) |
186 M / 824 F |
35.7% had Lp(a) ≥50 mg/dL |
|||
|
Sandhu et al. (2024)[21] |
Cross-sectional |
CAD; n= 100 |
52.56 ± 12.84 |
30 |
59% had Lp(a) ≥30 mg/dL |
|
(Kolkata, India) |
84 M / 16 F |
||||
|
Sawhney et al. (2024)[29] |
NA |
Familial hypercholesterolemia; n=100 |
46.97 ± 8.56 |
50 |
43% had Lp(a) ≥50 mg/dL |
|
Sawhney et al. (2023)[70] |
NA |
ACS; n=1021 |
NA |
50 |
34% had Lp(a) ≥50 mg/dL |
|
37% young ACS patients had Lp(a) ≥50 mg/dL vs 32% elderly patients |
|||||
|
40% patients with multivessel disease had Lp(a) ≥50 mg/dL |
|||||
|
Jain et al. (2023)[28] |
Retrospective study |
ACS; n= 575 |
NA |
NA |
Baseline: 49.15 ± 15.03 mg/Dl |
|
21% patients tested for Lp(a) |
|||||
|
1 year post treatment: 26.57 ± 16.23 mg/dL (p<0.001) |
|||||
|
Kalaivani et al. (2023)[65] |
Case-control study |
CKD: n=70 |
73 M / 67 F |
NA |
Mean ± SD |
|
(Chennai, India) |
Controls; n=70 |
Control: 17.88 ± 14.5 mg/dL |
|||
|
Cases: 53.26 ± 39.56 mg/dL |
|||||
|
Muheeb et al. (2023)[22] |
Case-control |
STEMI; n=110 |
38.8 ± 6.7 |
NA |
Mean ± SD |
|
(Delhi, India) |
Control; n=110 |
201 M / 19 F |
Cases- 87.56 ± 74.28 mg/dL |
||
|
Control- 25.81 ± 24.66 mg/dL |
|||||
|
p < 0.0001 |
|||||
|
Singh et al. (2023)[48] |
NA |
Familial hypercholesterolemia; n=81 |
46.34 ± 9.0 |
50 |
39.5% had Lp(a) ≥50 mg/dL |
|
Joseph et al. (2022)[4] |
Case-control |
CAD; n=682 Control; n=246 |
673 M / 255 F |
30 |
Lp(a) ≥30 mg/dL |
|
(Kerala, India) |
Cases: 32% |
||||
|
Control: 28.9% |
|||||
|
Loh et al. (2022)[23] |
Case-control |
CAD; n=316 |
NA |
NA |
Distribution of Lp(a) is a right skew pattern |
|
(Singapore) |
|||||
|
Mahto et al. (2022)[24] |
Cross-sectional observational |
Hypertension; n=100 |
Cases- 43.06 ± 10.68 |
NA |
Mean ± SD |
|
(New Delhi, India) |
Control; n=50 |
Control- 45.24 ± 11.31 |
Case: 34.03 ± 7.55 mg/dL |
||
|
90 M / 60 F |
Control: 24.13 ± 4.41 mg/dL |
||||
|
p < 0.001 |
|||||
|
Nissen et al. (2022)[25] |
Multicentre, cross-sectional epidemiological study |
ASCVD; (n=3,244 Indians) |
NA |
NA |
Median (IQR) measured in mg/dL (n=3068 Indians): 25.5 (11.2, 57.9) mg/dL |
|
(Global) |
Median (IQR) measured in nmol/L (n=176 Indians): 60.5 (24.5, 142.0) nmol/L |
||||
|
Rohit et al. (2020)[64] |
Cross-sectional study |
T2D; n=300 |
189 M / 111 F |
NA |
Mean ± SD |
|
(Vadodra, India) |
T2D >5yrs: 19.94 ± 11.78 mg/dL |
||||
|
T2D <5yrs: 19.64 ± 9.06 mg/dL |
|||||
|
Shukla et al. (2019)[26] |
Retro-prospective registry study |
STEMI; n=787 |
35.58 ± 4.27 |
30 |
15.83% had Lp(a) ≥30 mg/dL |
|
(Gujarat, India) |
736 M / 51 F |
||||
|
Behera et al. (2019)[66] |
Case-control study |
CHD; n=50 |
68 M / 32 F |
NA |
Mean ± SD |
|
(Bhubaneswar, India) |
Control; n=50 |
Cases: 50.85 ± 23.42 mg/dL |
|||
|
Control: 17.10 ± 5.18 mg/dL |
|||||
|
p< 0.001 |
|||||
|
Wadhwa et al. (2019)[27] |
Case-control study |
Chronic plaque psoriasis; n=132 |
Cases- 40.76 ± 13.8 |
NA |
Median ± IQR: |
|
(Himachal Pradesh, India) |
Control; n=132 |
Control- 42.89 ± 14.56 |
Cases: 412.47 ± 222.99 ng/ml |
||
|
188 M / 76 F |
Control: 334.95 ± 403.15 ng/ml |
||||
|
p<0.001 |
|||||
|
Asre et al. (2018)[68] |
Case-control study |
AMI; n= 50 |
NA |
NA |
Mean ± SD |
|
(Agra, India) |
Control; n=20 |
AMI: 21.60 ± 2.96 mg/dL |
|||
|
Control: 19 ± 3.03 mg/dL |
|||||
|
Chaudhary et al. (2017)[39] |
Cross-sectional Observational |
CAD; n=96 |
77 M / 19 F |
30 |
70% of young adults (<40 years; n=60) had Lp(a) >30 mg/dL |
|
(North India) |
|||||
|
Gulati et al. (2017)[40] |
Pre-post intervention |
T2D; n=50 |
45.8 ± 9.3 |
NA |
Median (IQR): 21.4 mg/dL (9.4, 122) |
|
(New Delhi, India) |
27 M / 23 F |
||||
|
Vijayakumar et al. (2016)[31] |
Randomized clinical trial |
CAD; n=198 Group 1: Coconut oil |
58.97 ± 8 |
NA |
Mean ± SD |
|
(Kerala, India) |
Group 2: Sunflower oil |
185 M / 13 F |
Baseline: |
||
|
Group 1: 21.81± 21.89 |
|||||
|
Group 2: 25.13 ± 28.73 |
|||||
|
2 years post-treatment: |
|||||
|
Group 1: 22.46 ± 20.24 |
|||||
|
Group 2: 30.64 ± 31.13 |
|||||
|
Bansal et al. (2015)[32] |
Case-Control |
CAD; n=30 |
Cases- 42.47 |
NA |
Mean ± SD |
|
(New Delhi, India) |
Control; n=30 |
Control- 41.13 |
Cases: 43.17 ± 10.23 mg/dL |
||
|
38 M / 22 F |
Control: 17.62 ± 3.18 mg/dL |
||||
|
p<0.0001 |
|||||
|
Mukherjee et al. (2015)[33] |
Cross-sectional study |
ACS; n=70 |
48 M / 22 F |
NA |
41.43% of cases had high Lp(a) |
|
(Kolkata, India) |
≥40 years: 50% |
||||
|
<40 years: 26.92% |
|||||
|
Male: 41.67% |
|||||
|
Female: 40.9% |
|||||
|
Sontakke et al. (2014)[67] |
Cross-sectional study |
Control; n=200 |
200 F |
NA |
Mean ± SD |
|
(Pune, India) |
21-45 years: 32.20 ± 27.6 mg/dL |
||||
|
50-55 years: 33.51 ± 23.0 mg/dL |
|||||
|
p=0.71 |
|||||
|
The prevalence of elevated Lp(a) was 41% and 46% in premenopausal and menopausal women respectively. |
|||||
|
Yusuf et al. (2014)[34] |
Case-control study. |
CAD; n=450 |
Cases: 53.74 ± 0.48 |
NA |
Median Levels |
|
(North India) |
Control; n=150 |
Control: 52.34 ± 0.88 |
Cases: 30.30 mg/dL |
||
|
490 M / 110 F |
Control: 20 mg/dL |
||||
|
Ashfaq et al. (2013)[62] |
Cross-sectional study |
CAD; n=270 |
54.31 ± 8.35 |
NA |
Mean ± SD |
|
(Lucknow, India) |
Control; n=90 |
300 M / 60 F |
CAD: 48.73 ± 23.85 mg/dL |
||
|
Non-CAD: 18.95 ± 11.15 mg/dL |
|||||
|
p<0.0001 |
|||||
|
Chakraborty et al. (2013)[35] |
Case-control study |
Acute ischemic stroke; n=100 |
Cases - 54.0± 10.9 |
NA |
Mean ± 2 SD |
|
(New Delhi, India) |
Control; n=120 |
Control- 52.5 ± 9.8 |
Cases: 82.3 ± 52.9 mg/dL |
||
|
152 M / 68 F |
Control: 24.4 ± 5.0 mg/dL |
||||
|
p=0.000 |
|||||
|
Mishra et al. (2013)[36] |
Retrospective study |
MI or Stroke; N=85 |
Cases :37.2 |
NA |
Mean |
|
(Mumbai, India) |
(MI, n= 37; Stroke, n=48) Control; n=50 |
Control: 34 |
Stroke Patients: 37 mg/dL |
||
|
124 M / 11 F |
MI Patients: 40 mg/dL |
||||
|
Control: 21 mg/dL |
|||||
|
Chandni et al. (2012)[59] |
Cross-sectional study |
T2D; n=144 |
53.93 ± 10.74 |
30 |
26.4% had Lp(a) ≥30 mg/dL |
|
(Kozhikode, India) |
81 M / 63 F |
||||
|
Himabindu et al. (2012)[37] |
Case-control study |
ACS; n= 51 |
NA |
NA |
mean ± SEM |
|
(Andhra Pradesh, India) |
Control; n=50 |
Cases: 14.50 ± 1.70 mg/dL |
|||
|
Control: 13.20 ± 1.34 mg/dL |
|||||
|
p=0.551 |
|||||
|
Banerjee et al. (2011)[38] |
Cross-sectional, retrospective |
CVD; n=295 |
NA |
NA |
Median |
|
(USA) |
213 M / 82 F |
Male: 35 nmol/L |
|||
|
Female: 41 nmol/L |
|||||
|
Goswami et al. (2010)[41] |
Case-control study |
AMI; n=150 |
Cases: 55.1 ± 9.6 |
NA |
Mean ± SD |
|
(New Delhi, India) |
Control; n=150 |
Control: 53.7 ± 10.2 |
Cases: 40.2 ± 6.54 mg/dL |
||
|
300 M |
Control: 10.5 ± 2.34 mg/dL |
||||
|
Dhamija et al. (2009)[69] |
Case-control study |
Acute ischemic stroke; n= 66 |
Cases- 54.43 ± 1.97 |
NA |
Mean ± SEM |
|
(New Delhi, India) |
Control; n=72 |
Control: 53.86 ± 1.88 |
Cases: 57.33 ± 4.40 mg/dL |
||
|
62 M / 76 F |
Control: 23.46 ± 1.09 mg/dL |
||||
|
p<0.001 |
|||||
|
Singla et al. (2009)[61] |
Case-control study |
Diabetes; n=60 |
Cases: 52.3 ± 8.17 |
NA |
Cases: 70.7 mg/dL |
|
(Patiala, India) |
Control; n=50 |
Control: 54.12 ± 8.17 |
Control: 19.83 mg/dL |
||
|
58 M / 52 F |
p< 0.001 |
||||
|
Gambhir et al. (2008)[42] |
Case-control study |
CAD; n=220 |
Cases: 36.2 ± 3.8 |
NA |
Median |
|
(Delhi and Noida, India) |
Control; n=160 |
Control: 34.6 ± 5.0 |
Cases: 30 mg/dL |
||
|
329 M / 51 F |
Control: 12.7 mg/dL |
||||
|
Chopra et al. (2007)[60] |
Cross-sectional study |
Diabetes; n=200 |
54.9-55.1 |
NA |
Mean |
|
(Ludhiana, India) |
97 M/ 103 F |
Diabetes: 25.1 mg/dL |
|||
|
Diabetes with retinopathy: 68.5 mg/dL |
|||||
|
Rajappa et al. (2006)[43] |
Case-control study |
CAD; n=106 Control; n=52 |
Group 1 (NIDDM with CAD): 56 ± 9 |
NA |
Mean ± S.D. |
|
(Pondicherry, India) |
Group 2 (NIDDM without CAD): 54 ± 5 |
Group 1: 67.92 ± 25.67 mg/dL |
|||
|
Group 3(Control): 55 ± 11 |
Group 2: 18.38 ± 7.2 mg/dL |
||||
|
NA |
Group 3: 17.41 ± 7.06 mg/dL |
||||
|
Superko et al. (2005)[44] |
Case-control study |
Control; |
Asian Indian: 49.0 ± 11.6 |
NA |
Mean ± SD |
|
(United States) |
173 Asian Indian |
Non-Asian Indian: 49.2 ± 10.1 |
Asian Indian: 22.2 ± 17.2 mg/dL |
||
|
239 non-Asian Indian |
412 M |
Non-Asian Indian: 15.3 ± 14.0 mg/dL |
|||
|
Mahajan et al. (2004)[45] |
Cross-sectional study |
Control; n=250 |
Indians residing in Australia: 39 ± 10.3 Indians residing in India: 40 ± 11.5 |
NA |
India Group: 178 mg/l |
|
(Sydney, Australia and India) |
150 M / 100 F |
||||
|
Rajasekhar et al. (2004)[46] |
Case-control study |
CHD; n= 151 |
Cases: 53.30 ± 9.12 |
NA |
Mean ± S.D |
|
(Andhra Pradesh, India) |
Control; n=49 |
Control: 48.71 ± 8.35 |
Cases: 24.79 ± 18.99 mg/dL |
||
|
158 M / 42 F |
Control: 16.04 ± 17.53 mg/dL |
||||
|
Singh et al. (2004)[47] |
Case-control study |
CAD; n=54 |
Cases: 49.5 ± 4.2 |
NA |
Mean ± SD |
|
(Moradabad, India) |
Control; n=85 |
Control: 52.1 ± 5.2 |
Cases: 21.6 ± 5.0 mg/dL |
||
|
121 M/ 18 F |
Control: 15.7 ± 3.6 mg/dL |
||||
|
Angeline et al. (2003)[49] |
Case-control study |
MI; n=65 |
<45 |
NA |
Cases: 58.6 ± 3.20 mg/dL |
|
(Madurai, India) |
Control; n=50 |
115 M |
Control: 19.6 ± 0.10 mg/dL |
||
|
p<0.05 |
|||||
|
Geethanjali et al. (2003)[50] |
Case-control study |
CHD; n=254 |
Cases: 51.6 |
NA |
Median |
|
(Tamil Nadu and New Delhi, India) |
Control; n=480 |
Control: 43.1 |
Cases: 27.4 mg/dL |
||
|
571 M / 163 F |
Control: 17.6 mg/dL |
||||
|
Tan et al. (2003)[51] |
Case-control study |
Indians |
Cases: 58.1 ± 9.78 |
NA |
Median |
|
(Singapore) |
CAD; n=164 |
Control: 46.9 ± 14.15 |
Cases: 23.78 mg/dL |
||
|
Control; n=231 |
395 M |
Control: 12.0 mg/dL |
|||
|
Tavridou et al. (2003)[52] |
Cross-sectional study |
Control; n=251 |
NA |
NA |
Mean (95% CI) |
|
(United Kingdom) |
103 M / 148 F |
Male: 177 (143–219) mg/L |
|||
|
Female: 162 (137–192) mg/L |
|||||
|
Velmurugan et al. (2003)[63] |
Cross-sectional study |
T2D; n=587 |
55 ± 10 |
NA |
Mean ± SD |
|
(Chennai, India) |
418 M / 169 F |
18.9 ± 3.1 mg/dL |
|||
|
Deepa et al. (2002)[58] |
Cross-sectional study |
T2D; n=725 |
54 ± 10 |
NA |
Mean ± SD |
|
(Chennai, India) |
508 M / 217 F |
15.5 ± 3.2 mg/dL |
|||
|
Goyal et al. (2002)[53] |
Prospective Study |
Dyslipidemia; n=200 |
NA |
30 |
Mean ± SD |
|
(Punjab, India) |
140 M / 60 F |
44.8 ± 26.8 mg/dL |
|||
|
40% had Lp(a) >30 mg/dL |
|||||
|
Palaniaapan et al. (2002)[2] |
Cross-sectional study |
Control; n=70 |
American Indian: 20 ± 2 |
NA |
Mean ± SD |
|
(Michigan, USA) |
70 F |
Asian Indian: 0.3 ± 0.3 g/L |
|||
|
Hoogeveen et al. (2001)[54] |
Cross-sectional study |
CHD; n=57 |
Cases: 52 ± 9 Controls: 40 ± 11 |
NA |
Mean ± SD |
|
(Delhi and USA) |
Control; n=46 |
USA Group: 43 ± 14 |
Cases: 12.65 ± 9.40 mg/dL |
||
|
Asian Indian immigrants in the USA = 206 |
215 M / 94 F |
Control: 9.15 ± 7.33 mg/dL |
|||
|
USA Group: 8.67 ± 8.24 mg/Dl |
|||||
|
Ramachandran et al. (2001)[55] |
Cross-sectional study |
CAD; n=280 |
Cases: 56.2 ± 8.8 |
NA |
Mean ± SD |
|
(Madras, India) |
Control; n=167 |
Controls: 47.8 ± 10.5 |
Cases: 23.0 ± 3.3 mg/dL |
||
|
447 M |
Control: 20.0 ± 3.4 mg/dL |
||||
|
Gupta et al. (2000)[56] |
Case-control study |
CHD; n=48 |
NA |
NA |
Mean ± SD |
|
(Jaipur, India) |
Control; n=23 |
Cases: 11.95 ± 2.8 mg/dL |
|||
|
Control: 6.68 ± 3.4 mg/dL |
|||||
|
p = 0.041 |
|||||
|
≤50 years |
|||||
|
Cases: 10.27 ± 2.8 mg/dL |
|||||
|
Control: 7.27 ± 3.4 mg/dL |
|||||
|
p<0.05 |
|||||
|
>50 years |
|||||
|
Cases: 12.99 ± 2.9 mg/dL |
|||||
|
Control: 4.91 ± 3.5 mg/dL |
|||||
|
p<0.05 |
|||||
|
Gambhir et al. (2000)[57] |
Case-control study |
CAD; n=50 |
NA |
NA |
Mean ± SD |
|
(Delhi, India) |
Control; n=50 |
Cases: 35.0 ± 32.4 mg/dL |
|||
|
Control: 20.3 ± 17.0 mg/dL |
|||||
|
p<0.002 |
|||||
|
Median |
|||||
|
Cases: 26.7 mg/dL |
|||||
|
Control: 13.8 mg/dL |
|||||
|
p<0.015 |
Table 1: Characteristics of the included studies.
Note: ACS: Acute Coronary Syndrome; AMI: Acute Myocardial Infarction; ASCVD: Atherosclerotic Cardiovascular Disease; CAD: Coronary Artery Disease; CHD: Coronary Heart Disease; CKD: Chronic Kidney Disease; CVD: Cardiovascular Disease; ECG: Electrocardiogram; F: Female; HR: Hazard Ratio; IQR: Interquartile Range; Lp(a): Lipoprotein(a); M: Male; MI: Myocardial Infarction; NA: Not Available; OR: Odds Ratio; SD: Standard Deviation; SEM: Standard Error of Mean; STEMI: ST-Elevation Myocardial Infarction; T2D: Type 2 Diabetes; USA: United States of America.
Lipoprotein (a) Assessment in Indian Patients with Cardiovascular Diseases
Coronary Artery Disease
Total 15 studies assessed the association of Lp(a) and CAD in Indian population (n=3616) [4,21,23,30–32,34,39,42,43,47,51,55,57,62]. The reported prevalence of elevated Lp(a) (≥30 mg/dL) in Indian patients with CAD ranged between 32-70%, [4,21,30,39] and was 28.9% in Indian patients without coronary disease (Table 2) [4]. The majority of studies reported higher Lp(a) levels in Indian patients with CAD compared to the healthy Indian population [31,32,34,42,43,47,51,55,57,62]. Mean Lp(a) levels in CAD cases ranged from 21.6 ± 5.0 mg/dL to 67.92 ± 25.67 mg/dL, [31,32,43,47,55,57,62]. While healthy Indian individuals had mean Lp(a) levels from 15.7 ± 3.6 mg/dL to 20.3 ± 17.0 mg/dL [32,43,47,55,57,62]. Median Lp(a) levels in Indian patients with CAD ranged from 23.78 mg/dL to 30.30 mg/dL, with median in healthy Indian individuals ranging from 12 mg/dL to 20 mg/dL [34,42,51,57]. Four studies reported outcomes in Indian patients with ACS (n=1717) [28,33,37,70]. Mukherjee et al. (2015) found that 41.43% of Indian patients with ACS had high Lp(a), although the study did not define a specific threshold or criterion for high Lp(a) [33]. Sawhney et al. (2023) reported that 34% Indian ACS patients had Lp(a) ≥50 mg/dL [70]. Overall, 37% young Indian ACS patients had Lp(a) ≥50 mg/dL vs 32% elderly Indian patients and 40% Indian patients with multivessel disease had Lp(a) ≥50 mg/dL.[70] Jain et al. (2023) reported mean Lp(a) levels of 49.15 ± 15.03 mg/dL in Indian ACS patients.[28] Himabindhu et al. (2012) found mean Lp(a) levels of 14.50 ± 1.70 mg/dL in Indian ACS patients and 13.20 ± 1.34 mg/dL in healthy Indian individuals, but the difference was not statistically significant [37].
Coronary Heart Disease
Five studies investigated the Lp(a) levels in Indian patients with coronary heart disease (CHD) (n=560) (Table 2) [46,50,54,56,66]. Mean Lp(a) levels in Indian CHD patients ranged from 11.95 ± 2.8 mg/dL to 50.85 ± 23.42 mg/dL [46,54,56,66]. Mean levels in the healthy Indian cohort ranged from 6.68 ± 3.4 mg/dL to 17.10 ± 5.18 mg/dL [46,54,56,66]. Median Lp(a) levels were higher in Indian CHD patients (27.4 mg/dL) than healthy Indian individuals (17.6 mg/dL) [50]. Lp(a) concentrations increased with disease severity, with significantly higher levels in patients with triple-vessel disease compared to those with single-vessel disease or normal coronaries [50].
Myocardial Infarction
Lp(a) levels in Indian patients with MI were reported in six studies (n=1199) (Table 2) [22,26,36,41,49,68]. A study by Shukla et al. (2019) reported that 15.83% of Indian patients with ST-Elevation Myocardial Infarction (STEMI) had Lp(a) ≥30 mg/dL [26]. Mean Lp(a) in Indian patients with MI ranged from 21.60 ± 2.96 mg/dL to 87.56 ± 74.28 mg/dL, while the healthy Indian population generally exhibited lower mean levels, ranging from 19.0 ± 3.03 mg/dL to 25.81 ± 24.66 mg/dL [22,36,41,49,68].
Atherosclerotic Cardiovascular Disease
Two studies evaluated the association between Lp(a) and ASCVD in Indian patients (n=5914) (Table 2) [20,25]. A study by Dudum et al. (2024) in Indian patients reported a median Lp(a) level of 34 mg/dL across various ASCVD risk levels, with 35.7% of the population having Lp(a) levels >50 mg/dL [20]. The global Lp(a) HERITAGE study found a median Lp(a) of 25.5 mg/dL in Indian ASCVD patients [25].
Risk Factors for Cardiovascular Disease
Lp(a) has been reported in relation to established CV risk factors in Indian patients, including FH (n=181), [29,48] T2D (n=2066), [40,58–61,63,64] dyslipidemia (n=200), [53] and stroke (n=214) (Table 2) [35,36,69]. Seven studies reported Lp(a) levels in the Indian diabetic population (n=2066) [40,58–61,63,64]. Chandini et al. (2012) observed that 26.4% of Indian T2D patients had Lp(a) ≥30 mg/dL [59]. The mean Lp(a) in Indian T2D patients ranged from 15.5 ± 3.2 mg/dL to 70.7 mg/dL; [58,60-64] median was reported as 21.4 mg/dL (9.4,122) [40]. A study in Indian patients by Singla et al. (2009) reported that Lp(a) concentrations were significantly higher in diabetic subjects than in healthy individuals (70.7 mg/dL vs. 19.83 mg/dL; p < 0.001) [61]. Among Indian diabetic subgroups, patients with retinopathy exhibited elevated Lp(a) levels compared to those without complications (68.5 mg/dL vs. 25.1 mg/dL) [60]. In Indian patients with FH, a significant proportion of patients exhibited elevated Lp(a) levels. Sawhney et al. (2024) and Singh et al. (2023) reported that 43% and 39.5%, respectively, of FH patients had Lp(a) greater than 50 mg/dL [29,48]. Goyal et al. (2002) found a mean Lp(a) level of 44.8 ± 26.8 mg/dL in Indian dyslipidemic patients and 40% of these patients had high serum Lp(a) levels (>30 mg/dL) [53].
Stroke
Three studies investigated the association between Lp(a) levels and stroke in Indian patients (n=214) [35,36,69]. Chakraborty et al. (2013) found mean Lp(a) levels of 82.3 ± 52.9 mg/dL in stroke cases versus 24.4 ± 5.0 mg/dL in the healthy Indian cohort (p=0.000) [35]. Dhamija et al. (2009) reported mean Lp(a) of 57.33 ± 4.40 mg/dL in acute ischemic stroke cases compared to 23.46 ± 1.09 mg/dL in healthy Indian individuals [69]. Mishra et al. (2013) observed a mean Lp(a) of 37 mg/dL in stroke patients, while healthy Indian individuals had 21 mg/dL [36]. High admission levels of Lp(a) were associated with increased stroke severity, a poorer long-term prognosis, and increased mortality, with an admission level Lp(a) >77 mg/dL associated with a significant increase in mortality (p=0.000) [35].
|
Study population |
Mean Lp(a) range |
Median Lp(a) range |
% of patients with Lp(a) >30mg/dL |
% of patients with Lp(a) >50mg/dL |
|
Healthy Indian Controls (n=4,016) |
6.68 - 33.51 mg/dL [2,22,24,32,35-37,41-47,49,50,54-56,61,62,65-69] |
12 - 20 mg/dL [34,42,51,57] |
28.9% [4] |
NA |
|
CAD (n=3,616) |
21.6 - 67.92 mg/dL [31,32,43,47,55,57,62] |
23.78 - 30.3 mg/dL [34,42,51,57] |
32-70% [4,21,30,39] |
NA |
|
ACS (n=1,717) |
14.50 – 49.15 mg/dL[28,37] |
NA |
NA |
34%[70] |
|
CHD (n=560) |
11.95 - 50.85 mg/dL [46,54,56,66] |
27.4 mg/dL [50] |
NA |
NA |
|
MI (n=1,199) |
21.60 - 87.56 mg/dL [22,36,41,49,68] |
NA |
15.83% [26] |
NA |
|
ASCVD (n=5,914) |
NA |
25.5 - 34 mg/dL [20,25] |
NA |
35.7% [20] |
|
Type 2 Diabetes (n=2,066) |
15.5 - 70.7 mg/dL [58,60,61,63,64] |
21.4 mg/dL [40] |
26.4% [59] |
NA |
|
Stroke (n=214) |
37 - 82.3 mg/dL [35,36,69] |
NA |
NA |
NA |
|
Familial hypercholesterolemia (n=181) |
NA |
NA |
NA |
39.5-43% [29,48] |
|
Dyslipidemia (n=200) |
44.8 mg/dL[53] |
NA |
40%[53] |
NA |
Table 2: Lp(a) levels among healthy Indian population and diseased cohorts across included studies.
Note: Lp(a) prevalence was reported using thresholds of >30 mg/dL and/or >50 mg/dL in the included studies. None of the included studies reported prevalence estimates for Lp(a) >70 mg/dL. ASCVD: Atherosclerotic Cardiovascular Disease; ACD: Acute Coronary Syndrome; CAD: Coronary Artery Disease; CHD: Coronary Heart Disease; MI: Myocardial Infarction; NA: Not Available.
Demographic
Across the limited studies reporting age-specific Lp(a) patterns in Indian populations, findings were inconsistent [4,33,56,67]. In ACS cohort, prevalence of elevated Lp(a) was numerically higher in older patient (≥40 years; 50%), compared to younger patients (<40 years; 26.92%), though the difference was not statistically significant [33]. Gupta et al. (2000) observed higher Lp(a) levels in the younger (≤50 years) than older (>50 years) individuals in healthy Indian control groups [56] whereas, Sontakke et al. (2014) found no significant age-related differences in healthy Indian women [67]. Overall, current evidence remains inconclusive, and no consistent age-related pattern has been established for Indian population. Across studies reporting sex-specific data, no consistent gender differences in Lp(a) levels were observed for Indian population. In ACS patients, the proportion of elevated Lp(a) was nearly identical in males (41.67%) and females (40.9%) [33]. Similar findings were reported in CVD cohorts, where median Lp(a) levels were comparable between men and women [38]. In a general population cohort, Tavridou et al. (2003) found similar mean Lp(a) concentrations between males and females [52].
Study Quality
Based on the NOS assessment, a total of 26 studies were evaluated for methodological quality. Of these, 8 studies were rated as good quality (scores 7–9), 15 studies as moderate quality (scores 4–6), and 3 studies as low quality (scores 0–3). (Table 3) Based on the Joanna Briggs Institute (JBI) critical appraisal checklist for analytical cross-sectional studies, the overall methodological quality of 20 studies was high across most domains. (Table 4) Nearly all studies clearly defined inclusion criteria, adequately described study subjects and settings, and used valid and reliable methods to measure exposure and outcomes. A consistent limitation across the majority of studies was the inadequate identification and management of confounding factors. A single RCT was assessed using the ROB-2 tool and was found to have low risk of bias.[31] Abstracts were not assessed for quality and are considered low-quality evidence [29,48,70].
|
Author (year) |
Selection |
Comparability |
Exposure/Outcome |
Total (Out of 9) |
|
Amin et al. (2024) |
2 |
0 |
2 |
4 |
|
Dudum et al. (2024) |
3 |
0 |
2 |
5 |
|
Kalaivani et al. (2023) |
2 |
1 |
3 |
6 |
|
Muheeb et al. (2023) |
2 |
1 |
3 |
6 |
|
Joseph et al. (2022) |
3 |
0 |
3 |
6 |
|
Loh et al. (2022) |
3 |
1 |
3 |
7 |
|
Behera et al. (2019) |
2 |
1 |
3 |
6 |
|
Wadhwa et al. (2019) |
2 |
1 |
3 |
6 |
|
Asre et al. (2018) |
2 |
1 |
2 |
5 |
|
Bansal et al. (2015) |
2 |
1 |
3 |
6 |
|
Yusuf et al. (2014) |
3 |
2 |
3 |
8 |
|
Chakraborty et al. (2013) |
2 |
1 |
3 |
6 |
|
Himabindu et al. (2012) |
3 |
1 |
3 |
7 |
|
Goswami et al. (2010) |
3 |
1 |
3 |
7 |
|
Dhamija et al. (2009) |
3 |
1 |
3 |
7 |
|
Singla et al. (2009) |
2 |
1 |
3 |
6 |
|
Gambhir et al. (2008) |
3 |
1 |
3 |
7 |
|
Rajappa et al. (2006) |
3 |
0 |
3 |
6 |
|
Superko et al. (2005) |
4 |
1 |
3 |
8 |
|
Rajasekhar et al. (2004) |
4 |
1 |
3 |
8 |
|
Singh et al. (2004) |
4 |
1 |
3 |
8 |
|
Angeline et al. (2003) |
3 |
1 |
3 |
7 |
|
Geethanjali et al. (2003) |
4 |
1 |
3 |
8 |
|
Tan et al. (2003) |
4 |
1 |
3 |
8 |
|
Goyal et al. (2002) |
2 |
0 |
1 |
3 |
Table 3: Risk of bias of observational studies assessed using the NOS scale.
|
JBI tool |
Domain 1 |
Domain 2 |
Domain 3 |
Domain 4 |
Domain 5 |
Domain 6 |
Domain 7 |
Domain 8 |
|
Sandhu et al. (2024) |
Y |
Y |
Y |
NA |
N |
N |
Y |
Y |
|
Mahto et al. (2022) |
Y |
Y |
Y |
Y |
N |
N |
Y |
Y |
|
Nissen et al. (2022) |
Y |
Y |
Y |
Y |
N |
N |
U |
Y |
|
Rohit et al. (2020) |
Y |
Y |
N |
NA |
N |
N |
Y |
Y |
|
Chaudhary et al. (2017) |
Y |
Y |
NA |
Y |
N |
N |
U |
Y |
|
Mukherjee et al. (2015) |
Y |
N |
U |
U |
N |
N |
N |
Y |
|
Sontakke et al. (2014) |
Y |
Y |
NA |
NA |
NA |
NA |
Y |
Y |
|
Ashfaq et al. (2013) |
Y |
Y |
Y |
Y |
N |
N |
Y |
Y |
|
Chandini et al. (2012) |
N |
Y |
NA |
Y |
N |
N |
Y |
Y |
|
Banerjee et al. (2011) |
Y |
Y |
U |
U |
N |
N |
Y |
Y |
|
Chopra et al. (2007) |
Y |
Y |
Y |
NA |
N |
N |
Y |
Y |
|
Mahajan et al. (2004) |
Y |
Y |
Y |
NA |
N |
N |
Y |
Y |
|
Tavridou et al. (2003) |
Y |
Y |
NA |
NA |
N |
N |
Y |
Y |
|
Velmurugan et al. (2003) |
Y |
Y |
Y |
NA |
N |
N |
Y |
Y |
|
Deepa et al. (2002) |
Y |
Y |
Y |
NA |
N |
N |
Y |
Y |
|
Palaniaapan et al. (2002) |
Y |
Y |
Y |
Y |
N |
N |
Y |
Y |
|
Hoogeveen et al. (2001) |
Y |
Y |
Y |
Y |
N |
N |
Y |
Y |
|
Ramachandran et al. (2001) |
Y |
Y |
Y |
Y |
N |
N |
Y |
Y |
Table 4: Risk of bias of cross-sectional studies assessed using the JBI appraisal scale.
Note: N: No; NA: Not applicable; U: Unclear; Y: Yes.
Discussion
This systematic review provides the most comprehensive synthesis to date of Lp(a) levels across diverse Indian populations, spanning healthy individuals, cardiometabolic disease cohorts, and high-risk subgroups. The findings consistently demonstrate a substantial burden of elevated Lp(a) in India. Disease cohorts including CAD, ACS, MI, stroke, diabetes, and FH showed uniformly higher Lp(a) levels, with a large proportion exceeding clinically important thresholds. Even among healthy or non-diseased Indian adults, nearly one-third exhibited Lp(a) concentrations >30 mg/dL, [4] suggesting a high background prevalence that likely contributes to India’s disproportionately early and aggressive manifestation of ASCVD. This finding is particularly concerning in light of recent Indian expert consensus recommendations, which emphasize Lp(a) levels >30 mg/dL as clinically significant and should be considered as a CV risk-enhancing factor during risk assessment [11]. However, comparative Indian data demonstrating a higher ASCVD event risk at this threshold than in other populations are currently lacking [11].
Importantly, while Lp(a) levels between 30 and 50 mg/dL are often considered an intermediate risk category, a substantial proportion of Indian patients exceeded the more widely accepted high-risk threshold of 50 mg/dL (Table 2). In the studies included in this review, 34% of patients with CAD/ACS,[70] 35.7% of patients with ASCVD,[20] and 39.5–43% of patients with familial hypercholesterolemia had Lp(a) concentrations >50 mg/dL [29,48]. These observations suggest that a considerable proportion of Indian patients with established or inherited CV risk conditions carry markedly elevated Lp(a)-associated risk. These findings highlight a substantial burden of both elevated and markedly elevated Lp(a) among Indian populations, including apparently healthy individuals. This underscores the critical need for broader Lp(a) screening in both healthy and high-risk individuals, as many high-risk individuals remain unidentified until the occurrence of a CV event.
As outlined in Figure 2, the majority of contemporary guidelines recommend once-in-a-lifetime measurement of Lp(a) [71-83]. In addition, all major guidelines advocate Lp(a) testing in individuals with premature CV events, while several also recommend testing in those with recent or recurrent ASCVD events and in individuals with a family history of CV events. Collectively, these recommendations support a targeted yet scalable approach to Lp(a) assessment, where identification of elevated Lp(a) may meaningfully refine risk stratification and guide intensification of preventive strategies.
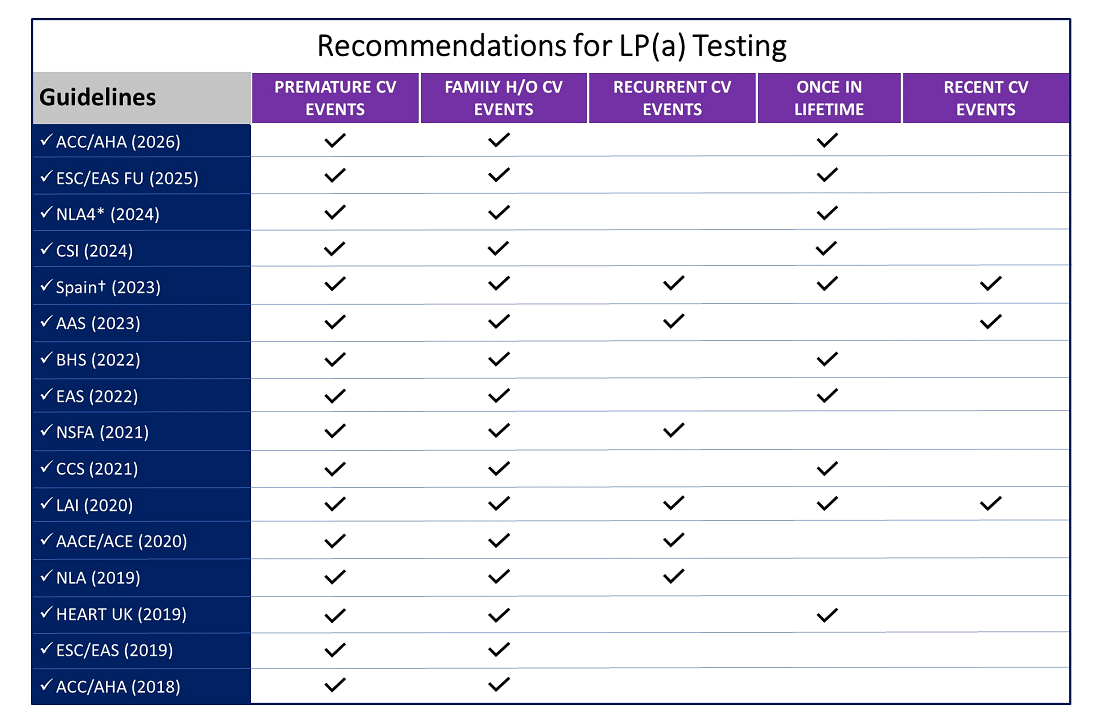
Figure 2: Guidelines recommendations for Lp(a) Testing [8,9,71-83].
Note: A check mark indicates that the guideline specifically recommends or supports Lp(a) measurement in the corresponding clinical scenario. Recommendations were interpreted based on explicit statements regarding Lp(a) testing.
*This recommendation for Lp(a) testing specifically relates to Lp(a) screening in youth (individuals aged <18 years) with a family history of premature ASCVD. The NLA also recommends Lp(a) screening in youth with either clinically suspected or genetically determined familial hypercholesterolaemia, ischaemic stroke of unknown cause or family history (first-degree relatives) of elevated Lp(a). †This consensus document from Spain was prepared by a working group consisting of multiple scientific societies involved in the care of patients at vascular risk.
NLA4 - National Lipid Association Risk Category 4; AAS - Australian Atherosclerosis Society; BHS - Beijing Heart Society; EAS -European Atherosclerosis Society; NSFA – New French Atherosclerosis Society; CCS - Canadian Cardiovascular Society; CSI - Cardiological Society of India; LAI - Lipid Association of India; AACE - American Association of Clinical Endocrinology; ACE - American College of Endocrinology; NLA - National Lipid Association; ESC - European Society of Cardiology; EAS - European Atherosclerosis Society; ACC - American College of Cardiology; AHA - American Heart Association; CV – cardiovascular; Lp(a)- lipoprotein(a); FU – Focused update.
Approximately 90% of the interindividual variability in plasma Lp(a) levels is explained by genetic variation within the LPA gene locus [84]. South Asian populations, including Indians, have higher frequency of small apo(a) isoforms, which are associated with markedly elevated plasma Lp(a) and increased atherothrombotic risk [85,86]. This genetic predisposition explains the high baseline Lp(a) levels observed in Indian populations and the substantial burden identified in the present review. Importantly, as Lp(a) levels are not much influenced by diet, physical activity, or conventional lifestyle interventions, dependence on lifestyle modification alone is not sufficient to reduce Lp(a)-mediated CV risk [87,88]. This highlights the need to incorporate Lp(a) measurement into routine CV risk assessment and lipid evaluation, enabling more accurate risk stratification, and informed therapeutic decision-making, particularly in populations with a high prevalence of elevated Lp(a).
In the present study, elevated Lp(a) was strongly associated with various CVDs, which is consistent with published literature. A recent meta-analysis by Tian et al. (2024), which included studies from diverse populations worldwide, demonstrated that high Lp(a) levels significantly increased the risk of ASCVD (odd ratio [OR]: 2.15) and CAD (OR: 2.44) [89]. The risk of premature CAD with elevated Lp(a) was even greater in the South Asian cohort (OR:3.71) [89]. Another systematic review and meta-analysis of studies from diverse populations worldwide found that elevated Lp(a) in patients with existing ischemic heart disease increased the risk of MI, major adverse CV events (MACEs), and death [90]. These findings further support the adverse prognostic significance of elevated Lp(a) across different populations. Moreover, a linear concentration-response was reported in a meta-analysis by Amiri et al. (2023), where every 50 mg/dL increase in Lp(a) corresponded to a 31% greater risk of CV death in the general population [91].
Emerging evidence supports the clinical relevance of Lp(a) thresholds as low as 30 mg/dL for CV risk stratification. In a large multi-institutional study of Taiwanese individuals, Chen et al. demonstrated that Lp(a) levels ≥30 mg/dL independently predicted adverse CV outcomes irrespective of baseline ASCVD status [92]. Lp(a) ≥30 mg/dL was associated with a significantly increased risk of MACE (adjusted subdistribution hazard ratio [aSHR]: 1.24; 95% CI: 1.07–1.43) in ASCVD-free individuals and also in patients with established ASCVD (aSHR: 1.36; 95% CI: 1.07–1.74) [92]. In the present review, several Indian studies reported a substantial proportion of patients with Lp(a) levels >30 mg/dL across high-risk clinical groups, including CAD/ACS (32%-70%), [4,21,30,39] MI (15.83%), [26] diabetes (26.4%), [59] and dyslipidemia (40%) [53], as summarized in Table 2. These findings suggest that the 30–50 mg/dL range may be clinically relevant in Indian patients, particularly when interpreted alongside overall CV risk. While, most contemporary international guidelines, including ESC/EAS, consider Lp(a) ≥50 mg/dL as the threshold associated with increased ASCVD risk, recent Indian expert opinion has suggested that Lp(a) levels >30 mg/dL may be clinically relevant for cardiovascular risk assessment, particularly in high-risk individuals [8-11]. Therefore, these observations suggest that Lp(a) levels between 30 and 50 mg/dL may warrant greater attention in Indian populations and may support inclusion of Lp(a) into CV risk assessment frameworks in Indian population; however, prospective Indian outcome studies are needed to determine whether this lower threshold independently predicts ASCVD events or warrants population-specific risk reclassification.
Lp(a) is recognized as a major contributor to residual CV risk despite achieving target LDL-C levels with current lipid-lowering therapies [93]. Evidence suggests that elevated Lp(a) is an independent and additive risk for ASCVD even in patients receiving intensive statin therapy and achieving recommended LDL-C targets [94]. The high prevalence of elevated Lp(a) observed in this review suggests that genetically mediated Lp(a)-related risk may account for a substantial proportion of unexplained CV events, highlighting the need to incorporate Lp(a) assessment into secondary prevention frameworks and comprehensive CV risk reduction strategies.
The reviewed studies also substantiate literature demonstrating that high Lp(a) levels are linked to ischemic stroke. Across all three studies included in this review, Indian patients experiencing a stroke had significantly higher Lp(a) levels (37 – 82.3 mg/dL) than their healthy counterparts (21.0 – 24.4 mg/dL) [35,36,69]. In alignment with this finding, a recent meta-analysis of studies done in Asian and Caucasian populations identified a significant association between elevated Lp(a) concentrations and increased risk of ischemic stroke compared with controls (standardized mean difference [SMD] 0.76; 95% confidence interval [CI] 0.53–0.99) [95]. Smolders et al. (2007), in a pooled analysis of 31 studies, found higher Lp(a) concentrations to be significantly linked with overall stroke risk (SMD:0.39; 95% CI:0.23–0.54) [96]. Similarly, Nave et al. (2015) confirmed the association, reporting an elevated risk of ischemic stroke among individuals with high Lp(a) levels (OR 1.19; 95% CI 1.00–1.41) [97]. However, the overall evidence remains heterogeneous, with some studies and meta-analyses reporting weaker or non-significant associations [98-100]. Differences in ethnicity, stroke subtype, study design, and adjustment for confounding factors may partly explain these inconsistencies. Therefore, while Indian case-control data suggest higher Lp(a) levels in stroke patients, these findings should be interpreted cautiously.
An important limitation of the existing Indian literature on Lp(a) is the underrepresentation of women, with most studies enrolling predominantly male cohorts. Although studies reporting sex-specific data in this review did not demonstrate consistent differences in Lp(a) levels between men and women, these findings must be interpreted cautiously due to limited female sample sizes and the absence of analyses stratified by menopausal status. Lp(a) levels are usually 5%–10% higher in women compared to men [75]. Postmenopausal reductions in estrogen have been associated with further increases in Lp(a), which can be attenuated with hormone replacement therapy [101,102]. These gaps highlight the need for sex-specific and menopause-stratified studies in Indian populations to better define the contribution of Lp(a) to CV risk in women and to inform tailored prevention strategies.
Clinical and Public Health Implications
The consistent elevation of Lp(a) across cardiometabolic diseases in Indians reinforces its role as a key driver of premature and aggressive ASCVD. The increased prevalence of Lp(a) ≥30 mg/dL suggests that routine assessment may help to identify high-risk individuals who would otherwise be missed by using traditional risk factors. However, despite, substantial evidence demonstrating its role in risk reclassification, intensification of lipid-lowering therapy, and identification of individuals at very high residual risk, Lp(a) testing is suboptimal in India. The findings of this review emphasize the importance of incorporating Lp(a) into CV risk profiling in India, where premature and severe CAD is common. ESC/EAS guidelines and the 2019 ACC/AHA primary prevention guideline recommend once-in-a-lifetime Lp(a) testing, particularly in high-risk ethnic groups and those with premature ASCVD [75,103]. Thus, considering the high prevalence observed in this review, routine Lp(a) testing in Indian adults, especially patients with premature ASCVD or a family history, is likely to improve early detection and allow more aggressive risk factor optimization, including intensified LDL-C lowering therapy.
Achieving very low LDL-C targets of <55 mg/dL is especially critical in patients with elevated Lp(a) as Lp(a) is an independent and additive atherothrombotic risk, amplifying plaque burden and residual CV risk, thus making aggressively lowering LDL-C essential to combat the dual threat and prevent CV events [90,104,105]. Moreover, routine Lp(a) testing assumes greater clinical relevance in light of novel, targeted therapies specifically designed to reduce Lp(a). Multiple Lp(a) targeted therapies are currently in advanced phases of clinical development and have demonstrated the ability to achieve substantial and sustained reductions in Lp(a) levels [106]. Hence, Lp(a) testing will ensure timely access to Lp(a)-targeted treatments as they become clinically available. Thus, it is imperative for clinicians to change the status quo, implement at least once-in-a-lifetime Lp(a) testing in at-risk individuals, use Lp(a) to refine risk assessment, and intensify lipid-lowering and global risk-reduction strategies in those with elevated Lp(a) to reduce premature CV morbidity and mortality in Indian patients.
Study Limitations and Future Directions
This systematic review has few limitations. First, there was significant variability across studies in the reporting of Lp(a) levels, variable thresholds for defining elevated Lp(a), study design, sample sizes, and population, all of which limit the comparability of findings. Assay heterogeneity is another important limitation of this review. The included studies might have used diverse assay methods for Lp(a) measurement. Furthermore, Lp(a) concentrations were reported using different units (mg/dL, nmol/L, ng/mL), which reflects variability in calibration and reporting practices. As many conventional immunoassays are affected by apo(a) isoform size, such heterogeneity may limit direct comparability of Lp(a) levels across studies, affect prevalence estimates at specific thresholds, and complicate clinical interpretation. These limitations highlight the need for future Indian studies to adopt standardized, isoform-independent assays and uniform reporting units, which would improve comparability, allow more accurate burden estimation, and help in translation of Lp(a) data into clinical practice. Also, we synthesized the findings qualitatively, as a meta-analysis was not feasible due to heterogeneity in the included studies. Finally, most included studies were single-center with relatively small sample sizes, and few accounted for key confounders such as diet, socioeconomic status, or family history, further limiting the robustness of conclusions.
Future research in India should focus on establishing national, multicentre registries to generate representative data on Lp(a) levels across diverse geographic, ethnic, and socioeconomic populations, including rural and underserved communities. There is an unmet need for adoption of standardized, isoform-independent Lp(a) assays with uniform reporting units. Large prospective cohort studies are needed to define the impact of elevated Lp(a) on long-term CV outcomes and residual risk despite optimal LLT. Moreover, integration of Lp(a) into India-specific CV risk prediction models may improve risk stratification and guide preventive strategies tailored to the Indian population.
Conclusion
Indian adults exhibit a high burden of elevated Lp(a) across both healthy and clinical populations, with markedly higher levels in individuals with CAD, MI, stroke, FH, and diabetic complications. Elevated Lp(a) levels correlated with greater disease severity and adverse clinical outcomes, highlighting its role as an independent and clinically relevant CV risk factor. Given the strong genetic determination, prognostic importance, and availability of emerging Lp(a)-lowering therapies, routine Lp(a) testing and risk-stratified management strategies are urgently needed in Indian clinical practice.
Acknowledgements
The authors would like to acknowledge Dr. Shahu Ingole from ‘Science Plus’ for his support in data analysis, manuscript writing and editing.
Funding
This work was supported by the Novartis Healthcare Pvt Ltd, India.
Declaration of Interest Statement/Conflict of Interest
Authors JPS, AO, CKP, DK, NS, GN have no conflict of interest to declare. Authors SC and PK are the employees of Novartis Healthcare Pvt Ltd. Mumbi, India.
Author Contributions
JPS conceptualized and designed the study, conducted the literature search, extracted the data, interpreted the findings, and drafted the manuscript. AO contributed to the literature search, data extraction, and critical revision of the manuscript. CKP assisted with data interpretation and critical revision of the manuscript. DK contributed to data analysis, interpretation of results, and manuscript editing. NS provided critical review of the manuscript, data interpretation and intellectual input. GN contributed to data verification and manuscript review. SC provided methodological input and critically revised the manuscript. PK supervised the study, provided overall guidance, and interpreted the findings. All authors reviewed the manuscript critically for important intellectual content and approved the final manuscript for submission.
Ethical Statement
This study is a systematic review of previously published literature. As the analysis was based solely on data from published studies and did not involve direct interaction with human participants or access to identifiable patient information, ethical approval and informed consent were not required. The review was performed and reported in accordance with the Preferred Reporting Items for Systematic Reviews and Meta-Analyses (PRISMA) guidelines.
References
- WHO. Cardiovascusslar diseases [Internet].
- Palaniappan L, Anthony MN, Mahesh C, et al. Cardiovascular risk factors in ethnic minority women aged < or =30 years. Am J Cardiol 89 (2002): 524-529.
- Enas EA, Varkey B, Dharmarajan TS, et al. Lipoprotein(a): An underrecognized genetic risk factor for malignant coronary artery disease in young Indians. Indian Heart Journal 71 (2019) :184-198.
- Joseph J, Menon JC, Sebastien PK, et al. Association of lipoprotein (a) with coronary artery disease in a South Asian population: A case-control study. PLoS ONE 17 (2022): e0267807.
- Tsimikas S, Fazio S, Ferdinand KC, et al. NHLBI Working Group Recommendations to Reduce Lipoprotein(a)-Mediated Risk of Cardiovascular Disease and Aortic Stenosis. J Am Coll Cardiol 71 (2018): 177-192.
- Greco A, Finocchiaro S, Spagnolo M, et al. Lipoprotein(a) as a Pharmacological Target: Premises, Promises, and Prospects. Circulation 151 (2025): 400-415.
- Doherty S, Hernandez S, Rikhi R, et al. Lipoprotein(a) as a Causal Risk Factor for Cardiovascular Disease. Curr Cardiovasc Risk Rep 19 (2025): 8.
- Mach F, Koskinas KC, Roeters van Lennep JE, et al. ESC/EAS Scientific Document Group. 2025 Focused Update of the 2019 ESC/EAS Guidelines for the management of dyslipidaemias. Eur Heart J 46(2025): 4359-4378. Erratum in: Eur Heart J 47 (2026): 697.
- Blumenthal RS, Morris PB, Gaudino M, et al. 2026 ACC/AHA/AACVPR/ABC/ACPM/ADA/AGS/APhA/ASPC/NLA/PCNA Guideline on the Management of Dyslipidemia: A Report of the American College of Cardiology/American Heart Association Joint Committee on Clinical Practice Guidelines. Circulation 153 (2026): e1154-e1276.
- Sawhney JP, Ramakrishnan S, Madan K, et al. CSI clinical practice guidelines for dyslipidemia management: Executive summary. Indian Heart J 76 (2024): S6-S19.
- Ray K, Kaul U, Rao S, et al. Expert Opinion on Targeted Lipid Control for Very-high-risk Indian Patients: Bridging the Gap in Real-world Practice. European Cardiology Review 20 (20): e37.
- Mahajan K, Himral S, Sharma JB, et al. Lipoprotein(a) as an Independent Biomarker of Coronary Complexity: Prevalence, Clinical Correlates, and Diagnostic Utility in a North Indian Acute Coronary Syndrome Cohort. Cureus 22 17(2025): e90747.
- Bhatia HS, Hurst S, Desai P, et al. Lipoprotein(a) Testing Trends in a Large Academic Health System in the United States. J Am Heart Assoc 12(2023): e031255.
- Reyes-Soffer G, Yeang C, Michos ED, et al. High lipoprotein(a): Actionable strategies for risk assessment and mitigation. Am J Prev Cardiol 18 (2024): 100651.
- Parcha V, Bittner VA. Lipoprotein (a) in primary cardiovascular disease prevention is actionable today. Am Heart J Plus 57 (2025): 100581.
- Page MJ, McKenzie JE, Bossuyt PM, et al. The PRISMA 2020 statement: an updated guideline for reporting systematic reviews. BMJ 372 (2021): n71.
- Sterne JAC, Savović J, Page MJ, et al. RoB 2: a revised tool for assessing risk of bias in randomised trials. BMJ 366 (2019): l4898.
- Barker TH, Stone JC, Sears K, et al. The revised JBI critical appraisal tool for the assessment of risk of bias for randomized controlled trials. JBI Evid Synth 21 (2023): 494-506.
- Wells G, Shea B, O’Connell D, et al. The Newcastle-Ottawa Scale (NOS) for Assessing the Quality of Nonrandomized Studies in MetaAnalysis. Ottawa Hospital Research Institute.
- Dudum R, Huang Q, Yan XS, et al. Lipoprotein(a) Levels in Disaggregated Racial and Ethnic Subgroups Across Atherosclerotic Cardiovascular Disease Risk Levels J. JACC Adv 3 (2024): 100940.
- Sandhu AS, Ahmed I. Serum Lipoprotein(a) and Angiographic Severity of Coronary Artery Disease in Asian Indians. Research in Cardiovascular Medicine 13 (2024): 42-47.
- Muheeb G, Gupta MD, Kunal S, et al. Novel lipid biomarkers and associated gene polymorphism in young ST-segment elevation myocardial infarction. Indian Heart J 75 (2023): 68-72.
- Loh WJ, Chang X, Aw TC, et al. Lipoprotein(a) as predictor of coronary artery disease and myocardial infarction in a multi-ethnic Asian population. Atherosclerosis 349 (2022): 160-165.
- Mahto SK, Sheoran A, Gadpayle AK, et al. Evaluation of lipoprotein (a) [Lp(a)] and lipid abnormalities in patients with newly detected hypertension and its association with severity of hypertension. J Family Med Prim Care 11 (2022): 1508-1513.
- Nissen SE, Wolski K, Cho L, et al. Lipoprotein(a) levels in a global population with established atherosclerotic cardiovascular disease. Open Heart 9 (2022): e002060. Erratum in: Open Heart. 9 (2022): e002060corr1.
- Shukla AN, Jayaram AA, Doshi D, et al. The Young Myocardial Infarction Study of the Western Indians: YOUTH Registry. Glob Heart 14 (2019): 27-33.
- Wadhwa D, Mahajan VK, Mehta KS, et al. Malondialdehyde, lipoprotein-a, lipoprotein ratios, comprehensive lipid tetrad index and atherogenic index as surrogate markers for cardiovascular disease in patients with psoriasis: a case–control study. Arch Dermatol Res 311 (2019): 287-297.
- Jain M, Sawant R, Panchal H, et al. Hypercholesterolemia in Acute Coronary Syndrome Patients in India-Secondary outcome results from a retrospective Real-World Evidence Study. In PGIMER Chandigarh (2023).
- Sawhney J, Singh J, Kandpal B, et al. Dual heritable risk for ASCVD – elevated lipoprotein(a) in familial hypercholesterolemia. Atherosclerosis 395 (2024): 117990.
- Amin N, Devasia T, Kamath SU, et al. Association between Lipoprotein(a) concentration and adverse cardiac events in patients with coronary artery disease: An observational cohort study. Indian Heart J 76 (2024): 197-201.
- Vijayakumar M, Vasudevan DM, Sundaram KR, et al. A randomized study of coconut oil versus sunflower oil on cardiovascular risk factors in patients with stable coronary heart disease. Indian Heart J 68 (2016): 498-506.
- Bansal SK. Conventional and Advanced Lipid Parameters in Premature Coronary Artery Disease Patients in India. J Clin Diagn Res 9 (2015): BC07-BC11.
- Mukherjee S, Manna K, Datta S. Prevalence of Novel Risk Factors in Patients of Acute Coronary Syndrome in Eastern India: A Detailed Analysis. International Cardiovascular Forum Journal 4 (2015): 14-18.
- Yusuf J, Yadav N, Mukhopadhyay S, et al. Relook at lipoprotein (A): Independent risk factor of coronary artery disease in North Indian population. Indian Heart J 66 (2014): 272-279.
- Chakraborty B, Vishnoi G, Goswami B, et al. Lipoprotein(a), Ferritin, and Albumin in Acute Phase Reaction Predicts Severity and Mortality of Acute Ischemic Stroke in North Indian Patients. J Stroke Cerebrovasc Dis 22 (2013): e159-67.
- Mishra MN, Kalra R, Rohatgi S. Clinical profile, common thrombophilia markers and risk factors in 85 young Indian patients with arterial thrombosis. Sao Paulo Med J 131 (2013): 384-388.
- Himabindu G, Rajasekhar D, Latheef K, et al. Factor V Leiden mutation is not a predisposing factor for acute coronary syndromes. Indian Heart J 64 (2012): 570-575.
- Banerjee D, Wong EC, Shin J, et al. Racial and Ethnic Variation in Lipoprotein (a) Levels among Asian Indian and Chinese Patients. J Lipids (2011).
- Chaudhary R, Chauhan A, Singhal M, et al. Risk factor profiling and study of atherosclerotic coronary plaque burden and morphology with coronary computed tomography angiography in coronary artery disease among young Indians. Int J Cardiol 240 (2017): 452-457.
- Gulati S, Misra A, Pandey RM. Effect of Almond Supplementation on Glycemia and Cardiovascular Risk Factors in Asian Indians in North India with Type 2 Diabetes Mellitus: A 24–Week Study. Metab Syndr Relat Disord 15 (2017): 98-105.
- Goswami B, Rajappa Med, SINGh B, et al. Inflammation and dyslipidaemia: a possible interplay between established risk factors in north indian males with coronary artery disease. Cardiovasc J Afr 21 (2010): 103-108.
- Gambhir JK, Kaur H, Prabhu KM, et al. Association between lipoprotein(a) levels, apo(a) isoforms and family history of premature CAD in young Asian Indians. Clin Biochem 41(2008): 453-458.
- Rajappa M, Sridhar MG, Balachander J, et al. Lipoprotein (a) and comprehensive lipid tetrad index as a marker for coronary artery disease in NIDDM patients in South India. Clinica Chimica Acta 372(2006): 70-75.
- Superko HR, Enas EA, Kotha P, et al. High‐Density Lipoprotein Subclass Distribution in Individuals of Asian Indian Descent: The National Asian Indian Heart Disease Project. Prev Cardiol 8 (2005): 81-86.
- Mahajan D, Bermingham MA. Risk factors for coronary heart disease in two similar Indian population groups, one residing in India, and the other in Sydney, Australia. Eur J Clin Nutr 58 (2004): 751–760.
- Rajasekhar D, Saibaba KSS, Srinivasa Rao PVLN, et al. Lipoprotein (A): Better assessor of coronary heart disease risk in south Indian population. Indian J Clin Biochem 19 (2004): 53-59.
- Singh RB, Pella D, Sharma JP, et al. Increased concentrations of lipoprotein(a), circadian rhythms and metabolic reactions evoked by acute myocardial infarction, associated with acute reactions in relation to large breakfasts. Biomed Pharmacother Suppl 1 (2004): S116-S122.
- Singh J, Sawhney JPS, Mehta A, et al. Prevalence of Elevated Lipoprotein(A) in Patients with Familial Hypercholesterolemia. Indian Heart J 75 (2023): S4.
- Angeline T, Aruna R, Ramadevi K, et al. Serum lipoprotein (a) and lipid profile in young South Indian patients with myocardial infarction. Indian J Clin Biochem 18 (2003): 103–106.
- Geethanjali FS, Luthra K, Lingenhel A, et al. Analysis of the apo(a) size polymorphism in Asian Indian populations: association with Lp(a) concentration and coronary heart disease. Atherosclerosis 169 (2023): 121–130.
- Tan JHH, Low PS, Tan YS, et al. ABCA1 gene polymorphisms and their associations with coronary artery disease and plasma lipids in males from three ethnic populations in Singapore. Hum Genet 113 (2003): 106–117.
- Tavridou A, Unwin N, Bhopal R, et al. Predictors of lipoprotein(a) levels in a European and South Asian population in the Newcastle Heart Project. Eur J Clin Investigation 33 (2003): 686–692.
- Goyal P, Da GS, Bal BS, et al. Prospective, noninterventional, uncontrolled, open-chart, pharmacoepidemiologic study of prescribing patterns for lipid-lowering drugs at a tertiary care teaching hospital in North India. Clin Ther 24 (2002): 2064-2076.
- Hoogeveen RC, Gambhir JK, Gambhir DS, et al. Evaluation of Lp[a] and other independent risk factors for CHD in Asian Indians and their USA counterparts. J Lipid Res 42 (2001): 631-638.
- Ramachandran A, Sathyamurthy I, Snehalatha C, et al. Risk Variables for Coronary Artery Disease in Asian Indians. Am J Cardiol 87 (2001): 267-271.
- Gupta R, Kastia S, Rastogi S, et al. Lipoprotein(a) in coronary heart disease: a case-control study. Indian Heart J 52(2000): 407–410.
- Gambhir JK, Kaur H, Gambhir DS, et al. Lipoprotein(a) as an independent risk factor for coronary artery disease in patients below 40 years of age. Indian Heart J 52 (2000): 411–415.
- Deepa R, Mohan A, Rema M, et al. Lipoprotein(a) in South Indian type 2 diabetic subjects in relation to diabetic vascular complications. J Assoc Physicians India 50 (2002): 657–661.
- Chandni R. Lipoprotein(a) in type 2 diabetic subjects and its relationship to diabetic microvascular complications. World J Diabetes 3 (2012): 105-109.
- Chopra R, Saramma J, Mary J, et al. Lipoprotein(a) as a risk factor for diabetic retinopathy in patients with type 2 diabetes mellitus. Indian J Ophthalmol 55 (2007): 195.
- Singla S, Kaur K, Kaur G, et al. Lipoprotein (a) in type 2 diabetes mellitus: Relation to LDL:HDL ratio and glycemic control. Int J Diab Dev Ctries 29 (2009): 80.
- Ashfaq F, Goel P, Sethi R, et al. Lipoprotein (a) levels in relation to severity of coronary artery disease in north Indian patients. Heart Views 14 (2013): 12.
- Velmurugan K, Deepa R, Ravikumar R, et al. Relationship of lipoprotein(a) with intimal medial thickness of the carotid artery in Type 2 diabetic patients in south India. Diabet Med 20 (2003): 455-461.
- Rohit A, Haridas N. Studies on apolipoproteins (Apo A1 & Apo B) and lipoprotein (a) along with lipid profile in the patients of type ii diabetes mellitus and metabolic syndrome. International Journal of Medical and Biomedical Studies.
- Kalaivani R, Anuja K, Uma T, et al. Evaluation of Serum Lipoprotein (a) Levels and Novel Lipid Indices in Patients with Chronic Kidney DiseaseA Case-control Study. J Clin Diagn Res 17 (2003): BC15-BC19
- Behera D, Singh B, Behera S, et al. Lipoprotein(a) and high-sensitive C-reactive protein as risk factors of coronary heart disease. J Nat Sc Biol Med 10 (2019): 189.
- Sontakke A, Tilak M, More V, et al. Prevalence of Elevated Serum Homocysteine and Serum Lipoprotein ‘a’ in Women. J Clin Diagn Res 8 (2014): CC13-CC15.
- Pal K. Role of lipoprotein (A) as a Nonconventional Risk Factor in Patients of Acute Myocardial Infarction in Tertiary Centre of North India. Journal of Medical Science And clinical Research 2018.
- Dhamija RK, Gaba P, Arora S, et al. Homocysteine and lipoprotein (a) correlation in ischemic stroke patients. J Neurol Sci 281 (2009): 64-68.
- Sawhney JP, Kumar A, Tyagi K, et al. Prevalence of Lp(a) in acute coronary syndrome and its association with severity of disease among patients admitted to a tertiary care hospital. Atherosclerosis 379 (2023): S52.
- Koschinsky ML, Bajaj A, Boffa MB, et al. A focused update to the 2019 NLA scientific statement on use of lipoprotein(a) in clinical practice. J Clin Lipidol 18 (2024): e308-e319.
- Velilla TA, Guijarro C, Ruiz RC, et al. Consensus document for lipid profile determination and reporting in Spanish clinical laboratories. What parameters should be included in a basic lipid profile? Nefrologia (Engl Ed) 43 (2023): 474-483.
- Ward NC, Watts GF, Bishop W, et al. Australian Atherosclerosis Society Position Statement on Lipoprotein(a): Clinical and Implementation Recommendations. Heart Lung Circ 32 (2023):287-296. Erratum in: Heart Lung Circ 35 (2026): e15.
- Li JJ, Ma CS, Zhao D, et al. Beijing Heart Society and Expert Committee. Lipoprotein(a) and Cardiovascular Disease in Chinese Population: A Beijing Heart Society Expert Scientific Statement. JACC Asia 2 (2022): 653-665.
- Kronenberg F, Mora S, Stroes ESG, et al. Lipoprotein(a) in atherosclerotic cardiovascular disease and aortic stenosis: a European Atherosclerosis Society consensus statement. Eur Heart J 43 (2022): 3925-3946.
- Durlach V, Bonnefont-Rousselot D, Boccara F, et al. Lipoprotein(a): Pathophysiology, measurement, indication and treatment in cardiovascular disease. A consensus statement from the Nouvelle Société Francophone d'Athérosclérose (NSFA). Arch Cardiovasc Dis 14 (2021): 828-847.
- Pearson GJ, Thanassoulis G, Anderson TJ, et al. 2021 Canadian Cardiovascular Society Guidelines for the Management of Dyslipidemia for the Prevention of Cardiovascular Disease in Adults. Can J Cardiol 37 (2021): 1129-1150.
- Puri R, Mehta V, Iyengar SS, et al. Lipid Association of India Expert Consensus Statement on Management of Dyslipidemia in Indians 2020: Part III. J Assoc Physicians India 68 (2020): 8-9.
- Handelsman Y, Jellinger PS, Guerin CK, et al. Consensus Statement by the American Association of Clinical Endocrinologists and American College of Endocrinology on the Management of Dyslipidemia and Prevention of Cardiovascular Disease Algorithm - 2020 Executive Summary. Endocr Pract 26 (2020): 1196-1224.
- Wilson DP, Jacobson TA, Jones PH, et al. Use of Lipoprotein(a) in clinical practice: A biomarker whose time has come. A scientific statement from the National Lipid Association. J Clin Lipidol 13 (2019): 374-392. Erratum in: J Clin Lipidol 16 (2022): e77-e95.
- Cegla J, Neely RDG, France M, et al. HEART UK Medical, Scientific and Research Committee. HEART UK consensus statement on Lipoprotein(a): A call to action. Atherosclerosis 291 (2019): 62-70. Erratum in: Atherosclerosis 296 (2020): 48.
- Mach F, Baigent C, Catapano AL, et al. ESC Scientific Document Group. 2019 ESC/EAS Guidelines for the management of dyslipidaemias: lipid modification to reduce cardiovascular risk. Eur Heart J 41 (2020): 111-188. Erratum in: Eur Heart J 41 (2020): 4255.
- Grundy SM, Stone NJ, Bailey AL, et al. 2018 AHA/ACC/AACVPR/AAPA/ABC/ACPM/ADA/AGS/APhA/ASPC/NLA/PCNA Guideline on the Management of Blood Cholesterol: A Report of the American College of Cardiology/American Heart Association Task Force on Clinical Practice Guidelines. Circulation 139 (2019): e1082-e1143. Erratum in: Circulation 139 (2019): e1182-e1186Erratum in: Circulation 148 (2023): e5.
- Jun-Xu Gu, Shan-Shan Li, Ming Su, et al. Lipoprotein(a) levels and genetic polymorphisms in LPA genes may contribute to risk of coronary heart disease. Int J Clin Exp Med 12 (2019): 10845-10850.
- Gambhir JK, Kaur H, Prabhu KM, et al. Association between lipoprotein(a) levels, apo(a) isoforms and family history of premature CAD in young Asian Indians. Clin Biochem 41 (2008):453-458.
- Mehta A, Jain V, Saeed A, et al. Lipoprotein (a) and ethnicities. Atherosclerosis 349 (2022): 42-52. s
- Banach M. Lipoprotein (a): The enemy that we still don’t know how to defeat. Eur Heart J Open 3 (2023): oead080.
- Fogacci F, Di Micoli V, Sabouret P, et al. Lifestyle and Lipoprotein(a) Levels: Does a Specific Counseling Make Sense? J Clin Med 13 (2024): 751.
- Tian X, Zhang N, Tse G, et al. Association between lipoprotein(a) and premature atherosclerotic cardiovascular disease: a systematic review and meta-analysis. Banach M, editor. European Heart Journal Open 4 (2024): oeae031.
- Hamid IH, Muppa N, Modi D, et al. Effect of Increased Level of Lipoprotein(a) on Cardiovascular Outcomes in Patients With Ischemic Heart Disease: A Systematic Review and Meta-Analysis. Cureus 16 (2024): e72776.
- Amiri M, Raeisi-Dehkordi H, Verkaar AJCF, et al. Circulating lipoprotein (a) and all-cause and cause-specific mortality: a systematic review and dose-response meta-analysis. Eur J Epidemiol 38 (2023): 485-499.
- Dong-Yi Chen, Ming-Lung Tsai, Ming-Jer Hsieh, et al. Clinical significance of elevated lipoprotein(a) in primary and secondary prevention: a multi-institutional study. Eur J Prev Cardiol 2025.
- Cai A, Li L, Zhang Y, et al. Lipoprotein(a): a promising marker for residual cardiovascular risk assessment. Dis Markers 35 (2013): 551-559.
- Fukase T, Dohi T, Takahashi N, et al. Clinical significance of lipoprotein(a) as a residual risk factor for atherosclerotic coronary plaque progression in statin-treated patients with coronary artery disease. Sci Rep 16 (2025): 1196.
- Kumar P, Swarnkar P, Misra S, et al. Lipoprotein (a) level as a risk factor for stroke and its subtype: A systematic review and meta-analysis. Sci Rep 11 (2021): 15660.
- Smolders B, Lemmens R, Thijs V. Lipoprotein (a) and stroke: a meta-analysis of observational studies. Stroke 38 (2007): 1959–1966.
- Nave AH, Lange KS, Leonards CO, et al. Lipoprotein (a) as a risk factor for ischemic stroke: a meta-analysis. Atherosclerosis 242 (2015): 496–503.
- Kosmas CE, Bousvarou MD, Papakonstantinou EJ, et al. Lipoprotein (a) and cerebrovascular disease. Journal of International Medical Research 52 (2024).
- Colantonio LD, Goonewardena SN, Wang Z, et al. Incident CHD and ischemic stroke associated with lipoprotein(a) by levels of Factor VIII and inflammation. Journal of Clinical Lipidology 17 (2023): 529-537.
- Guo Y, Guo Z, Zhu Y, et al. Associations between lipoproteins and risk of ischemic stroke: a systematic review and meta-analysis of Mendelian randomization studies. Front Neurol 16 (2026): 1694731.
- Taskinen MR, Puolakka J, Pyörälä T, et al. Hormone replacement therapy lowers plasma Lp(a) concentrations. Comparison of cyclic transdermal and continuous estrogen-progestin regimens. Arterioscler Thromb Vasc Biol 16 (1996): 1215–1221.
- Shlipak MG, Simon JA, Vittinghoff E, et al. Estrogen and progestin, lipoprotein(a), and the risk of recurrent coronary heart disease events after menopause. JAMA 283 (2000): 1845–1852.
- Arnett DK, Blumenthal RS, Albert MA, et al. 2019 ACC/AHA Guideline on the Primary Prevention of Cardiovascular Disease: A Report of the American College of Cardiology/American Heart Association Task Force on Clinical Practice Guidelines. Circulation 140 (2019): e596-e646. Erratum in: Circulation 140 (2019): e649-e650. Erratum in: Circulation 141 (2020): e60. Erratum in: Circulation 141 (2020): e774.
- Nordestgaard BG, Chapman MJ, Ray K, et al. European Atherosclerosis Society Consensus Panel. Lipoprotein(a) as a cardiovascular risk factor: current status. Eur Heart J 31 (2010): 2844-2853.
- Bhatia HS, Wandel S, Willeit P, et al. Independence of Lipoprotein(a) and Low-Density Lipoprotein Cholesterol-Mediated Cardiovascular Risk: A Participant-Level Meta-Analysis. Circulation 151 (2025): 312-321.
- Tsimikas S, Moriarty PM, Stroes ES. Emerging RNA Therapeutics to Lower Blood Levels of Lp(a): JACC Focus Seminar 2/4. J Am Coll Cardiol 77 (2021): 1576-1589.s