Ebiakpor Bainkpo Agbedi1* and Pere-Ere Glory Agbedi2
1Department of Planning, Research, and Statistics, Bayelsa State Primary Healthcare Board, Yenagoa, Nigeria
2Department of Medicine, Niger-Delta University, Wilberforce Island, Nigeria
*Corresponding Author: Ebiakpor Bainkpo Agbedi, Department of Planning, Research, and Statistics, Bayelsa State Primary Healthcare Board, Yenagoa, Nigeria.
Received: 01 September 2026; Accepted: 10 September 2026; Published: 18 September 2026
Background: Zero-dose children represented an important indicator of inequitable access to routine immunization and essential primary healthcare services. Aggregated immunization indicators could conceal substantial geographical disparities within smaller administrative units. This study assessed the prevalence and distribution of zero-dose children across Local Government Areas (LGAs) and wards, with emphasis on identifying high-burden geographical areas for targeted immunization interventions.
Methods: A retrospective cross-sectional descriptive study involving secondary analysis of routine immunization data was conducted across eight LGAs and 105 wards in Bayelsa State, Nigeria. A census approach was used to include all eligible administrative units. Target-population and Penta1 vaccination data were reviewed, cleaned and analysed, with the zero-dose estimates serving as the principal reference. Negative zero-dose residuals resulting from vaccination counts exceeding target populations were treated as zero for prevalence calculations and flagged as data-quality concerns. Frequencies, percentages, prevalence estimates, rankings and cumulative burden analyses were used to describe LGA- and ward-level variations.
Results: The analysis covered an estimated target population of 88,363 children, of whom 19,498 were classified as zero-dose, representing an overall adjusted prevalence of 22.1%. Considerable geographical variation was observed across LGAs and wards. Southern Ijaw LGA recorded the highest burden, with 8,817 zero-dose children, a prevalence of 53.2%, and approximately 45.2% of the overall adjusted burden. Yenagoa ranked second with 5,305 zero-dose children and a prevalence of 28.9%. At ward level, the burden was highly concentrated: the 20 highest-burden wards accounted for approximately 65.8% of all zerodose children, while 16 wards recorded prevalence of at least 50%. Data-quality inconsistencies were also identified, including wards where reported vaccination exceeded estimated target populations.
Conclusion: Zero-dose children were unevenly distributed across LGAs and wards, with a substantial proportion of the burden concentrated within relatively few geographical areas. The findings demonstrated that state-level averages could obscure important subnational inequalities and highlighted the value of analysing both prevalence and absolute burden. Strengthened ward-level microplanning, targeted outreach and mobile vaccination services, prioritization of high-burden and hard-to-reach areas, and improved routine immunization data quality were required to reduce zero-dose prevalence and advance equitable immunization coverage.
Zero-dose children; Routine immunization; Zero-dose prevalence; Geographical distribution; Local Government Area; Ward; Immunization equity; Nigeria
Zero-dose children articles; Routine immunization articles; Zero-dose prevalence articles; Geographical distribution articles; Local Government Area articles; Ward articles; Immunization equity articles; Nigeria articles
1. Introduction
Childhood immunization is one of the most effective and cost-effective public health interventions for preventing morbidity, disability, and mortality from vaccine-preventable diseases. Vaccination programmes have contributed substantially to improvements in child survival by protecting children against diseases such as diphtheria, pertussis, tetanus, poliomyelitis, measles, tuberculosis, and hepatitis B. Despite these achievements, substantial numbers of children, particularly in low- and middle-income countries, remain unreached by routine immunization services. These children constitute an important marker of inequity in access to essential primary health-care services. Vaccination is estimated to prevent millions of deaths annually, yet persistent gaps in routine immunization coverage continue to leave vulnerable populations exposed to preventable disease outbreaks. Increasing attention has therefore been directed towards zero-dose children, who represent populations that have been persistently missed by routine immunization systems [1]. The World Health Organization (WHO), through the Immunization Agenda 2030 [2], operationally defines zero-dose children as those who have not received the first dose of a diphtheria-tetanus-pertussis-containing vaccine (DTP1). In Nigeria, the first dose of the pentavalent vaccine (Penta1), which contains diphtheria, tetanus and pertussis antigens, can consequently serve as an operational indicator for identifying children who have not been reached by routine immunization services. Zero-dose status is therefore more than an indication of non-vaccination; it can serve as a proxy for limited contact with essential health services and underlying social and geographical disadvantage. The global focus on zero-dose children is closely linked to the equity objectives of immunization agenda, which emphasize leaving no child behind and extending vaccination services to populations that have historically been underserved [3]. Identifying where zero-dose children live is particularly important because national or state-level coverage estimates can conceal substantial inequalities within smaller administrative areas. WHO emphasizes that identifying zero-dose children and underserved communities at national and subnational levels can facilitate analysis of the underlying causes of under-vaccination and reveal barriers affecting particular communities and geographical areas. Thus, analysis at Local Government Area (LGA) and ward levels provides a more operationally useful picture of immunization inequity than aggregated coverage statistics alone.
Nigeria continues to experience a substantial zero-dose burden. Previous national analyses have demonstrated persistent inequalities in childhood vaccination according to geographical location, socioeconomic status, maternal education and place of residence. An analysis of Nigerian data reported that approximately 19% of children had received none of the basic vaccinations, with the proportion being greater among children living in rural areas. Basic vaccination coverage was also considerably lower in rural than urban populations. Historical analysis of Nigeria Demographic and Health Survey data similarly demonstrated that zero-dose prevalence varied considerably across geographical regions and was consistently higher in rural areas, while maternal education and household wealth were strongly associated with the probability of a child receiving vaccination [4,5].
Beyond individual and household characteristics, the Nigerian zero-dose challenge has an important geographical dimension. High-resolution geospatial analysis of Nigeria's 2021 Multiple Indicator Cluster Survey/National Immunization Coverage Survey demonstrated substantial heterogeneity in the distribution of zero-dose and under-immunized children across the country [6,7]. Importantly, the study showed that aggregation at national or state level could obscure smaller pockets of children who remained unreached. The authors demonstrated the value of producing estimates at LGA and ward/community levels for identifying vulnerable populations, tailoring immunization strategies, monitoring progress and strengthening health systems. Other geospatial studies have similarly identified substantial subnational variation in vaccination coverage and zero-dose prevalence, reinforcing the importance of analysing immunization inequalities at increasingly disaggregated geographical levels [8,9]. Such geographical inequalities might be particularly relevant in settings where communities are dispersed, rural, riverine or otherwise difficult to reach. Distance from health facilities, transportation constraints, difficult terrain, population mobility, shortages of health workers, vaccine availability and irregular outreach services could interact to limit access to routine immunization. A review of evidence from Nigeria identified maternal factors, differences between communities, proximity to vaccination services and awareness of immunization among the frequently reported factors associated with missed vaccination. More recent evidence has continued to identify logistical challenges, socioeconomic conditions and health-system deficiencies as important barriers to routine immunization in Nigeria [10]. Zero-dose children might therefore not be uniformly distributed within a population. Some LGAs might contain disproportionately large numbers of unreached children, while within the same LGA, particular wards might constitute concentrated pockets or “hotspots” of zero-dose burden. This distinction between prevalence and absolute burden was programmatically important. A relatively small ward might have a high prevalence of zero-dose children but contribute fewer children to the total burden, whereas a densely populated ward with a moderate prevalence might contain a much larger absolute number of zero-dose children. Examining both measures could therefore provide a stronger basis for prioritization than reliance on vaccination coverage percentages alone [8]. Ward-level analysis was especially important for routine immunization planning because the ward represents an operational level at which health facilities, outreach sessions, community mobilization, defaulter tracking and other immunization activities could be organized. Evidence from geospatial studies in Nigeria indicates that analyses conducted at coarse spatial scales might mask important heterogeneity, whereas estimates at ward and health-facility catchment levels could identify areas containing considerable numbers of unvaccinated children and provide evidence for targeted follow-up routine immunization strategies [9]. Identifying high-burden wards might consequently enable immunization programmes to concentrate limited human, financial and logistical resources where the greatest numbers of unreached children reside.
Furthermore, monitoring zero-dose children at subnational level provides an opportunity to evaluate immunization equity rather than merely overall programme performance. Evidence indicates that Nigerian states or geographical areas with apparently similar levels of vaccination coverage might nevertheless differ considerably in the distribution of vaccination benefits across population groups. Recent evidence also suggested that geographical inequalities in DTP vaccination coverage and zero-dose prevalence remain substantial across Nigeria. Consequently, aggregate indicators should be complemented by analyses that determine how the burden was distributed between ward and within LGAs. Against this background, systematic assessment of the prevalence and distribution of zero-dose children at LGA and ward levels was essential for identifying geographical disparities that might otherwise remain hidden within aggregated immunization statistics. Using updated zero-dose information, this study therefore seeks to determine the magnitude of the zero-dose burden, compare prevalence across LGAs, examine its distribution across wards, identify high-burden geographical hotspots and determine the extent to which the overall burden was concentrated in particular locations. Such evidence could strengthen data-driven microplanning, guide prioritization of outreach and mobile immunization services, improve allocation of resources and support targeted strategies for reaching children and communities that remain persistently underserved by routine immunization services.
Statement of the Problem
Despite sustained global and national investments in childhood immunization, a considerable number of children had remained unreached by routine vaccination services. These children, commonly referred to as zero-dose children, had represented an important indicator of inequitable access to essential primary health-care services. The World Health Organization (WHO) had operationally defined zero-dose children as those who had not received the first dose of a diphtheria-tetanus-pertussis-containing vaccine (DTP1), which corresponded to the first dose of pentavalent vaccine (Penta1) in the Nigerian routine immunization programme. The persistence of zero-dose children had remained a major concern under the Immunization Agenda 2030 [2], which had prioritized reaching children and communities that had previously been missed by routine immunization services [11]. Globally, the problem of zero-dose children had remained substantial. In 2025, approximately 13.5 million children worldwide had received no routine vaccination, demonstrating that significant gaps in access to childhood immunization had persisted despite improvements in vaccine delivery [12]. The problem had extended beyond non-receipt of vaccines because zero-dose children frequently belonged to communities experiencing broader socioeconomic and health-service disadvantages. The IA2030 monitoring framework had recognized that zero-dose children were disproportionately represented in poor, remote, marginalized and otherwise underserved populations and that reaching them had therefore constituted an important component of achieving immunization equity. Nigeria had carried a particularly substantial share of the zero-dose burden. High-resolution analysis of the 2021 Nigeria Multiple Indicator Cluster Survey/National Immunization Coverage Survey had indicated that Nigeria had more than 2.3 million zero-dose children based on 2024 WHO/UNICEF estimates [13]. More importantly, zero-dose children had not been uniformly distributed across the country; substantial geographical variations had existed between and within administrative areas [7]. Consequently, national or state-level vaccination coverage estimates alone had provided an incomplete representation of the populations that remained unreached. Geographical inequalities had constituted an important dimension of Nigeria's immunization challenge. Utazi et al. [14] demonstrated persistent geographical inequities in vaccination coverage and zero-dose prevalence using nationally representative household surveys and high-resolution geospatial modelling. Their analysis had shown that the distribution of zero-dose children varied substantially across geographical locations and that missed communities remained vulnerable to vaccine-preventable diseases. More recent evidence had also demonstrated significant geographical differences in DTP coverage and zero-dose prevalence across Nigeria. Umar et al. [15] reported statistically significant subnational inequalities between 2018 and 2024, indicating that improvements in some immunization indicators had not eliminated geographical disparities in access to vaccination. A major challenge had therefore been that aggregated immunization indicators could conceal pockets of zero-dose children within smaller geographical units. An LGA could have appeared to perform relatively well when assessed using an overall vaccination coverage estimate, while particular wards within the same LGA could still have contained substantial numbers of unreached children. High-resolution mapping in Nigeria had demonstrated the usefulness of disaggregating zero-dose estimates to LGA and ward/community levels for identifying vulnerable populations, predicting risk areas and tailoring immunization strategies [7]. Without such disaggregated analysis, local concentrations of zero-dose children could have remained hidden within apparently satisfactory aggregate coverage figures. The problem had also involved an important distinction between zero-dose prevalence and absolute zero-dose burden. A ward with a small target population could have recorded a high prevalence of zero-dose children but contributed relatively few children to the overall burden. Conversely, a more populous ward with a lower prevalence could have contained a considerably larger absolute number of zero-dose children. Therefore, reliance on prevalence or coverage percentages alone could have resulted in inappropriate prioritization of geographical areas. Assessing both the proportion and absolute number of zero-dose children had been necessary for identifying areas where interventions could potentially reach the greatest number of unreached children. The value of mapping both prevalence and numbers at fine geographical scales had been demonstrated in previous Nigerian studies.
Furthermore, the persistence of zero-dose children had suggested that conventional fixed-site routine immunization strategies might not have reached all communities equally. Remote and underserved populations had faced particular challenges in accessing immunization services. WHO had recognized remote communities as one of the major geographical contexts in which zero-dose children had been concentrated. This had made localized identification of zero-dose populations particularly important for programme managers responsible for planning outreach sessions, mobile vaccination services, community mobilization, defaulter tracking and allocation of limited immunization resources. The problem had also become increasingly relevant to the global objective of achieving equitable immunization coverage. At the midpoint of IA2030, WHO reported that most global immunization targets remained off track and emphasized the need for stronger data-driven decision-making and more focused action to reach zero-dose children and vulnerable populations. In 2026, WHO Member States [16] similarly reaffirmed the importance of reaching zero-dose and under-immunized children, particularly those living in remote, fragile and otherwise underserved settings. These developments had reinforced the importance of generating locally disaggregated evidence capable of guiding targeted immunization interventions. Within the study area, available routine immunization data had indicated considerable differences in the estimated zero-dose burden across LGAs and wards. However, the extent to which these children had been concentrated within particular geographical locations had not been sufficiently characterized through systematic LGA- and ward-level analysis. Without such evidence, programme managers could have encountered difficulties in determining which LGAs and wards required the greatest attention, distinguishing areas with high prevalence from areas with high absolute burden, and prioritizing limited human, financial and logistical resources. Nevertheless, reliance on aggregated immunization performance indicators had potentially limited the identification of localized pockets of under-immunization. This evidence gap could have affected the effectiveness of routine immunization microplanning, outreach scheduling, mobile vaccination activities, community engagement, supportive supervision and other strategies intended to reach missed children. A systematic analysis of the distribution and concentration of zero-dose children at operationally relevant administrative levels had therefore been required. Consequently, this study was undertaken to determine the prevalence and distribution of zero-dose children at LGA and ward levels using available immunization data updated. The study had sought to quantify the overall burden, compare prevalence across LGAs, identify high-burden wards, classify wards according to zero-dose prevalence and determine the extent to which the total zero-dose burden had been concentrated within particular geographical areas. The evidence generated was expected to have provided a stronger empirical basis for geographically targeted microplanning, equitable allocation of immunization resources and development of context-specific strategies for reaching children who had remained unreached by routine immunization services.
Justification of the Study
This study was justified by the continuing public health importance of children who had remained unreached by routine immunization services. Zero-dose children represented one of the clearest indicators of inequity in access to essential primary health-care services. The World Health Organization operationally defined zero-dose children as those who had not received the first dose of a diphtheria-tetanus-pertussis-containing vaccine (DTP1). The Immunization Agenda 2030 had consequently placed particular emphasis on identifying and reaching zero-dose and under-immunized children as part of the global commitment to improve immunization coverage and equity. The study was particularly necessary because the burden of zero-dose children had not been uniformly distributed across geographical areas. National, state or other aggregated estimates could have concealed substantial inequalities occurring at lower administrative levels. Evidence from Nigeria had demonstrated considerable geographical heterogeneity in zero-dose prevalence across LGAs and communities. High-resolution analysis of the 2021 Nigeria Multiple Indicator Cluster Survey/National Immunization Coverage Survey showed that mapping zero-dose children at LGA and ward/community levels provided valuable information for identifying vulnerable populations, tailoring immunization strategies, monitoring progress and strengthening health systems. Conducting the analysis at both LGA and ward levels was therefore justified because it provided greater geographical resolution than state-level immunization indicators. Previous geospatial research in Nigeria had demonstrated that analyses conducted at coarse spatial scales could mask important local variations in vaccination coverage. Ward-level and health-facility catchment analyses had identified locations containing substantial numbers of unvaccinated children even where broader administrative indicators suggested better performance. Such fine-scale analyses had provided an evidence base for planning targeted routine immunization interventions. The study was also justified by the need to distinguish between the prevalence and the absolute burden of zero-dose children. Areas with the highest prevalence did not necessarily contain the largest number of zero-dose children because the size of the target population differed across LGAs and wards. Conversely, wards with moderately high prevalence but large target populations could have contributed substantially to the overall number of unreached children. Examining both prevalence and absolute numbers therefore provided a more comprehensive basis for identifying priority areas and allocating resources than relying solely on vaccination coverage percentages. Nigerian geospatial studies had similarly demonstrated the programmatic value of estimating both zero-dose prevalence and numbers of unvaccinated children at subnational levels [17]. Furthermore, the study was justified by the need to identify zero-dose hotspots that could be prioritized for intervention. Evidence from Nigeria had shown that zero-dose children could remain concentrated within particular wards and health-facility catchment areas despite vaccination campaigns and improvements in aggregate coverage. Identification of such residual pockets had enabled programme managers to determine where routine immunization strategies required strengthening and where subsequent outreach or campaign activities could be targeted more effectively. Earlier programme experience in Nigeria had also demonstrated that ward-level geographical analysis could identify areas with high densities of zero-dose children and help programmes review and strengthen vaccination strategies. The analysis was further warranted from an equity perspective. Zero-dose status had frequently reflected broader social and health-service deprivation rather than an isolated failure to receive vaccination. Immunization agenda recognized that zero-dose children were often found among marginalized and underserved populations and emphasized expansion of subnational data systems to map and track zero-dose populations. Evidence from Nigeria had similarly shown that zero-dose and under-immunized children were disproportionately represented among socially disadvantaged groups, including poorer households and children whose mothers had lower levels of education [18]. Consequently, identifying areas with high zero-dose prevalence had provided an opportunity to identify communities potentially experiencing wider inequalities in access to primary health care services. The study was also relevant for routine immunization microplanning and resource allocation. Immunization programmes operated with finite human, financial and logistical resources; consequently, evidence was required to determine where these resources could achieve the greatest effect. Identification and ranking of high-burden LGAs and wards could have informed the prioritization of outreach sessions, mobile vaccination teams, vaccine and cold-chain logistics, community mobilization, supportive supervision and defaulter-tracking activities. This approach was consistent with immunization agenda’s emphasis on data-guided immunization programmes and the use of subnational information to identify underserved populations. The study had additional relevance for settings characterized by geographically dispersed or difficult-to-reach populations. Remote communities represented one of the geographical contexts in which zero-dose children were frequently concentrated globally. Therefore, identifying differences between LGAs and wards could have helped programme managers recognize geographical pockets in which conventional fixed-site vaccination services were insufficient and where alternative strategies, including outreach and mobile services, required strengthening. The use of the 2026 zero-dose data further strengthened the justification for the study because it provided an updated assessment of the remaining burden after accounting for available immunization information. Rather than relying exclusively on historical coverage estimates, the analysis provided a more recent operational picture of where zero-dose children remained concentrated. This had enhanced the potential usefulness of the findings for contemporary programme planning, monitoring and prioritization. Finally, the study was justified by its potential contribution to evidence-based decision-making and immunization equity. By quantifying zero-dose prevalence, comparing LGAs, identifying high-burden wards, classifying wards according to prevalence and examining the concentration of the overall burden, the study generated information that could have supported targeted interventions rather than uniform allocation of resources across areas with substantially different needs. This was consistent with evidence that fine-scale zero-dose analyses could support operational planning and follow-up routine immunization strategies.
Overall, the study was considered necessary because it shifted the assessment of routine immunization performance from aggregated coverage indicators towards a more disaggregated, equity-oriented and geographically targeted assessment of unreached children. The findings were expected to have provided evidence for identifying priority LGAs and wards, strengthening microplanning, improving resource allocation, targeting outreach and mobile immunization activities, and supporting progress towards the immunization agenda’s objective of reducing the number of zero-dose children and ensuring that no child was left behind.
General Objective
To determine the prevalence and distribution of zero-dose children across Local Government Areas (LGAs) and wards in the study area, with a view to identifying geographical disparities and priority areas for targeted routine immunization interventions.
Specific Objectives
The study sought to:
- Determine the overall prevalence of zero-dose children in the study area.
- Estimate and compare the prevalence of zero-dose children across the LGAs in the study area.
- Assess the distribution of zero-dose children across wards within the respective LGAs.
- Identify and rank LGAs and wards with the highest burden of zero-dose children based on both absolute numbers and prevalence.
- Classify wards according to their level of zero-dose prevalence to identify low-, moderate-, high-, and very-high-burden areas.
- Determine the proportion of the overall zero-dose burden contributed by each LGA and high-burden ward and assess the geographical concentration of zero-dose children.
Research Questions
The study sought to answer the following research questions:
- What was the overall prevalence of zero-dose children in the study area?
- How did the prevalence of zero-dose children vary across the Local Government Areas (LGAs) in the study area?
- How were zero-dose children distributed across wards within the respective LGAs?
- Which LGAs and wards had the highest burden of zero-dose children in terms of absolute numbers and prevalence?
- How were the wards distributed across different levels of zero-dose prevalence?
- What proportion of the overall zero-dose burden was contributed by each LGA and the high-burden wards?
- To what extent was the zero-dose burden geographically concentrated within particular LGAs and wards in the study area?
Scope and Limitation of the Study
Scope of the Study
- The study focused on the prevalence and distribution of zero-dose children at Local Government Area (LGA) and ward levels within the study area. It covered all eight LGAs and 105 wards represented in the available routine immunization dataset. The analysis was primarily based on the estimated target population, Penta1 vaccination records and the estimated number of zero-dose children, with the 2026 zero-dose status serving as the principal reference period for determining the current burden.
- The study operationally considered zero-dose children as children who had not received the first dose of a diphtheria-tetanus-pertussis-containing vaccine, represented by Penta1 within the routine immunization programme. Zero-dose prevalence was assessed in relation to the target population available for each geographical unit.
- Geographically, the analysis was conducted at two administrative levels. At the LGA level, the study estimated and compared the number and prevalence of zero-dose children and determined each LGA's contribution to the overall burden. At the ward level, the study examined variations in zero-dose prevalence and absolute numbers, ranked high-burden wards, classified wards according to prevalence categories and identified geographical concentrations of unreached children.
- The analytical scope was predominantly descriptive and distributional. Frequencies, proportions, prevalence estimates, rankings and cumulative burden analyses were used to characterize the magnitude and distribution of zero-dose children. Tables and graphical presentations were used to demonstrate geographical differences and identify priority locations for routine immunization interventions.
- The study did not primarily investigate individual-, household-, caregiver- or health-system-level determinants of zero-dose status. Rather, it concentrated on where zero-dose children were located and how their burden was distributed across LGAs and wards. Consequently, the findings were intended to support geographical prioritization, routine immunization microplanning, outreach planning, resource allocation and identification of areas requiring further investigation.
Limitations of the Study
- The study had several limitations that were considered when interpreting its findings. First, the analysis relied on secondary routine immunization and administrative data rather than individually verified vaccination histories. The accuracy of the estimated zero-dose burden therefore depended on the completeness, consistency and quality of the original population and immunization records.
- Second, the denominator used in estimating zero-dose prevalence was based on target-population estimates. Such estimates might not have precisely reflected the actual number of eligible children residing in each LGA or ward because of population growth, migration, displacement and differences between projected and actual populations. Consequently, inaccuracies in population denominators could have resulted in either overestimation or underestimation of zero-dose prevalence.
- Third, the dataset contained instances in which the reported number of vaccinated children exceeded the estimated target population, resulting in negative calculated zero-dose residuals in some wards. Since a negative number of zero-dose children was epidemiologically implausible, these observations indicated possible denominator inaccuracies, vaccination of children from outside the reporting ward, population movement, duplicate reporting or other routine data-quality issues. For prevalence and distributional analysis, negative residuals were treated as zero while being identified as data-quality concerns. This adjustment could have affected the estimated overall burden and should therefore be considered when interpreting the results.
- Fourth, vaccination services were not necessarily restricted to a child's ward of residence. Children could have received vaccines in neighbouring wards or LGAs, particularly where caregivers sought services outside their residential areas. Routine administrative data could therefore have attributed vaccinations to the location of service delivery rather than the child's actual place of residence, potentially affecting the observed geographical distribution.
- Fifth, the study was based primarily on aggregate LGA- and ward-level data. Individual characteristics such as maternal education, household socioeconomic status, caregiver knowledge and attitudes, distance to vaccination sites, transportation difficulties and other determinants of zero-dose status were not available. The study therefore could not establish causal relationships or determine why particular children had remained zero-dose.
- Sixth, although the analysis identified wards with high zero-dose prevalence and absolute burden, the available data did not include precise household or community geographic coordinates for individual zero-dose children. Consequently, the study could identify administrative-level hotspots but could not determine fine-scale spatial clustering within individual wards.
- Finally, the study represented the zero-dose situation based on the available data updated. The findings therefore reflected the situation during the specified reference period and could change as previously unreached children received vaccination, populations changed or routine immunization records were subsequently updated.
Despite these limitations, the study provided useful evidence on the magnitude, geographical variation and concentration of zero-dose children across LGAs and wards. Its disaggregated approach offered an important basis for identifying priority areas, strengthening routine immunization microplanning and guiding more targeted interventions, while highlighting areas where improved data quality and further individual-level research were required.
Literature Review
The distribution of zero-dose children was best understood within the administrative and geographical structures through which routine immunization services were planned and delivered. In Nigeria, the Local Government Area (LGA) constituted the third tier of government, providing an important administrative level for grassroots governance, primary health-care coordination and implementation of immunization programmes. Below the LGA, the ward represented the smallest administrative and electoral division that formed part of a constituency and brought governance and service delivery closer to communities. These administrative levels were particularly relevant to the assessment of childhood immunization because aggregated state-level indicators could have concealed important variations between LGAs and, more importantly, between wards within the same LGA. Examining zero-dose children at both levels therefore provided a clearer understanding of the magnitude, geographical distribution and concentration of unreached children. Against this administrative context, the literature review examined the concept and public health significance of zero-dose children, their prevalence and geographical distribution, inequalities in immunization coverage, factors associated with zero-dose status, and the importance of LGA- and ward-level analysis in identifying high-burden areas. It also reviewed empirical evidence from Nigeria and comparable settings and considered how disaggregated geographical evidence had supported routine immunization microplanning, resource allocation and targeted interventions for populations that remained unreached.
Childhood immunization had remained one of the most important public health interventions for reducing morbidity and mortality associated with vaccine-preventable diseases. Nevertheless, substantial numbers of children had continued to remain outside routine immunization systems, particularly in low- and middle-income countries. These children had increasingly been described as zero-dose children and had become an important focus of global immunization policy because their vaccination status often reflected wider inequalities in access to health and social services. The distribution of zero-dose children had not been geographically uniform. Differences had occurred between countries, regions, states, Local Government Areas (LGAs), wards, communities and households. Consequently, aggregated vaccination coverage estimates could have concealed localized pockets of children who remained unreached. This literature review examined the concept of childhood immunization and zero-dose children, prevalence and distribution of zero-dose children, immunization equity, geographical and health-system factors, LGA- and ward-level approaches, empirical evidence from Nigeria and the broader policy context of the Immunization Agenda 2030. Childhood immunization had constituted an essential component of primary health care and had contributed substantially to reductions in illnesses and deaths caused by vaccine-preventable diseases. Routine immunization programmes had been designed to provide children with vaccines at recommended ages and intervals to establish protection during periods of greatest vulnerability. Beyond protecting individual children, high vaccination coverage had reduced community transmission and the likelihood of outbreaks. However, the benefits of vaccination had depended not only on the availability of vaccines but also on whether health systems successfully reached eligible children. Mahachi et al. [1] reported that achieving high routine immunization coverage had remained challenging in Nigeria and that access to vaccination had been influenced by interconnected individual, community and health-system factors. Their review of 127 publications showed that geographical location, socioeconomic conditions, maternal characteristics, proximity to vaccination services and awareness of immunization had repeatedly influenced vaccine uptake. Routine immunization performance had therefore reflected more than the technical availability of vaccines. It had also reflected the ability of health systems to identify eligible children, maintain vaccine supplies, provide accessible services, mobilize communities and overcome geographical and socioeconomic barriers. The concept of zero-dose children had emerged as an important measure of populations that routine immunization systems had failed to reach. Within the immunization agenda’s framework, zero-dose children had generally been operationalized using receipt of the first dose of a diphtheria-tetanus-pertussis-containing vaccine (DTP1). Thus, children who had not received DTP1 had been considered zero-dose for programme monitoring purposes. In Nigeria, the pentavalent vaccine had contained diphtheria, tetanus and pertussis antigens in addition to hepatitis B and Haemophilus influenzae type b antigens. Consequently, non-receipt of Penta1 had provided an operational measure of zero-dose status in routine immunization data. The concept had differed from under-immunization. A zero-dose child had not initiated the relevant routine vaccination series, whereas an under-immunized or missed-dose child might have received one or more vaccine doses but failed to complete the recommended schedule. Mahachi et al. [1] emphasized that both zero-dose and missed-dose children remained susceptible to vaccine-preventable diseases and were often already affected by poverty, geographical disadvantage and inadequate access to basic health services. Zero-dose status had therefore been interpreted as more than a vaccination indicator. It had increasingly served as a marker of exclusion from essential health services. The global literature developed after the introduction of immunization agenda had similarly focused on zero-dose children as a distinct equity population requiring targeted identification and intervention. Zero-dose prevalence had represented the proportion of the eligible population that had not received the first dose of the reference DTP-containing vaccine. Estimating prevalence had provided an indication of the relative magnitude of the problem within a defined population. However, prevalence needed to be interpreted alongside the absolute number of zero-dose children. The Nigerian burden had remained substantial. Williams et al. [19], using the 2018 Nigeria Demographic and Health Survey, reported that approximately 19% of children aged 12–23 months had received none of the basic childhood vaccines. The proportion had been higher among rural children, with almost one-quarter receiving none of the basic vaccines. The same analysis showed considerable socioeconomic, geographical, maternal and health-service inequalities in vaccination coverage. The distinction between prevalence and absolute burden had been particularly important for programme planning. A geographical area with a small population could have recorded a high prevalence while containing relatively few zero-dose children. Conversely, a large population could have produced a substantial absolute number of zero-dose children even where prevalence was comparatively moderate. Effective prioritization had therefore required assessment of both indicators.
Geographical location had consistently been associated with vaccination inequalities. Aheto et al. [14] demonstrated substantial spatial heterogeneity in vaccination coverage and zero-dose prevalence across Nigeria using nationally representative household surveys and Bayesian geostatistical modelling. Their findings indicated that broad administrative averages could conceal smaller geographical areas where vaccination coverage remained poor. Such heterogeneity had important implications for programme management. If zero-dose children were concentrated geographically, universal allocation of resources without considering local burden could have resulted in inefficient targeting. Conversely, identifying geographical hotspots could have enabled vaccination programmes to direct outreach, community mobilization, supervision and logistical resources towards locations where the need was greatest. Place of residence had been an important determinant of childhood vaccination. Williams et al. [19] found that vaccination coverage in Nigeria had been higher in urban areas than rural areas and that zero-dose children had been more prevalent among rural populations. Geographical isolation could have interacted with other disadvantages. Long travel distances, transportation costs, difficult terrain, dispersed settlements and irregular outreach services could have reduced the likelihood that caregivers accessed vaccination. Mahachi et al. [1] found that access to health facilities and differences between communities were among the factors most frequently associated with missed vaccination in Nigeria. These issues had been especially relevant to riverine and geographically difficult settings, where conventional fixed-site immunization services might not have provided equitable access to all settlements. In such settings, identifying the precise wards contributing to zero-dose burden had been necessary for planning mobile and outreach strategies.
Equity had become central to contemporary immunization policy. Equal availability of vaccination services had not necessarily produced equitable vaccination outcomes because populations differed in geographical accessibility, socioeconomic resources and ability to use health services. Williams et al. [19] demonstrated substantial vaccination inequalities in Nigeria according to household wealth, geographical location, maternal education, antenatal-care utilization and place of delivery. Children from wealthier households, children whose mothers had attended antenatal care, those born in health facilities and children of mothers with secondary or higher education had greater odds of receiving basic vaccination. These findings had suggested that zero-dose status reflected multiple dimensions of disadvantage. Therefore, reducing the zero-dose burden had required strategies extending beyond merely increasing vaccine supply. It had required identification of populations systematically excluded from vaccination and adaptation of service-delivery strategies to their circumstances.
Socioeconomic disadvantage had repeatedly been associated with inadequate vaccination [20]. Household wealth influenced the ability of caregivers to absorb direct and indirect costs associated with accessing health services, including transportation costs and time away from economic activities. Maternal education had also been consistently associated with vaccination uptake [21,22]. Maternal education was identified as one of the most frequently reported factors affecting vaccination in Nigerian studies. Similarly, studies found that maternal education, household wealth, antenatal care and health-facility delivery were significantly associated with childhood vaccination [23,24]. These findings demonstrated that zero-dose prevalence could not be understood exclusively as a failure of caregiver behaviour. It reflected the interaction between socioeconomic circumstances, health literacy, health-service exposure and structural access to vaccination [18]. Health-system barriers had included vaccine stock-outs, shortages of vaccinators, inadequate infrastructure, poor service organization and irregular outreach. A 2024 scoping review of routine immunization in Nigeria identified logistical problems, socioeconomic barriers, cultural influences and systemic health-care deficiencies as recurring explanations for poor immunization uptake, with important regional variations [25]. Proximity to services had also been important. Mahachi et al. [1] found that access to vaccination—including proximity to facilities where vaccines and vaccinators were available—was frequently reported as a determinant of vaccine uptake. Consequently, geographical concentrations of zero-dose children could have indicated not only population characteristics but also weaknesses in the organization and reach of routine immunization services. Contact between mothers and health facilities during pregnancy and childbirth had provided opportunities to establish subsequent links with childhood immunization. Evidence from Nigerian studies had demonstrated associations between antenatal care, facility delivery and childhood vaccination [26,27]. The studies found substantially greater odds of basic vaccination among children whose mothers had attended at least four antenatal-care visits compared with those whose mothers had received no antenatal care. This relationship had reinforced the broader interpretation of zero-dose status as an indicator of health-system exclusion. Children who had not received vaccination might have belonged to households that had also experienced inadequate contact with antenatal, delivery, postnatal and other primary health-care services.
Earlier Nigerian research on measles vaccination similarly demonstrated that national or first-level administrative estimates could mask significant geographical inequities at more granular levels. Geospatial analysis identified persistent areas of low coverage that required improved routine immunization performance [17]. These findings had important implications for hotspot analysis. A hotspot could be conceptualized as an area containing unusually high prevalence or a disproportionately large number of zero-dose children. Ranking wards by absolute burden, prevalence and cumulative contribution could therefore provide a practical alternative or complement to formal spatial modelling where precise household coordinates were unavailable. The literature suggested that programme decisions should distinguish between the rate of zero-dose status and the number of zero-dose children. Prevalence described the relative level of deprivation within a geographical population, while absolute burden quantified the number of children requiring intervention. Both measures had different operational implications. High prevalence indicated severe inequity within an area, whereas a high absolute number indicated potentially greater programme impact if those children could be reached. Therefore, areas could reasonably be prioritized using both measures. Cumulative concentration analysis had provided an additional perspective by determining whether a relatively small number of geographical units accounted for a large proportion of the total burden. Where such concentration existed, prioritizing the highest-burden wards could potentially reach a substantial proportion of all zero-dose children with focused resources. The fine-scale findings of Utazi et al. [8], which identified particular wards and health-facility catchment areas with greater numbers of unvaccinated children, supported the programmatic relevance of this approach.
The global policy environment had increasingly emphasized equity rather than vaccination coverage alone. The Immunization Agenda 2030 established a global strategy to ensure that vaccination benefits reached populations that had historically been missed. Reduction of zero-dose children became an important measure of progress because such children represented populations outside routine immunization systems. Scientific reviews of the Immunization Agenda’s zero-dose strategy emphasized the need for intensified action to achieve the target of substantially reducing the number of children unreached by routine vaccination by 2030. The literature had increasingly focused on identifying who zero-dose children were, where they lived and which interventions could effectively reach them. This policy orientation had strengthened the relevance of disaggregated subnational data. National coverage improvement alone could not demonstrate whether historically underserved populations had benefited. LGA-, ward- and community-level monitoring had therefore been important for assessing whether immunization programmes were becoming more equitable.
Empirical studies conducted in Nigeria had consistently demonstrated that zero-dose children represented a substantial but unevenly distributed population [28]. A scoping review of publications on zero- and missed-dose children in Nigeria substantially supported these findings [29]. The most frequently reported determinants included maternal factors, community characteristics, access to vaccination services and immunization awareness. The review also identified an important evidence gap: much of the intervention literature had concentrated on vaccination campaigns and polio eradication, while evidence concerning sustainable routine immunization approaches remained comparatively limited [30]. Mak et al. [31] combined a systematic review with analysis of the 2018 Nigeria DHS. Among 6,059 children aged 12–23 months, basic vaccination coverage was estimated at 31%, while 19% had received none of the basic vaccines. Vaccination inequalities were associated with household wealth, maternal education, antenatal care, birth setting, geographical region and place of residence. Aheto et al. [14] investigated changes in zero-dose prevalence and geographical distribution using Nigerian household surveys conducted in 2018 and 2021. Their geospatial analysis demonstrated persistent geographical inequalities and showed that the distribution of zero-dose children could vary substantially within the country. Utazi et al. [8] examined vaccination coverage and zero-dose prevalence at district, ward and health-facility levels in 13 Nigerian states. Although the measles vaccination campaign reduced zero-dose numbers, substantial pockets remained, and the study identified specific wards and health-facility catchments with comparatively large unvaccinated populations. Collectively, these studies demonstrated three important patterns. First, Nigeria had continued to experience a substantial zero-dose burden. Second, zero-dose status had been associated with socioeconomic, maternal, geographical and health-system inequalities. Third, the burden had been spatially heterogeneous, making subnational analysis essential for identifying populations requiring intervention. The present study was based on a simple geographical and programme-oriented conceptual framework in which the target population represented children expected to receive routine immunization, while Penta1 uptake represented initial contact with the routine immunization system. Children remaining without Penta1 were considered the zero-dose population for operational analysis. The framework followed the pathway: Target population → Penta1 vaccination → Remaining zero-dose children → Ward-level prevalence and burden → LGA-level aggregation → Identification of high-burden geographical areas → Targeted routine immunization interventions. The framework recognized two complementary dimensions of zero-dose burden: prevalence, which measured the proportion of the target population remaining zero-dose, and absolute burden, which represented the number of zero-dose children. These measures were examined at ward and LGA levels to determine both the intensity and concentration of the problem. Despite the substantial literature on childhood immunization in Nigeria, several gaps had remained relevant to the present study. Much of the existing literature had focused on national or regional vaccination coverage, individual-level determinants or large household surveys. Although sophisticated geospatial studies had demonstrated substantial subnational heterogeneity, fewer operational studies had used routinely available programme data to simultaneously compare absolute zero-dose burden and prevalence at both LGA and ward levels. Furthermore, previous studies had frequently concentrated on determinants of vaccination or national geographical patterns rather than the practical ranking of wards according to their contribution to the overall zero-dose burden. Yet programme managers required information that could directly identify which administrative units contained the largest numbers and proportions of unreached children. The literature had also indicated that coarse geographical estimates could mask important heterogeneity. This created a need for analyses conducted at administrative levels sufficiently granular to support microplanning. In addition, the evidence base had remained comparatively limited for geographically difficult riverine environments, where transportation and settlement patterns could create distinctive challenges for routine immunization. There was therefore a need for context-specific analysis capable of identifying geographical pockets of zero-dose children in such settings. The present study addressed these gaps by analysing the prevalence, absolute burden and distribution of zero-dose children across LGAs and wards, ranking geographical units, classifying ward-level prevalence and examining the cumulative concentration of the burden. This approach provided an operational bridge between epidemiological measurement and routine immunization programme planning.
2. Methods and Materials
2.1 Study Area
The study was conducted in Bayelsa State, Nigeria, one of the states in the Niger Delta region of southern Nigeria. Bayelsa State is characterized by extensive riverine terrain, creeks, wetlands and dispersed settlements, with several communities accessible predominantly by waterways. These geographical characteristics have important implications for the organization and delivery of primary health-care services, particularly routine immunization, outreach and other maternal and child health interventions. Administratively, Bayelsa State consists of eight Local Government Areas (LGAs): Brass, Ekeremor, Kolokuma/Opokuma, Nembe, Ogbia, Sagbama, Southern Ijaw and Yenagoa. The dataset used for the study contained 105 wards distributed across these eight LGAs. The wards constituted the principal sub-LGA geographical units used for assessing variations in the distribution of zero-dose children. Routine childhood immunization services in the state were delivered through primary health-care facilities and complementary outreach and mobile vaccination strategies. The riverine nature of several parts of the state, dispersed settlements, transportation requirements and varying accessibility of communities made disaggregated analysis particularly important for identifying geographical areas where children might remain unreached by routine immunization services. The study area was considered appropriate because analysis at the state or LGA aggregate level alone could conceal substantial differences between wards. Assessing the zero-dose burden at both LGA and ward levels therefore provided an opportunity to identify geographical disparities and priority areas requiring intensified routine immunization interventions.
2.2 Study Population
The study population comprised children within the routine immunization target population across the eight LGAs and 105 wards of Bayelsa State represented in the available administrative dataset. For the purpose of the study, particular attention was given to zero-dose children, operationally defined as children who had not received the first dose of a diphtheria-tetanus-pertussis-containing vaccine (DTP1). Within the Nigerian routine immunization schedule and the available dataset, receipt of the first dose of pentavalent vaccine (Penta1) was used as the operational indicator of initial contact with routine immunization services. The analytical population was therefore derived from the estimated target populations and corresponding Penta1 vaccination records available for each ward. The dataset contained information on the 2025 target population, children immunized with Penta1 during 2025, subsequent Penta1 vaccination records available for 2026 and the estimated remaining zero-dose population as updated. At the aggregate level, the dataset represented a target population of approximately 88,363 children across 105 wards. The study population was analysed geographically by ward and subsequently aggregated to LGA level to determine the magnitude, prevalence and distribution of zero-dose children.
2.3 Study Design
The study adopted a retrospective cross-sectional descriptive study design involving secondary analysis of routine immunization data. The design was considered appropriate because the study sought to determine the prevalence and geographical distribution of zero-dose children using existing administrative immunization records rather than collecting primary information directly from individual children or caregivers. The retrospective component involved the use of previously generated routine immunization and target-population records, including 2025 Penta1 vaccination data and subsequent information used to update the estimated zero-dose population. The cross-sectional component involved assessing the remaining zero-dose burden at a defined reference period. The study was primarily descriptive and ecological because the units of analysis were geographical administrative areas rather than individual children. Analyses were undertaken at both LGA and ward levels. The number and prevalence of zero-dose children were estimated for each geographical unit, and comparisons were made to identify variations in burden. The design also incorporated a distributional approach in which LGAs and wards were ranked according to zero-dose burden and prevalence. Wards were further classified into prevalence categories, while cumulative analysis was used to determine the extent to which the overall zero-dose burden was concentrated within a relatively small number of high-burden wards. The study design was therefore suitable for generating evidence for routine immunization programme planning, geographical prioritization, resource allocation and identification of locations requiring more intensive investigation or intervention. However, because the analysis was based on aggregate secondary data, the design was not intended to establish individual-level causal determinants of zero-dose status.
2.4 Sampling Technique
A total population (census) sampling approach was used for the study. Rather than selecting a sample of LGAs or wards, all geographical units contained in the available dataset that met the requirements for analysis were included. Accordingly, all eight LGAs and all 105 wards represented in the routine immunization dataset were included in the analysis. The eight LGAs comprised Brass, Ekeremor, Kolokuma/Opokuma, Nembe, Ogbia, Sagbama, Southern Ijaw and Yenagoa. Each ward constituted an observation for the ward-level analysis, while ward-level values were aggregated within their respective LGAs for the LGA-level analysis. The census approach was considered appropriate because the primary objective of the study was to describe the complete geographical distribution of zero-dose children rather than estimate the burden from a subset of geographical areas. Sampling only selected wards could have excluded important zero-dose hotspots and reduced the ability of the study to demonstrate geographical inequalities across the state. Consequently, no probabilistic sampling procedure and no conventional sample-size calculation were required, since the analysis included the entire set of eligible administrative units available in the dataset. Inclusion of all LGAs and wards also permitted direct ranking and comparison of geographical areas according to zero-dose prevalence, absolute burden and contribution to the overall zero-dose population. The sampling units were therefore the 105 wards, nested within the eight LGAs, while the underlying population consisted of children represented in the routine immunization target population. This approach provided comprehensive geographical coverage and was consistent with the study's objective of identifying high-burden LGAs and ward-level zero-dose hotspots for targeted routine immunization interventions.
2.5 Selection Criteria
Inclusion Criteria
The study included all LGA- and ward-level records contained in the routine immunization dataset that met the requirements for assessing the prevalence and distribution of zero-dose children. Specifically, records were included where:
- The ward belonged to one of the eight Local Government Areas of Bayelsa State.
- The ward had an identifiable LGA and ward name that permitted geographical classification.
- Information on the target population was available.
- Information on the number of children who had received Penta1 was available, thereby permitting estimation of the zero-dose burden.
- The record contained sufficient information to determine or update the estimated number of zero-dose children.
- The geographical unit could be linked consistently to its corresponding LGA for ward- and LGA-level aggregation.
All 105 eligible wards across the eight LGAs that satisfied these criteria were included in the analysis.
Exclusion Criteria
- Records were excluded from the analysis where the geographical unit could not be identified or assigned to a specific LGA or ward. Records with completely missing target-population or Penta1 vaccination information that prevented estimation of zero-dose prevalence were also considered ineligible.
- Duplicate records representing the same LGA, ward and reporting period were excluded where identified to avoid double counting. Records that could not be reconciled with the study's defined reference period or did not provide sufficient information for calculating or determining zero-dose status were similarly excluded.
- Where vaccination counts exceeded the estimated target population, resulting in a negative calculated zero-dose residual, the record was not automatically excluded, because doing so could have systematically removed wards with potential denominator or reporting problems. Instead, such observations were retained as data-quality flags, while negative zero-dose values were treated as zero for prevalence and distributional calculations because a negative number of zero-dose children was epidemiologically implausible.
2.6 Method of Data Collection
The study used secondary administrative routine immunization data; consequently, no direct interviews, questionnaires or observations involving caregivers or individual children were undertaken for the present analysis. Data were obtained from existing routine immunization records covering the eight LGAs and 105 wards of Bayelsa State. The extracted variables included the LGA, ward, estimated target population, number of children immunized with Penta1 in 2025, estimated zero-dose population, subsequent Penta1 vaccination records available for 2026, and the remaining zero-dose population updated. The data were extracted into a structured electronic database and organized by LGA and ward. Each ward constituted the basic geographical unit of analysis. Ward-level records were subsequently aggregated within their respective LGAs to generate LGA-level estimates. Data cleaning was undertaken before analysis. The process involved checking LGA and ward names, identifying duplicate records, assessing missing values, checking numerical variables for inconsistencies and examining the relationship between the estimated target population and reported Penta1 vaccination counts. Particular attention was given to observations in which the number of vaccinated children exceeded the estimated target population.
Zero-dose prevalence was calculated as:
Zero-dose prevalence (%) = Number of zero-dose children/Target population x 100
The updated zero-dose estimate was used as the principal outcome for the final prevalence and distributional analyses. The cleaned data were subsequently summarized using frequencies, proportions, rankings and graphical presentations at LGA and ward levels.
2.7 Reliability and Validity Test
Reliability Test
Because the study was based on secondary aggregate administrative data rather than a multi-item questionnaire or psychometric scale, conventional internal-consistency reliability measures such as Cronbach's alpha were not applicable. Cronbach's alpha would have assessed the consistency among multiple questionnaire items intended to measure the same latent construct, whereas the variables in this study represented administrative counts and geographical identifiers. Reliability was therefore assessed primarily through data consistency and reproducibility checks. The extracted records were reviewed for consistency between the target population, reported Penta1 vaccination counts and calculated zero-dose values. Ward-level data were aggregated independently by LGA and compared with calculated LGA totals to ensure that the results could be reproduced from the underlying ward records. Arithmetic consistency was also assessed by verifying the relationship between the estimated target population, Penta1 vaccination counts and the resulting zero-dose estimates. Records with unusual values, particularly those producing negative zero-dose residuals, were flagged and retained for data-quality assessment rather than being interpreted as true negative counts. The analytical procedures were applied consistently to all 105 wards using the same operational definition, denominator and reference period. These procedures enhanced the reproducibility and internal consistency of the secondary-data analysis.
2.7 Validity Test
Validity was assessed in relation to whether the variables and analytical procedures appropriately represented the study concept of zero-dose prevalence and geographical distribution.
Content validity was established by ensuring that the dataset contained the principal variables required to address the study objectives, including LGA, ward, target population, Penta1 vaccination counts and estimated zero-dose children. These variables permitted assessment of both the absolute burden and prevalence of zero-dose children at LGA and ward levels.
Construct validity was supported through the operational definition of zero-dose status using non-receipt of the first dose of a diphtheria-tetanus-pertussis-containing vaccine. Within the available routine immunization data, Penta1 served as the corresponding indicator. This definition was consistent with the internationally recognized approach used by the World Health Organization and Immunization Agenda 2030 for identifying children who had not received an initial DTP-containing vaccine.
Criterion-related validity was addressed, to the extent permitted by the secondary dataset, by checking the derived zero-dose estimates against the underlying target-population and Penta1 vaccination records from which the estimates were generated. Ward-level values were also aggregated and examined at LGA level to determine whether the geographical summaries were mathematically consistent with the source records.
Face validity was further supported by reviewing whether the variables, calculations, classifications, tables and graphical presentations logically reflected the stated objectives of determining zero-dose prevalence and identifying geographical differences across LGAs and wards.
Formal psychometric procedures such as the Kaiser-Meyer-Olkin (KMO) measure, Bartlett's test of sphericity and exploratory factor analysis were not conducted, because these tests were designed primarily for assessing relationships among multiple questionnaire items or latent constructs and were not appropriate for the aggregate administrative variables used in this study. Overall, validity and reliability were strengthened through the use of a standardized operational definition of zero-dose status, inclusion of all eligible LGAs and wards, systematic data cleaning, consistency checking, transparent handling of implausible values and application of uniform analytical procedures across the entire dataset.
2.8 Data Management and Analysis
The data were entered, cleaned, coded and analysed using Microsoft Excel. Data cleaning involved checking for missing values, duplicate records, inconsistent ward and LGA classifications, and implausible values. Records in which vaccination counts exceeded the estimated target population were flagged for data-quality assessment, while negative zero-dose residuals were treated as zero for prevalence calculations. Descriptive statistics, including frequencies, percentages, proportions and rankings, were used to summarize the data. Zero-dose prevalence was calculated by dividing the number of zero-dose children by the corresponding target population and multiplying by 100. Ward-level data were aggregated to obtain LGA-level estimates. LGAs and wards were compared according to their zero-dose prevalence, absolute number of zero-dose children and proportional contribution to the overall burden. Wards were further categorized according to prevalence levels and ranked to identify high-burden hotspots. Cumulative burden analysis was used to assess the concentration of zero-dose children across wards. Findings were presented using frequency tables, bar charts and cumulative distribution figures, with the zero-dose estimates serving as the principal reference for the analysis.
2.9 Ethical Considerations
Ethical approval for the study was obtained from the Bayelsa State Primary Health Care Board Ethical Committee, with approval reference number PHCB/AD/171/Vol.1/p.58. The study was conducted in accordance with established ethical principles for health research. The study involved secondary analysis of aggregated routine immunization data and did not require direct interaction with children, caregivers or other human participants. No personally identifiable information was included in the dataset used for the analysis. Confidentiality and privacy were maintained throughout data management and analysis, and the data were used solely for the stated research purposes. Findings were reported at ward and LGA levels to minimize the possibility of identifying individual children or households.
2.10 Timeline of the Study
The study was conducted over a seven-month period from February to August 2026. The activities were implemented sequentially from research planning through dissemination of the findings.
Research planning and proposal development -February 2026: The research topic was conceptualized, the study objectives and methodology were developed, and the research proposal was prepared.
Institutional consent and ethical clearance -March 2026: Institutional permission and ethical approval were obtained from the Bayelsa State Primary Health Care Board Ethical Committee with reference number PHCB/AD/171/Vol.1/p.58.
Data collection preparedness -April 2026: Preparatory activities were undertaken, including identification of relevant data sources, development of the data extraction framework, and arrangements for data collection and management.
Data collection -May-June 2026: Relevant LGA- and ward-level routine immunization and zero-dose data were collected, compiled, verified and prepared for analysis.
Report writing and dissemination July-August 2026: The data were analysed and interpreted, the research report was prepared, and the findings were organized for presentation and dissemination to relevant stakeholders and the scientific community.
Thus, the study progressed systematically from proposal development in February 2026 through ethical approval, data preparation and collection, analysis, report writing and dissemination, which were completed in August 2026.
3. Results
As presented in Table 1, a total of 19,498 zero-dose children were identified from a target population of 88,363 children across the eight LGAs, giving an overall zero-dose prevalence of 22.1%. The distribution, however, varied considerably across the LGAs, indicating substantial geographical disparities in zero-dose prevalence and burden. Table 1 further showed that Southern Ijaw had the highest zero-dose burden, recording 8,817 zero-dose children from a target population of 16,570, with a prevalence of 53.2%. Southern Ijaw alone accounted for 45.2% of the total zero-dose burden. Yenagoa followed with 5,305 zero-dose children, representing a prevalence of 28.9% and 27.2% of the total burden. Together, Southern Ijaw and Yenagoa accounted for 72.4% of all zero-dose children, demonstrating that the burden was disproportionately concentrated in these two LGAs. Brass recorded 2,152 zero-dose children, corresponding to a prevalence of 22.4% and 11.0% of the total burden. This was followed by Ogbia with 1,283 zero-dose children and a prevalence of 13.7%, and Sagbama with 1,085 children and a prevalence of 11.2%. Conversely, relatively low prevalence was observed in Kolokuma Opokuma (6.2%), Nembe (4.9%) and Ekeremor (1.9%). The findings in Table 1 therefore demonstrated marked inter-LGA inequalities in the prevalence and distribution of zero-dose children.
|
LGA |
No. of Wards |
Target population |
zero-dose children |
Prevalence (%) |
Share of zero-dose burden (%) |
|
Southern Ijaw |
17 |
16,570 |
8,817 |
53.2% |
45.2% |
|
Yenagoa |
15 |
18,330 |
5,305 |
28.9% |
27.2% |
|
Brass |
10 |
9,600 |
2,152 |
22.4% |
11.0% |
|
Ogbia |
13 |
9,334 |
1,283 |
13.7% |
6.6% |
|
Sagbama |
14 |
9,708 |
1,085 |
11.2% |
5.6% |
|
Kolokuma/Opokuma |
11 |
4,010 |
249 |
6.2% |
1.3% |
|
Nembe |
13 |
6,792 |
335 |
4.9% |
1.7% |
|
Ekeremor |
12 |
14,020 |
273 |
1.9% |
1.4% |
|
TOTAL |
105 |
88,363 |
19,498 |
22.1% |
100.0% |
Table 1: LGA-level prevalence and distribution of zero-dose children.
|
LGA |
Ward |
Target population |
Zero dose children |
Ward prevalence (%) |
Cumulative share of total burden (%) |
|
Southern Ijaw |
OPUAMA |
2,272 |
1,317 |
58.0% |
8.8% |
|
Southern Ijaw |
OPOROMA 2 |
1,723 |
1,185 |
68.8% |
12.8% |
|
Yenagoa |
ATISSA 1 |
2,992 |
1,107 |
37.0% |
18.5% |
|
Yenagoa |
EPIE 3 |
3,866 |
863 |
22.3% |
22.9% |
|
Southern Ijaw |
OPOROMA 1 |
1,478 |
817 |
55.3% |
27.1% |
|
Southern Ijaw |
AMASSOMA 2 |
1,317 |
768 |
58.3% |
31.1% |
|
Southern Ijaw |
OTUAN |
915 |
603 |
65.9% |
34.1% |
|
Southern Ijaw |
OLODIAMA 1 |
1,104 |
594 |
53.8% |
37.2% |
|
Yenagoa |
OKORDIA |
781 |
572 |
73.3% |
40.1% |
|
Southern Ijaw |
APOI |
994 |
568 |
57.1% |
43.0% |
|
Southern Ijaw |
PEREMABIRI |
980 |
565 |
57.7% |
45.9% |
|
Southern Ijaw |
AMASSOMA 3 |
953 |
542 |
56.9% |
48.7% |
|
Yenagoa |
ZARAMA |
613 |
509 |
83.0% |
51.3% |
|
Brass |
OKPOAMA |
1,275 |
506 |
39.7% |
53.9% |
|
Brass |
OGINIBIRI |
1,051 |
411 |
39.1% |
56.0% |
|
Yenagoa |
EKPETIAMA 1 |
530 |
410 |
77.4% |
58.1% |
|
Sagbama |
OFONI 1 |
794 |
394 |
49.6% |
60.2% |
|
Brass |
CAPE FORMOSA |
1,155 |
380 |
32.9% |
62.1% |
|
Southern Ijaw |
IGBOMATORU |
810 |
364 |
44.9% |
64.0% |
|
Southern Ijaw |
ENEWARI |
616 |
363 |
59.0% |
65.8% |
Table 2: Top 20 ward-level zero-dose hotspots.
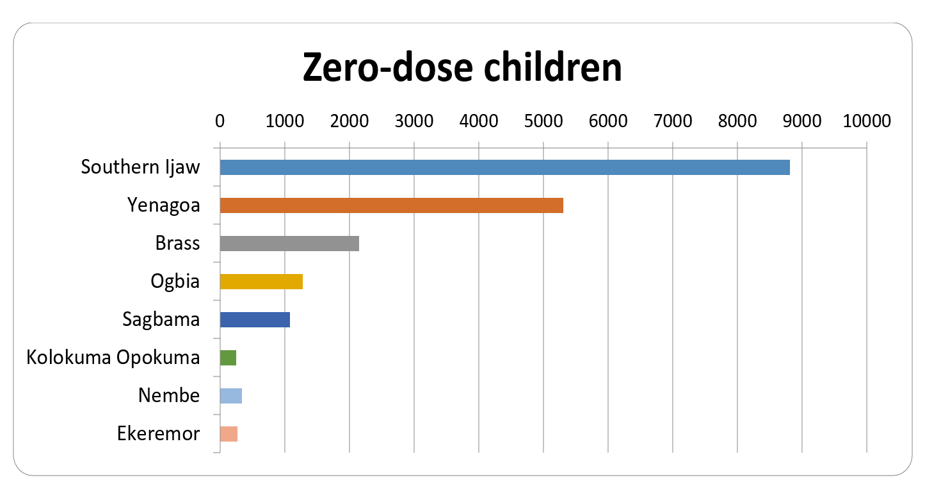
Figure 1: Zero-dose children by LGA.
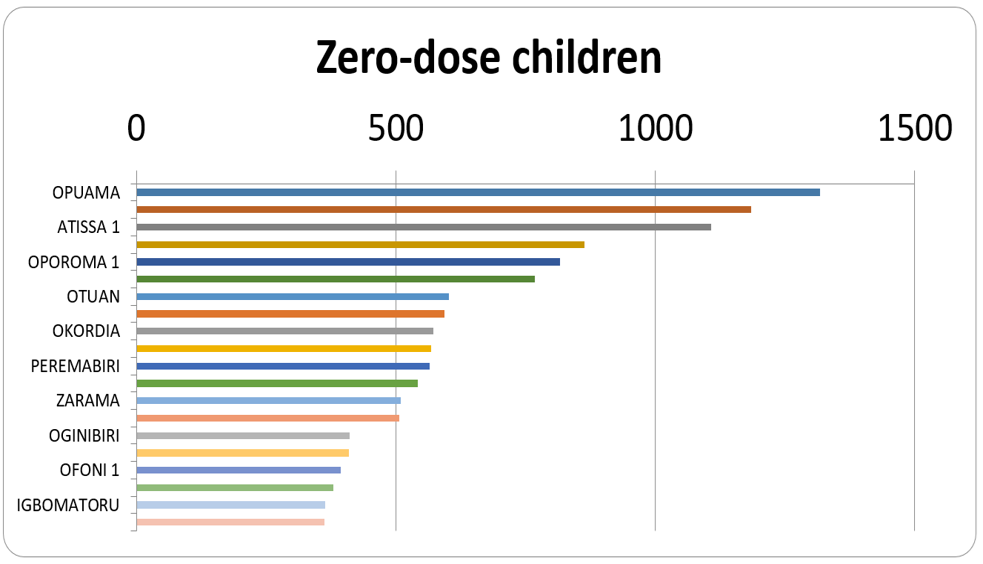
Figure 2: Top 20 ward-level zero-dose hotspots.
The ward-level distribution presented in Table 2 revealed further geographical clustering of zero-dose children. Opuama Ward in Southern Ijaw ranked first, with 1,317 zero-dose children and a prevalence of 58.0%. Oporoma 2, also in Southern Ijaw, ranked second with 1,185 zero-dose children and a prevalence of 68.8%, while Atissa 1 in Yenagoa ranked third with 1,107 zero-dose children and a prevalence of 37.0%. Epie 3 and Oporoma 1 followed with 863 and 817 zero-dose children, respectively. Although Table 2 ranked wards primarily according to their absolute zero-dose burden, the prevalence figures revealed a different dimension of inequality. Zarama in Yenagoa recorded the highest prevalence among the listed hotspots at 83.0%, followed by Ekpetiama 1 at 77.4% and Okordia at 73.3%. Otuan in Southern Ijaw also recorded a notably high prevalence of 65.9%. These findings showed that wards with the greatest absolute numbers of zero-dose children were not necessarily those with the highest prevalence. Therefore, both absolute burden and prevalence would be important for identifying priority wards for intervention. Another important finding from Table 2 was the cumulative concentration of the zero-dose burden. The first three hotspot wards accounted for 18.5% of the total burden, while the first 10 wards accounted for 43.0%. By the twentieth-ranked ward, the cumulative proportion had increased to 65.8%. Thus, approximately two-thirds of all zero-dose children were concentrated within only 20 of the 105 wards, demonstrating substantial ward-level clustering.
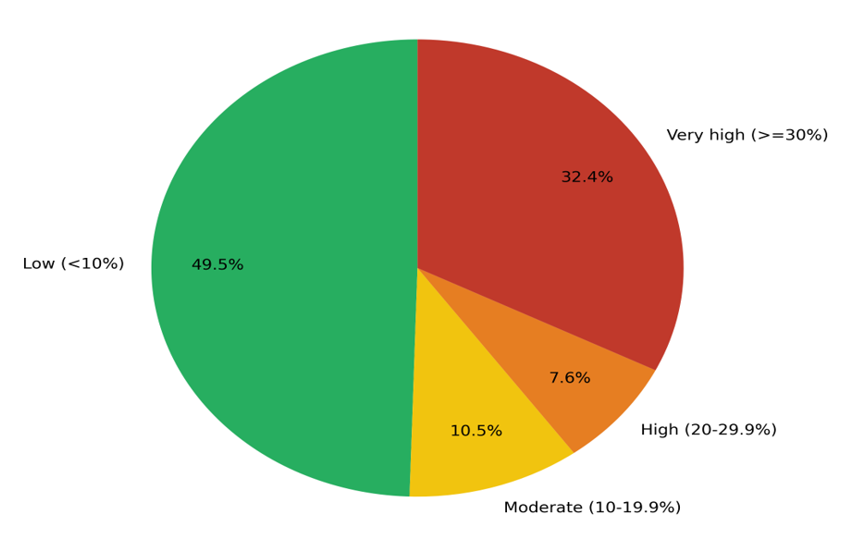
Figure 3: Distribution of 105 wards by zero-dose prevalence category.
The pattern presented in Table 1 was further illustrated in Figure 1. As shown in Figure 1, Southern Ijaw had by far the largest absolute number of zero-dose children, with 8,817 cases, followed by Yenagoa with 5,305 and Brass with 2,152. Ogbia and Sagbama recorded 1,283 and 1,085 zero-dose children, respectively, while considerably smaller numbers were recorded in Nembe (335), Ekeremor (273) and Kolokuma Opokuma (249). The pronounced differences displayed in Figure 1 confirmed that the zero-dose burden was not uniformly distributed across the eight LGAs. Rather, the burden was strongly concentrated in Southern Ijaw and Yenagoa, with a sharp decline in the absolute number of zero-dose children across the remaining LGAs. This pattern highlighted the importance of examining sub-state geographical variation rather than relying solely on the overall prevalence.
As illustrated in Figure 2, Opuama, Oporoma 2 and Atissa 1 constituted the three largest ward-level hotspots, recording 1,317, 1,185 and 1,107 zero-dose children, respectively. They were followed by Epie 3 with 863, Oporoma 1 with 817 and Amassoma 2 with 768 zero-dose children. Figure 2 also demonstrated the strong representation of Southern Ijaw among the leading hotspots. Several wards from Southern Ijaw—including Opuama, Oporoma 2, Oporoma 1, Amassoma 2, Otuan, Olodiama 1, Apoi, Peremabiri, Amassoma 3, Igbomatoru and Enewari—appeared among the top 20 hotspots. This pattern indicated that the high burden observed for Southern Ijaw in Table 1 and Figure 1 was distributed across several wards rather than being driven by a single ward.
As shown in Figure 3, the 105 wards demonstrated considerable variation in zero-dose prevalence. Almost half (49.5%) of the wards were classified as having low zero-dose prevalence of less than 10%. In contrast, 32.4% of the wards were classified as having very high prevalence of 30% or more. A further 7.6% had high prevalence ranging from 20.0% to 29.9%, while 10.5% had moderate prevalence ranging from 10.0% to 19.9%. The distribution shown in Figure 3 indicated that although approximately half of the wards had relatively low zero-dose prevalence, a substantial proportion remained severely affected. When the high and very-high categories were combined, 40.0% of the 105 wards had a zero-dose prevalence of at least 20%. This demonstrated a polarized pattern in which many wards had relatively low prevalence while a sizeable group of wards experienced a disproportionately high zero-dose burden.
4. Discussion
The study examined the prevalence and geographical distribution of zero-dose children at LGA and ward levels and revealed pronounced inequalities in the burden across the study area. Overall, 19,498 zero-dose children were identified from a target population of 88,363, representing a prevalence of 22.1% (Table 1). However, the overall prevalence concealed substantial geographical variation, as the burden was disproportionately concentrated in a relatively small number of LGAs and wards. This pattern was consistent with previous evidence from Nigeria study showing that childhood immunization coverage and zero-dose prevalence had varied substantially across geographical areas and that national or state-level averages could conceal important subnational inequalities. As shown in Table 1 and Figure 1, Southern Ijaw emerged as the LGA with the greatest zero-dose burden, recording 8,817 zero-dose children and a prevalence of 53.2%. The LGA accounted for 45.2% of all zero-dose children identified in the study. Yenagoa followed with 5,305 zero-dose children, a prevalence of 28.9%, and 27.2% of the total burden. Together, the two LGAs accounted for 72.4% of the total zero-dose burden. The magnitude of these differences suggested that geographical location had remained an important dimension of immunization inequality. Geospatial analyses by Utazi and colleagues [8] demonstrated substantial spatial heterogeneity in zero-dose prevalence and emphasized that geographically precise estimates were valuable for identifying missed communities and targeting immunization resources. The exceptionally high prevalence observed in Southern Ijaw was particularly important within the context of the study area. While the present descriptive analysis did not measure the determinants responsible for the observed pattern, the concentration was compatible with previous Nigerian literature demonstrating that geographical location, community characteristics and physical access to vaccination services had influenced children's likelihood of receiving routine immunization. In a scoping review of evidence from Nigeria, reported that community heterogeneity—including location, region and population characteristics—and proximity to facilities with vaccines and vaccinators were among the most frequently reported factors influencing childhood vaccination [4,28]. Therefore, the high burden observed in Southern Ijaw warranted further investigation of local service-delivery and accessibility factors rather than assuming that the observed association was caused by any single geographical characteristic. Conversely, Table 1 showed considerably lower prevalence in Ekeremor (1.9%), Nembe (4.9%) and Kolokuma Opokuma (6.2%). The contrast between these LGAs and Southern Ijaw demonstrated that even within the same broader administrative and health-system context, immunization outcomes had differed markedly. This finding agreed with recent national evidence demonstrating significant subnational inequalities in zero-dose prevalence across Nigeria. Umar et al. [15], for example, reported statistically significant geographical differences in zero-dose prevalence and concluded that improvements in routine immunization had not been distributed equitably across the country.
The ward-level findings provided an even clearer picture of geographical concentration. As presented in Table 2 and Figure 2, Opuama recorded the largest absolute number of zero-dose children (1,317), followed by Oporoma 2 (1,185) and Atissa 1 (1,107). Importantly, several Southern Ijaw wards appeared among the 20 leading hotspots, including Opuama, Oporoma 2, Oporoma 1, Amassoma 2, Otuan, Olodiama 1, Apoi, Peremabiri, Amassoma 3, Igbomatoru and Enewari. This finding suggested that the high LGA-level burden observed in Southern Ijaw had not resulted from one isolated ward but reflected a wider pattern of clustering across several wards. This ward-level clustering was consistent with previous geospatial research in Nigeria. Studies that generated high-resolution estimates of zero-dose prevalence found considerable variation within broader geographical areas and demonstrated that aggregation at national, regional or state levels could obscure localized pockets of unvaccinated children [7,32]. Such evidence reinforced the importance of the ward as an operational unit for immunization planning because analyses conducted only at higher administrative levels could fail to identify communities where large numbers of children remained unreached.
Another important finding was the distinction between absolute zero-dose burden and zero-dose prevalence. Although Opuama had the largest number of zero-dose children, Table 2 showed that Zarama had the highest prevalence among the top 20 hotspots at 83.0%, followed by Ekpetiama 1 at 77.4%, Okordia at 73.3% and Oporoma 2 at 68.8%. This finding demonstrated that ranking wards solely by the absolute number of zero-dose children would have produced a different prioritization from ranking them by prevalence. Wards with larger child populations could contribute large absolute numbers even when their prevalence was comparatively lower, whereas smaller wards could experience severe immunization exclusion despite contributing fewer children to the overall burden. The distinction had important implications for equity-oriented immunization programming. Previous research had emphasized that geographically precise estimates of both vaccination coverage and zero-dose prevalence provided a useful evidence base for identifying missed communities and allocating resources more effectively. Accordingly, the present findings suggested that prioritization based solely on numbers could overlook communities experiencing the greatest proportional disadvantage, while prioritization based solely on prevalence could overlook areas contributing the largest absolute numbers of unvaccinated children. A combined assessment of absolute burden and prevalence would therefore have provided a more balanced basis for microplanning. A particularly striking finding was the concentration of the total burden within a relatively small number of wards. As presented in Table 2, the first 10 hotspot wards accounted cumulatively for 43.0% of all zero-dose children, while the top 20 accounted for 65.8% of the total burden. Considering that the study included 105 wards, this indicated that approximately two-thirds of the burden had been concentrated in fewer than one-fifth of the wards. This concentration supported the concept of “missed communities,” in which zero-dose children tended to cluster geographically rather than being randomly distributed across populations. Previous Nigerian geospatial studies similarly demonstrated that identifying such localized clusters could facilitate more efficient targeting of vaccination strategies.
The distribution presented in Figure 3 further demonstrated the heterogeneous nature of zero-dose prevalence across the 105 wards. Nearly half of the wards (49.5%) had prevalence below 10%, whereas 10.5% had moderate prevalence of 10–19.9%, 7.6% had high prevalence of 20–29.9%, and 32.4% had very high prevalence of at least 30%. Thus, 40.0% of all wards had zero-dose prevalence of 20% or greater. This pattern suggested that the study area had experienced a form of geographical polarization: many wards had relatively low prevalence, while a substantial group had experienced very high levels of immunization exclusion. The observed heterogeneity was consistent with broader evidence on vaccine inequity in Nigeria. Analyses of national household survey data had demonstrated that vaccination inequalities were multidimensional and were associated with geographical location as well as socioeconomic and maternal characteristics. For example, a Nigerian vaccine-equity analysis found that maternal education and socioeconomic disadvantage contributed substantially to inequalities in zero-dose and other vaccination outcomes [21-23]. Similarly, studies identified maternal education, access to antenatal and perinatal care, community characteristics, proximity to vaccination services and immunization awareness among recurrent factors associated with zero- and missed-dose status in Nigeria [1,26,27]. These studies provided plausible contextual explanations for geographical disparities but did not establish the causes of the specific LGA and ward patterns observed in the present study. The findings also had implications for immunization equity. Zero-dose status had been recognized as an indicator not merely of failure to receive vaccination but also of broader disadvantage and inadequate contact with essential health services. The studies observed that zero- and missed-dose children were frequently found among populations already disadvantaged by poverty and poor access to basic services. Similarly, analyses across low- and middle-income countries showed systematic differences in zero-dose prevalence according to household wealth and place of residence [24]. Consequently, the clustering identified in Tables 1 and 2 and Figures 1–3 could have reflected broader inequalities in children's opportunities to access routine health services, although the present study had not directly measured those pathways. From a programmatic perspective, the findings supported a shift from uniformly distributed interventions toward geographically differentiated and micro-targeted approaches. Southern Ijaw required particular attention because Table 1 and Figure 1 showed that it contributed almost half of the overall burden, while Table 2 and Figure 2 demonstrated that several of its wards were among the largest hotspots. Yenagoa also required targeted attention because, although its LGA-level prevalence was lower than Southern Ijaw's, several Yenagoa wards—including Zarama, Ekpetiama 1 and Okordia—recorded exceptionally high prevalence. Such variation demonstrated why LGA-level estimates alone had been insufficient for operational planning. The findings were therefore consistent with the broader argument that subnational and high-resolution data were necessary for immunization equity. Geospatial research in Nigeria had demonstrated that district-level and finer-scale estimates could identify populations missed by routine vaccination strategies and could support more targeted allocation of resources [8,33]. The present ward-level analysis extended this principle within the study setting by demonstrating that a limited number of wards contributed a disproportionately large share of the zero-dose burden. Nevertheless, the findings had to be interpreted within the descriptive nature of the study. Tables 1–2 and Figures 1–3 established where zero-dose children were concentrated, but they did not establish why those children had remained unvaccinated. The study therefore could not attribute the observed geographical differences directly to distance, riverine accessibility, maternal education, household poverty, vaccine availability, health-worker shortages, caregiver beliefs or other potential determinants. These factors had been identified in previous Nigerian studies, but their contribution to the present distribution would require individual-, household-, community- and health-system-level data and appropriate multivariable or multilevel analyses.
Overall, the study demonstrated pronounced LGA- and ward-level inequalities in zero-dose prevalence and distribution. The overall prevalence of 22.1% masked considerable geographical heterogeneity, with Southern Ijaw and Yenagoa accounting for 72.4% of the total burden and the top 20 wards accounting for 65.8%. These findings strengthened the evidence that aggregate immunization indicators could conceal localized pockets of severe deprivation. The results therefore underscored the importance of using LGA- and ward-level evidence to identify missed communities, prioritize high-burden locations, guide microplanning and direct further investigation toward the underlying determinants of persistent zero-dose status.
5. Conclusion
The study concluded that zero-dose children remained unevenly distributed across the LGAs and wards, demonstrating important geographical inequalities in access to routine childhood immunization. The data analysis showed that the burden was concentrated in particular LGAs and high-burden wards, indicating that aggregated state-level estimates could conceal substantial variations at lower administrative levels. The findings further demonstrated the importance of considering both zero-dose prevalence and absolute numbers when identifying priority areas, as locations with the highest prevalence did not necessarily contribute the largest number of unreached children. LGA- and ward-level disaggregation therefore provided more actionable evidence for immunization planning. The study underscored the need for geographically targeted routine immunization strategies, including strengthened ward-level microplanning, intensified outreach and mobile vaccination services, improved data quality, and prioritization of high-burden and hard-to-reach areas to reduce zero-dose prevalence and advance equitable immunization coverage.
6. Acknowledgement
The authors gratefully acknowledged the Bayelsa State Primary Health Care Board for granting institutional permission and providing the enabling environment for the conduct of this study. Appreciation was particularly extended to the Ethical Committee of the Bayelsa State Primary Health Care Board for granting ethical clearance for the study with reference number PHCB/AD/171/Vol.1/p.58. The authors also acknowledged the contributions of the Local Government Area and ward-level immunization teams, monitoring and evaluation personnel, health information officers, and other primary health-care workers whose routine immunization reporting and documentation provided the data used for the study. Special appreciation was extended to all personnel who contributed to the collection, compilation, validation, cleaning and management of the LGA- and ward-level data. Their efforts were invaluable in facilitating the assessment of the prevalence and geographical distribution of zero-dose children. Finally, the authors acknowledged all stakeholders involved in routine immunization service delivery across the study area, particularly those working to identify and reach children in underserved, riverine and hard-to-reach communities. Their continued commitment to improving childhood immunization coverage and reducing the burden of zero-dose children was sincerely appreciated.
Authors’ Contributions
The study was undertaken through the complementary contributions of both authors across the different stages of the research process.
Ebiakpor Bainkpo Agbedi conceptualized the study and developed its methodological approach. He participated in the investigation and was responsible for the formal analysis and validation of the study data. He also contributed substantially to the interpretation of the findings and preparation of the original manuscript draft, ensuring that the study objectives, analytical approach, and findings were coherently presented.
Pere-Ere Glory Agbedi contributed to the investigation and was responsible for data curation, including the organization and preparation of the data for analysis. She provided supervision during the research process and contributed to project administration and coordination of study activities. She also contributed to the visualization of the findings through the development and presentation of tables, charts, and figures and participated in writing the original manuscript draft.
Both authors contributed intellectually to the development of the study, reviewed and revised the manuscript for important scholarly content, and approved the final version for submission and publication. Both authors accepted responsibility for the integrity and accuracy of their respective contributions to the work.
No conflict of interest
The authors declared that there was no conflict of interest associated with the conduct, analysis, interpretation, or reporting of this study. The research was entirely self-funded through the authors’ personal savings and did not receive any financial support, grant, sponsorship, or material assistance from government institutions, donor or development partners, private companies, commercial organizations, or other external funding bodies. The absence of external funding ensured that no funding organization or third party influenced the study design, data collection, data analysis, interpretation of the findings, preparation of the manuscript, or decision to submit the study for publication. The authors therefore declared that they had no financial, commercial, professional, or other competing interests that could have influenced the conduct or reporting of the study.
References
- Mahachi K, et al. Zero- or missed-dose children in Nigeria: Contributing factors and interventions to overcome immunization service delivery challenges. Vaccine 40 (2022): 5433-5444.
- IMMUNIZATION AGENDA 2030. 2024.
- Isah AM, et al. Leaving no child behind? Developing zero-dose and under-immunized child archetypes to improve vaccine uptake in Nigeria. Vaccine 84 (2026): 128678.
- Oweibia M, et al. Maternal and Child Health Trends in Nigeria: A Scoping Review of NDHS 2018 vs. NDHS 2023. Yenagoa Medical Journal (2025).
- Nigeria Demographic and Health Survey 2018. 2019.
- 2021 Multiple Indicator Cluster Survey (MICS) & National Immunization Coverage Survey (NICS). 2022.
- Baptiste AEJ, et al. High-Resolution Geospatial Mapping of Zero-Dose and Underimmunized Children Following Nigeria’s 2021 Multiple Indicator Cluster Survey/National Immunization Coverage Survey. Journal of Infectious Diseases 230 (2024): e131-e138.
- Utazi CE, et al. Geospatial Variation in Vaccination Coverage and Zero-Dose Prevalence at the District, Ward and Health Facility Levels Before and After a Measles Vaccination Campaign in Nigeria. Vaccines (Basel) 12 (2024).
- Agbedi EB, Agbedi PG. Geospatial Disparities in Immunization Coverage: Identifying High Zero-Dose Wards for Targeted Primary Healthcare Intervention in Hard-to-reach Settings. J. Pediatr. Perinatol. Child Health 10 (2026): 178-200.
- Agbedi EB, Oweibia M, Peres Ekiyor C. Assessment of Childhood Vaccine Immunization Coverage, Card Retention, and Compliance in Bayelsa State post-Gavi support: A Household Survey of Children Aged 0-59 Months. J. Pediatr. Perinatol. Child Health 9 (2025).
- Hawkridge T. ZERO-DOSE CHILDREN AND MISSED COMMUNITIES: ENSURING THAT NO ONE IS LEFT BEHIND IN THE AFRICAN IMMUNIZATION AGENDA. 2025.
- Health Equity Assessment Toolkit Built-in Database Edition. 2019.
- WHO/UNICEF. Progress and Challenges with Achieving Universal Immunization Coverage 2024 WHO/UNICEF Estimates of National Immunization Coverage. 2024.
- Aheto JMK, et al. Geospatial Analyses of Recent Household Surveys to Assess Changes in the Distribution of Zero-Dose Children and Their Associated Factors before and during the COVID-19 Pandemic in Nigeria. Vaccines (Basel) 11 (2023).
- Umar HJ, Onah SI, Popoola O, et al. Widening Geographical Inequities in DTP Vaccination Coverage and Zero-Dose Prevalence Across Nigeria: An Ecological Trend Analysis (2018-2024). Vaccines (Basel) 13 (2025).
- O’Brien K. Member States Information Session-The global immunization ‘Big Catch-Up’ effort Agenda Opening Remarks (5mins). 2023.
- Utazi CE, et al. Geospatial variation in measles vaccine coverage through routine and campaign strategies in Nigeria: Analysis of recent household surveys. Vaccine 38 (2020): 3062-3071.
- Agbedi EB, Agbedi P-EG. Behavioural Determinants of Caregivers’ Participation in Routine Childhood Immunization in Rural Sub-Saharan Africa: The Role of Beliefs, Attitudes, Social Influence, and Motivation. International Journal of Epidemiology and Public Health Research 10 (2026).
- Williams SV, Akande T, Abbas K. Systematic review of social determinants of childhood immunisation in low- and middle-income countries and equity impact analysis of childhood vaccination coverage in Nigeria. PLoS One 19 (2024).
- Bendera A, et al. Persistent socioeconomic disparities in childhood vaccination coverage in Tanzania: Insights from multiple rounds of demographic and health surveys. Vaccine 52 (2025): 126904.
- Agbedi EB, Oweibia M, Timighe GC. Impact of Maternal Education on Perinatal Outcomes in Delta State Nigeria. Journal of Gynecology and Reproductive Health 4 (2026): 1-12.
- Streatfield K, Singarimbun M, Diamond I. Maternal Education and Child Immunization. Demography 27 (1990): 447-455.
- Gebreyesus A, Tesfay K. Effect of maternal education on completing childhood vaccination in Ethiopia: systematic review and meta-analysis. Scientific Reports 14 (2024).
- Singh BK, Khatri RB. Determinants of wealth-related inequalities in full vaccination coverage among children in Nepal: a decomposition analysis of nationally representative household survey data. BMC Public Health 24 (2024).
- Wiysonge CS, Uthman MMB, Ndwandwe D, et al. Multilevel Analysis of Zero-Dose Children in Sub-Saharan Africa: A Three Delays Model Study. Vaccines (Basel) 13 (2025).
- Jiao B, et al. Potential antenatal care-mediated benefits of delivering maternal immunization in five low- and middle-income countries: a modeling analysis. Vaccine 79 (2026): 128469.
- Jones C, Heath P. Antenatal immunization: Concepts and challenges. Human Vaccines & Immunotherapeutics 10 (2014): 2118-2122.
- Hamina D, Sharoni SKA, Teriyla KR, et al. Barriers to Childhood Immunisation in Nigeria: A Scoping Review of Recent Empirical Studies. Malaysian Journal of Medicine and Health Sciences 21 (2025): 227-239.
- Levin A, Fisseha T, Reynolds HW, et al. Scoping Review of Current Costing Literature on Interventions to Reach Zero-Dose Children in Low- and Middle-Income Countries. Vaccines (Basel) 12 (2024).
- Oteri JA, et al. Journey to Integration of Injectable Antigens in Mass Vaccination Campaign; Benefits and Challenges using 2019 Meningitis A (Men A) and Measles Integrated Campaign in Nigeria. J. Community Med. Public Health 7 (2023).
- Mak J, et al. Multivariate assessment of vaccine equity in Nigeria: A VERSE tool case study using demographic and health survey 2018. Vaccine X 14 (2023).
- Cherima YJ, Enebeli UU. Mapping the margins: A high-resolution geospatial analysis of zero-dose children in Northern Nigeria to guide precision public health interventions. International Journal of Medical and Health Research (2026).
- Kim D, Pekgün P, Yildirim İ, et al. Resource allocation for different types of vaccines against COVID-19: Tradeoffs and synergies between efficacy and reach. Vaccine 39 (2021): 6876-6882.