Maša Škrlep1,2*, Bojan Knap3,4
1Department of Food Science and Technology, Biotechnical Faculty, University of Ljubljana, Jamnikarjeva 10, 1000 Ljubljana, Slovenia
2Biotechnical centre Naklo, Strahinj 99, 4202 Naklo, Slovenia
3Department of Nephrology, Medical Faculty, University Medical Center, Ljubljana, Slovenia
4Faculty of Medicine, University of Ljubljana, Korytkova ulica 2, 1000 Ljubljana, Slovenia
*Corresponding Author: Maša Škrlep, Department of Food Science and Technology, Biotechnical Faculty, University of Ljubljana, Jamnikarjeva 10, 1000 Ljubljana, Slovenia
Received: 29 September 2023; Accepted: 13 October 2023; Published: 11 January 2024
DOI: 10.26502/jfsnr.2642-110000145
ShareIntroduction: Evaluation of dietary intake of patients on peritoneal dialysis is necessary for understanding the elevated phosphate levels, as well as protein intake monitoring, which struggles to meet current dietary guidelines.
Methods: The single-center observational study. 20 patients on peritoneal dialysis were randomly selected. A food propensity questionnaire has been carried out with three unannounced 24-hour dietary recalls per participant through a web-based application. Body composition has been measured with bio impedance spectroscopy. Continuous variables between normal values and of study values were compared using paired t-tests and Wilcoxon signed ranks test. A two-tailed P value <0.05 was considered statisticallx significant.
Results: Average caloric intake of 20 patients was (25.6 ± 6.7) kcal/kg body mass (BM)/day, average protein intake was (0.9 ± 0.3) g/kg BM/ day. They were inadequate according to the dietary recommendations for dialysis patients on peritoneal dialysis (PD). Average intake of micro-nutrients (K, P, Na) corresponds to the recommendations for dialysis patients which is surprisingly according to high levels of serum phosphorus ((1.6 ± 0.4) mmol/L) and intact parathyroid hormone ((450 ± 393) ng/L). Phosphorus intake was moderately correlated with the dietary energy intake (p = 0.0001). The correlation between dietary phosphorus intake and serum phosphorus was insignificant (p = 0.509). The correlation between dietary phosphorus to dietary protein ratio was 0,159. In dietary report showed 60 % of animal protein intake and 40 % of plant protein intake. Dietary phosphorus and protein intake ratio was (16 ± 3.6) mg/g. Inorganic phosphate from additives were not detected in all item because of lack of information in database.
Conclusion: Food databases are needed in order to provide optimal nutrition. Patients still lack proper nutritional knowledge, hence new educational technics and help will be needed in the future. Detecting inorganic phosphate is difficult due to lack of information in databases and specific bioavailability and absorption.
Diet recall, Protein intake, Phosphate intake, Peritoneal dialysis, Hyperphosphatemia
Diet recall articles; Protein intake articles; Phosphate intake articles; Peritoneal dialysis articles; Hyperphosphatemia articles
Introduction
Nutritional management of patients should be an integral part of the treatment of dialysis patients. Successful nutritional counselling, which in addition to nutritional status assessment is essential for treatment determination, requires knowledge of the origin and problems of phosphate [1]. Elevated serum phosphate (P) concentrations and consequent hyperphosphataemia represent a major risk factor for poorer treatment outcomes and earlier mortality [2]. Serum phosphate concentrations depend on dietary phosphate intake, gastrointestinal absorption, glomerular filtration, renal tubular excretion and reabsorption, and the balance between excretion and resorption. Additional factors include vitamin D, parathyroid hormone and fibroblast growth factor (FGF-23) [3,4] estrogen and calcium intake. Normal concentrations should be between 3.0-4.5 mg/dl or 0.8-1.5 mmol/L [5] and vary according to the circadian rhythm (minimum values in the morning and maximum in the evening) [6]. In the course of chronical kidney disease (CKD), serum P levels remain within normal limits until advanced stages. Hyperphosphataemia should be considered as a very late indicator of P retention. Elevated intact parathyroid hormone (iPTH) is seen first, and elevated FGF-23 - which induces a phosphaturin response that contributes to the maintenance of a neutral P balance - is seen even earlier [5,6]. The ability to absorb is influenced by the total amount of dietary phosphate and the type of phosphate (organic and inorganic), the origin of the food (plant and animal), and the ratio of phosphate to the other components of the food [7,8,9]; how much is absorbed depends on the enzymatic degradation [6], with an efficiency of 55-90% [10]. Most dietary phosphate is absorbed in the intestine [10], especially inorganic phosphate from phosphate supplements (mainly free orthophosphate), which is 80-90% absorbed. Phytate is present in foods high in dietary fibre, which improves the integrity of the intestinal barrier, which plays a role in reducing toxin production, slowing CKD and inflammation, and anti-constipation [11-13], which occurs in PD patients due to phosphate binders, potassium restriction, and antibiotics [14,15]. Phosphate additives are still a major problem and are not present in food databases because only the name is recorded and not the concentrations, which can lead to a 30% deviation from the real phosphate value [16], and phosphates are not only present where they are actually listed, but also in modified starch [17], which is present in dairy and bakery products and in plant-based alternatives to dairy products [18,19].
Poor nutritional status is very common among dialysis patients, occurring in more than 20% of dialysis patients, who often experience protein-energy wasting (PEW), mainly due to dietary phosphate restriction [20,21]. Parameters related to nutritional status and survival are phase angle (a marker for predicting disease course) (22) and fat mass, which are obtained by bioimpedance analysis [23] In addition, parameters of nutritional analysis are important - energy intake, protein intake and micronutrient intake (Ca, P, Na), as well as parameters of biochemical analysis, in particular serum albumin, which is used as a marker of nutritional status mainly because it is influenced by protein intake and may also be affected by associated liver disease and gastrointestinal and renal losses. Low levels are associated with inflammatory processes, and a fall in albumin levels is significantly associated with the development of peritonitis [23]. Phosphate levels may be high, particularly in patients who have had CKD since childhood and have not had adequate dietary management, and therefore the consumption of dairy products is discouraged and a plant-based alternative is encouraged [18].
Methods
This study was an observational, cross-sectional study including patients treated with maintenance PD at the inpatient PD ward of the University Medical Centre Ljubljana. Patients were enrolled in the study from December 2017 to March 2018. Exclusion factors were active congestive heart failure, advanced liver disease, active malignancy, recent peritonitis. All subjects signed an informed consent before inclusion in the study. The study protocol was approved by the Medical Ethics Committee of the Republic of Slovenia (protocol code 0120-330/2017/6, 15 May 2018). Subjects participated in the study voluntarily and could withdraw from the study at any point. Twenty patients receiving dialysis treatment (PD and combined) were included in the study. Three patients were excluded from the study because they received a replacement therapy with a transplant before completion of the dietary interview. Mean age (54.7 ± 17.3) years, min 26 and max 91 years, 45% women and 55% men.
Nutritional status
A dietary interview was conducted three times over a period of three months to obtain the previous day's menu (24-hour recall) and analysed using the OPEN (Platform for Clinical Nutrition) online tool. Validated images were used in the interview to facilitate portion sizing. Pre-packaged foods were searched online and grams listed on the declarations were entered, missing values for the food (micronutrients) were found for the equivalent food during data processing, and missing values were added to the printout. Nutritional status was compared with body weight composition by bioimpedance spectroscopy (BIS) to calculate lean tissue index (LTI), fat tissue index (FTI), overhydration (OH) and Ph A as a prognostic index [15]. Ph A was calculated by bioimpedance spectroscopy using the following formula: Ph A (°) = arctangent (X c/R) * (180/π).
Biochemical tests
Data on biochemical tests were obtained from Hippocrates for the period during which the dietary interviews and bioimpedance analysis were performed. Blood samples were taken in the morning and plasma concentrations of calcium, phosphorus, albumin, magnesium and protein were measured.
Each value was expressed as a percentage or as mean ± SD. Continuous variables between baseline and study values were compared by paired t-tests and Wilcoxon signed rank tests. A two-sided P value < 0.05 was considered statistically significant. Statistical analysis of the data was performed using Excel and XLStat.
Results
The study included 20 patients undergoing dialysis treatment (PD and combined). Three patients were excluded from the study because they received a replacement therapy with a transplant before completion of the dietary intervention. Mean age (54.7 ± 17.3) years, min 26 and max 91 years, 45% women and 55% men. Baseline biochemical data (presented as mean values ± SD) are shown in table 1.
|
Biochemical parameter |
Mean ± SD |
Reference value |
|
Albumin (g/l) |
36,3 ± 4,2 |
32-35 |
|
Protein (g/l) |
64,2 ± 8,4 |
65-80 |
|
Phosphate (mmol/l) |
1,6 ± 0,4 |
0,84-1,45 |
|
Creatinine (μmol/l) |
745 ± 200 |
440-970 |
|
Urea (mmol/l) |
21 ± 6,0 |
2,8-7,5 |
|
Hemoglobin (g/l) |
114 ± 14 |
130-170 |
|
Potassium (mmol/l) |
4,5 ± 0,5 |
3,8-5,50 |
|
Calcium (mmol/l) |
2,3 ± 0,1 |
2,1-2,6 |
|
iPTH (ng/l) |
450 ± 390 |
12-65 |
|
Natrium (mmol/l) |
136,3 ± 4,3 |
135-145 |
|
Vit D (25-OH-D3) (nmol/l) |
54 ± 20 |
75 |
Table 1: Biochemical parameters obtained through blood analysis conducted on days of dietary interviews, including albumin (g/l), protein (g/l), phosphate (mmol/l), creatinine (μmol/l), urea (mmol/l), hemoglobin (g/l), potassium (mmol/l), calcium (mmol/l), iPTH (ng/l), sodium (mmol/l), and vitamin D (25-OH-D3) (nmol/l), all reported as mean ± SD, all accompanied by reference values.
Energy, protein, fat, carbohydrate, potassium, sodium, phosphate intake (with 24-h recall), body mass composition with BIS (LTI, FTI, OH, PhA) compared with recommended or normal values for all parameters are shown in table 2.
|
Body composition |
Mean ± SD |
Reference value |
|
Phase angle (°) |
4,9 ± 1,2 |
< 5 (man); <4,6 (woman) |
|
BMI (kg/m2) |
25,1 ± 3,2 |
18 – 25 |
|
LTI (kg/m2) |
12,7 ± 2,6 |
< 14,6 (man); < 11,4 (woman) |
|
FTI (kg/m2) |
11,8 ± 4,2 |
7 |
Table 2: Anthropometric data acquired through bioimpedance analysis are displayed, featuring phase angle, BMI (body mass index), LTI (lean body mass index), and FTI (fat tissue index), all accompanied by reference values.
The phase angle (4.9 ± 1.2)° was lower than recommended in 11 patients, 55% of patients had a damaged cell membrane. The body mass index (25.1 ± 3.2) kg/m2 was not lower than 18.5 in any patient, indicating malnutrition, and the body mass index (12.7 ± 2.6) kg/m2 was lower than recommended values in 45% of patients, indicating protein-energy malnutrition in patients, as confirmed by S-albumin (36.3 ± 4.2) g/l. Dietary intake was too low (25.6 ± 6.7) kcal/kg BM, minimum 12.45, maximum 39.4, as shown in table 3.
|
Patients data |
Recommended values |
|
|
Kcal/ kg BM |
25,6 ±6,7 |
35 |
|
Protein (g/kg BM) |
0,9 ± 0,3 |
1.2 |
|
Fat (g) |
55 ± 20 |
55 |
|
Carbohydrates (g) |
181 ± 57 |
210 |
|
Na (mg) |
2260 ± 1250 |
1800-2500 |
|
K (mg) |
2390 ± 637 |
2000-2500 |
|
Phosphate (mg) |
960 ± 220 |
800-1000 |
|
Calcium (mg) |
753 ± 416 |
1000 |
Table 3: Nutritional data acquired through dietary analysis of the previous day, conducted via dietary interviews using the online OPEN application. The data includes kcal/kg body mass (BM), protein (g/kg BM), fat (g), carbohydrates (g), sodium (mg), potassium (mg), phosphate (mg), and calcium (mg), all compared with recommended values in the rightmost column.
Body mass index (BMI) and reported energy intake were not positively correlated (r=-0.021, p=0.928). There is an association between energy intake and body weight (correlation coefficient 0.181, p=0.466), with a 20% increase in energy intake in patients with a BMI above 25 kg/m2 reversing the association (Pearson test, correlation coefficient R=0.301, p=0.197), while a comparison between a 20% increase in energy intake and body weight showed a strong association r=0.443, p=0.05. It is possible that patients inadequately reported their energy intake, which may have influenced the inaccuracy of the overall results of the nutritional analysis. The mean protein intake of the analysed patients was (0.9 ± 0.3) g/kg BM/day. Only two patients reached the recommended values of 1.2 g/kg BM/day (Figure 1). If the recommended values according to the t-test were lowered to 1 g/kg (37) (BM/day, this would indicate that the patients consumed sufficient protein, as the p-value is greater than the statistical significance level of 0.05 (p= 0.057).
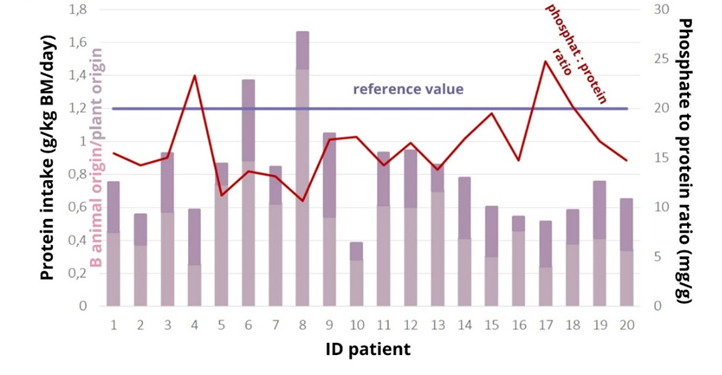
Figure 1: The protein intake in the studied dialysis patients, expressed in g/kg body mass (BM) per day and categorized by source. The purple line represents the recognized reference value for protein intake at 1.2 g/kg TB/day, while the red line represents the phosphate:protein ratio.
Student's t-test showed that the amount of phosphate consumed was not statistically different from the reference amount of 900 mg, p=0.265. The patients did not consume too much phosphate (958±22) mg. S-phosphate (1.6±0.4) mmol/L was elevated in 12 patients, severely elevated in two (2.21 and 2.72 mmol/L), at the reference limit in three patients, all with hyperphosphataemia. Dietary phosphate intake was not associated with serum phosphate levels, Spearman's test showed that there was no statistically significant association between the amount of phosphate intake and serum phosphate levels, p=0.509, r=0.156, indicating that phosphate intake is not associated with phosphate levels. There is a strong correlation between energy intake and phosphate intake (r=0.937, p=0.0001) (Figure 2), so any under-reporting of energy intake results in under-reporting of phosphate intake.
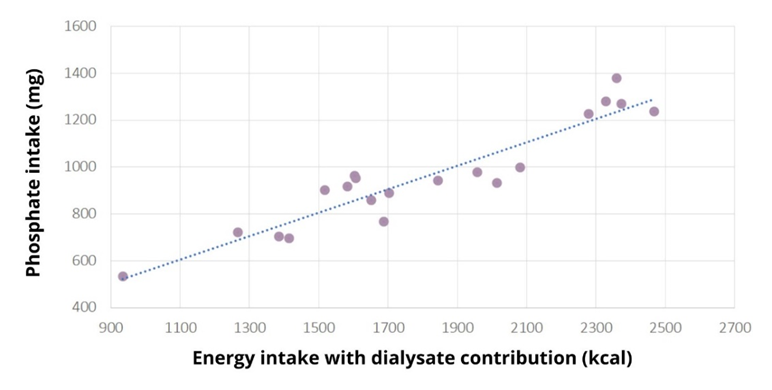
Figure 2: Scatterplot of the Pearson correlation test between normally distributed variables: phosphate intake (mg) and energy intake with contributions from dialysate energy (kcal) in the studied dialysis patients. A strong correlation is observed between energy intake and phosphate intake (r=0.937, p=0.0001), indicating that any under-reporting of energy intake results in under-reporting of phosphate intake.
Discussion
Our observational, cross-sectional study revealed some limitations in estimating food intake, which contributed to the underestimation of reported food intake. The chosen method of using 24-h recall introduces the possibility of underreporting, which may be influenced by factors such as anxiety, discomfort, or cognitive biases associated with recalling food choices from the previous day, which may be as much as 20-86% higher than the real one [24,25]. This phenomenon is particularly prevalent among women, the elderly, and individuals with a body mass index >25 kg/m2. Adherence to this limitation is crucial because underreported dietary intake can lead to misinterpretation of the true nutritional status of patients. In addition to underreporting, inadequate dietary intake also implies an underestimation of other nutrients, mainly protein, phosphate, calcium, potassium, and sodium, the data of which have an impact on patient pathogenesis. Our patient cohort had a wide age range, with a mean age of 54.7 years, comprising 45% women and 55% men. The baseline biochemical data presented in table 1 indicate variability in parameters such as energy, protein, fat, carbohydrate, potassium, sodium, and phosphate intake, which formed the basis for our subsequent analysis. The mean protein intake was low, which is in line with other studies, Silva et al. [26] so with 24h-recall estimated 0.90 (0.58-1.22) g/kg current BW/day, daily protein intake estimated by PNA was 0.81 (0.72-0.99) g/kg. An interesting finding was the higher proportion of animal protein consumed (60%), which deviated from the recommended ratio of at least 50% plant protein recommended by guidelines for dialysis patients [21,28]. These guidelines aim to reduce the risk of protein energy wasting (PEW), which is associated with adverse outcomes in patients with chronic kidney disease (CKD) like lowe pressure, slower regression of disease and prevention of metabolic diseases [29,30,41,42]. Addressing the composition of dietary protein sources is emerging as a potential strategy for optimizing dietary management and reducing the impact of hyperphosphatemia. Serum phosphate levels were elevated in most patients [12], and hyperphosphatemia was found in all patients, although they did not consume too much phosphate unless underreporting was a problem. Phosphate has a particular impact on malnourished patients with a low glomerular filtration rate (GFR) and concomitant high dietary phosphate intake [8], with meals of animal origin [31], making it reasonable to use the protein-phosphate ratio [32,33,7], especially when assessing protein foods. Wlodarek et al. [36] reported no difference between protein type and phosphorus intake (r = 0.586, P < 0.01, vs. r = 0.674, P < 0.01), but on the other side, Gebretsadik et al. [37] reported a higher correlation of animal protein and phosphours inake versus plant protein and phosphours intake (r = 0.652, P < 0.01, vs. r = 0.202, P = 0.04) but there was, for most participants energy, potassium and phosphorus intake below recommendations while protein intake was below -how is that? [25]. Azadbakht et al. [38] evaluate soy protein on renal markers and report that soy consumption reduces serum phosphate levels compared to animal protein. Doung et al. [39] discoverd that nutrition education about protein summplements was assicoated wiht increased protein intake and nutritional status but not serum phosphate in PD patients. Garcia-Torres et al. wanted to determine how protein source impacts phosphorus intake, but most patients consumed energy, protein, phosphorus and potassium below recommendations, but soduim and fats abouve recommendations. Those consuming more plant proteins had lower phosphorus and protein intakes. Low protein intake and, consequently, low s-albumin levels stimulate inflammatory processes, which are unfavorable for the outcome of treatment. Heat treatment of foods is also a possible method to reduce phosphate levels [34]. However, we do not know the amount of phosphate obtained from additives; therefore, guidelines need to be translated into real-world situations [35].
Conclusion
We rejected the hypothesis that patients overconsume phosphate and hypothesise that this is due to underreporting of total intake in the previous day's menu recall method (p = 0.0001) and the absence of data on phosphate additives in the database. Despite the small sample size (20), our findings highlight the problem of plasticity in setting dietary rules for patients, which may lead to collateral damage in other aspects - in our case, underestimation of energy and protein intake and consequent poorer quality of life of the patient. In the treatment of renal and other chronic diseases, a multidisciplinary approach is essential, both in terms of methods and personnel. It is important to monitor the nutritional status of patients and to analyse nutrient intakes. This will show the patient's willingness to contribute independently to the treatment and to work more successfully with the dietician and the doctor.
References
- Isakova T, Nickolas TL, Denburg M, et al. KDOQI US Commentary on the 2017 KDIGO Clinical Practice Guideline Update for the Diagnosis, Evaluation, Prevention, and Treatment of Chronic Kidney Disease-Mineral and Bone Disorder (CKD-MBD). Am J Kidney Dis 70 (2017): 737-751.
- Block GA, Klassen PS, Lazarus JM, et al. Mineral metabolism, mortality, and morbidity in maintenance hemodialysis. J Am Soc Nephrol 15 (2004): 2208-2218.
- Murtaugh MA, Filipowicz R, Baird BC, et al. Dietary phosphorus intake and mortality in moderate chronic kidney disease: NHANES III. Nephrol Dial Transplant 27 (2012): 990-996.
- Rastogi A, Bhatt N, Rossetti S, et al. Management of Hyperphosphatemia in End-Stage Renal Disease: A New Paradigm. J Ren Nutr 31 (2021): 21-34.
- Boaz M, Smetana S. Regression equation predicts dietary phosphorus intake from estimate of dietary protein intake. J Am Diet Assoc 96 (1996): 1268-1270.
- Cupisti A, Gallieni M, Rizzo M, et al. Phosphate control in dialysis. Int. J. Nephrol. Renovasc. Dis. 6 (2013): 193-205.
- Noori N, Sims JJ, Kopple JD, et al. Organic and inorganic dietary phosphorus and its management in chronic kidney disease. Iran J Kidney Dis 4 (2010): 89-100.
- Moore LW, Nolte JV, Gaber AO, et al. Association of dietary phosphate and serum phosphorus concentration by levels of kidney function. Am J Clin Nutr 102 (2015): 444-453.
- Sherman RA, Mehta O. Dietary phosphorus in dialysis patients: potential impact of processed meat, poultry, and fish products as protein sources. Am J Kidney Dis 54 (2009): 18-23.
- Scanni R, VonRotz M, Jehle S, et al. The human response to acute enteral and parenteral phosphate loads. J Am Soc Nephrol 25 (2014): 2730-2739.
- Sabatino A, Regolisti G, Cosola C, et al. Intestinal microbiota in type 2 diabetes and chronic kidney disease. Curr. Diab. Rep 17 (2017): 16.
- Vaziri ND, Wong J, Pahl M, et al. Chronic kidney disease alters intestinal microbial flora. Kidney Int 83 (2013): 308-315.
- Hobby GP, Karaduta O, Dusio GF, et al. Chronic kidney disease and the gut microbiome. Am. J. Physiol.-Ren. Physiol 316 (2019): F1211-F1217.
- Sumida K, Molnar MZ, Potukuchi PK, et al. Constipation and incident CKD. J. Am. Soc. Nephrol 28 (2017): 1248-1258
- Karp H, Ekholm P, Kemi V, et al. Differences among total and in vitro digestible phosphorus content of meat and milk products. J Ren Nutr 22 (2012): 344-349.
- Calvo MS, Moshfegh AJ, Tucker KL. Assessing the health impact of phosphorus in the food supply: issues and considerations. Adv Nutr 5 (2014): 104-113.
- European Parliament and the Council. Regulation (EU) No 1169/ 2011 of the European Parliament and of the Council of October 2011 on the provision of food information to consumers, amending Regulations (EC) No 1924/2006 and (EC) No 1925/2006 of the European Parliament and of the Council, and repealing Commission Directive 87/250/EEC, Council Directive 90/496/EEC, Commission Directive 1999/10/EC, Directive 2000/13/EC of the European Parliament and of the Council, Commission Directives 2002/67/EC and 2008/5/EC and Commission Regulation (EC) No 608/2004.
- EFSA Panel on Food Additives and Nutrient Sources added to Food. Scientific Opinion on the re-evaluation of oxidised starch (E 1404), monostarch phosphate (E 1410), distarch phosphate (E 1412), phosphated distarch phosphate (E 1413), acetylated distarch phosphate (E 1414), acetylated starch (E 1420), acetylated distarch adipate (E 1422), hydroxypropyl starch (E 1440), hydroxypropyl distarch phosphate (E 1442), starch sodium octenyl succinate (E 1450), acetylated oxidised starch (E 1451) and starch aluminium octenyl succinate (E 1452) as food additives. EFSA J. 2017;15:4911
- Phosphorus-Containing Food Additives in the Food Supply-An Audit of Products on Supermarket Shelves - Tuominen M, Karp HJ, Itkonen ST. Phosphorus-Containing Food Additives in the Food Supply-An Audit of Products on Supermarket Shelves. J Ren Nutr 32 (2022): 30-38.
- Abad S, Sotomayor G, Vega A, et al. The phase angle of the electrical impedance is a predictor of long-term survival in dialysis patients. Nefrologia 31 (2011): 670-676.
- Ikizler TA, Burrowes JD, Byham-Gray LD, et al. KDOQI Clinical Practice Guideline for Nutrition in CKD: 2020 Update. Am J Kidney Dis 76 (2020): S1-S107.
- Park JH, Jo YI, Lee JH. Clinical usefulness of bioimpendance analysis for assessing volume status in patients receiving maintenance dialysis. Korean Journal of internal medicine 33 (2018): 660-669.
- Kiebalo T, Holotka J, Habura I, et al. Nutritional Status in Peritoneal Dialysis: Nutritional Guidelines, Adequacy and the Management of Malnutrition. Nutrients 12 (2020): 1715.
- Bazanelli AP, Kamimura MA, Vasselai P, et al. Underreporting of energy intake in peritoneal dialysis patients. J Ren Nutr 20 (2010): 263-269.
- Poslusna K, Ruprich J, De Vries JH, et al. Misreporting of energy and micronutrient intake estimated by food records and 24 hour recalls, control and adjustment methods in practice. The British journal of nutrtion 101 (2009): 73-85.
- Silva MZC, Vogt BP, Reis NSC, et al. Which Method Should Be Used to Assess Protein Intake in Peritoneal Dialysis Patients? Assessment of Agreement Between Protein Equivalent of Total Nitrogen Appearance and 24-Hour Dietary Recall. J Ren Nutr 31 (2021): 320-326.
- Santin F, Canella D, Borges C, et al. Dietary Patterns of Patients with Chronic Kidney Disease: The Influence of Treatment Modality. Nutrients 11 (2019): 896.
- Hanna RM, Ghobry L, Wassef O, et al. A Practical Approach to Nutrition, Protein-Energy Wasting, Sarcopenia, and Cachexia in Patients with Chronic Kidney Disease. Blood Purif 49 (2020): 202-211.
- Cases A, Cigarran-Guldris S, Mas S, et al. 2019. Vegetable-Based Diets for Chronic Kidney Disease? It is time to reconsider. Nutrients 6 (2019): 12-63.
- Maraj M, Kusnierz-Cabala B, Dumnicka P, et al. Malnutrition, Inflammation, Atherosclerosis Syndrome (MIA) and Diet Recommendations among End-Stage Renal Disease Patients Treated with Maintenance Hemodialysis. Nutrients 10 (2018): 69.
- Moe SM, Zidehsarai MP, Chambers MA, et al. Vegetarian compared with meat dietary protein source and phosphorus homeostasis in chronic kidney disease. Clin J Am Soc Nephrol 6 (2011): 257-264.
- Noori N, Sims JJ, Kopple JD, et al. Organic and inorganic dietary phosphorus and its management in chronic kidney disease. Iran J Kidney Dis 4 (2010): 89-100.
- Barril-Cuadrado G, Puchulu MB, Sánchez-Tomero JA. Table showing dietary phosphorus/protein ratio for the Spanish population. Usefulness in chronic kidney disease. Nefrologia 33 (2013): 362-371.
- Vrdoljak I, Panjkota Krbavcic I, Bituh M, et al. Analysis of different thermal processing methods of foodstuffs to optimize protein, calcium, and phosphorus content for dialysis patients. J Ren Nutr 25 (2015): 308-315.
- Byrne FN, Gillman B, Kiely M, et al. Translation of Nutrient Level Recommendations to Control Serum Phosphate Into Food-Based Advice. J Ren Nutr 31 (2021): 43-48.
- Wlodarek D, Glabska D, Rojek-Trebicka J. Assessment of diet in chronic kidney disease female predialysis patients. Annals of agricultural and environmental medicine: AAEM 21 (2014): 829-834.
- Gebretsadik GG, Mengistu ZD, Molla BW, et al. Patients with chronic kidney disease are not well adhered to dietary recommendations: a cross-sectional study. BMC nutrition 6 (2020): 14.
- Azadbakht L, Esmaillzadeh A. Soy-protein consumption and kidney-related biomarkers among type 2 diabetics: a crossover, randomized clinical trial. Journal of renal nutrition: the official journal of the Council on Renal Nutrition of the National Kidney Foundation 19 (2009): 479-486.
- Duong TV, Tsao CA, Yang E, et al. Education and Protein Supplementation Improve Nutritional Biomarkers among Hypoalbuminemic Peritoneal Dialysis Patients: A Quasi-Experimental Design. Healthcare (Basel, Switzerland) 7 (2019): 135.
- Garcia-Torres R, Young L, Murray DP, et al. Dietary Protein Source and Phosphate Levels in Patients on Hemodialysis. Journal of renal nutrition : the official journal of the Council on Renal Nutrition of the National Kidney Foundation 30 (2020): 423-429.
- GBD 2017 Diet Collaborators. Health effects of dietary risks in 195 countries, 1990-2017: a systematic analysis for the Global Burden of Disease Study 2017. Lancet (London, England) 393 (2019): 1958-1972.
- Kopple JD. National kidney foundation K/DOQI clinical practice guidelines for nutrition in chronic renal failure. American journal of kidney diseases : the official journal of the National Kidney Foundation 37 (2001): S66-S70.