Screening of Core Genes for Gastric Cancer Promoting M2 Macrophage Polarization by Weighted Gene Co-expression Network Analysis
Zidong Zhao1,2,#, Dandan Zhao3,#, Yu Tan4, Satoshi Endo*,1,5,6, Yanwen Liu*,2
1United Graduate School of Drug Discovery and Medical Information Sciences, Gifu University, Gifu 501-1194, Japan
2School of Medicine, Southeast University, Nanjing 210009, Jiangsu, China.
3Department of Gastroenterology, the Affiliated Hospital of Xuzhou Medical University, Xuzhou 221002, Jiangsu Province, China.
4Huangdao Traditional Chinese Medicine Hospital, Qingdao266500, Shandong Province, Department of Gastroenterology, the Affiliated Hospital of Xuzhou Medical University, Xuzhou 221002, Jiangsu Province, China.
5Center for One Medicine Innovative Translational Research (COMIT), Institute for Advanced Study, Gifu University, Gifu 501-1193, Japan
6Preemptive Food Research Center, Institute for Advanced Study, Gifu University, Gifu 501-1193, Japan
#These authors contributed equally to this work.
*Corresponding author: Satoshi Endo, United Graduate School of Drug Discovery and Medical Information Sciences, Gifu University, Gifu 501-1194, Yanwen Liu, School of Medicine, Southeast University, Nanjing 210009, Jiangsu, China.
Yanwen Liu, School of Medicine, Southeast University, Nanjing 210009, Jiangsu, China
Received: 15 October 2025; Accepted: 18 October 2025; Published: 21 October 2025
Article Information
Citation: Zidong Zhao, Dandan Zhao, Yu Tan, Satoshi Endo, Yanwen Liu. Screening of Core Genes for Gastric Cancer Promoting M2 Macrophage Polarization by Weighted Gene Co-expression Network Analysis. Journal of Pharmacy and Pharmacology Research. 9 (2025): 144-154.
Share at FacebookAbstract
Objective: M2 macrophages promote gastric cancer (GC) progression via chemokine secretion, inflammation suppression, and angiogenesis/lymphangiogenesis. To address low GC survival and the need for prognostic predictors/therapeutic targets, this study used WGCNA to screen core genes driving M2 polarization in GC, build a prognostic model, and explore drug sensitivity.
Methods: 381 STAD samples were obtained from TCGA. CIBERSORT calculated immune cell infiltration for grouping; Kaplan-Meier analysis assessed prognosis. WGCNA constructed co-expression modules to screen key modules and core genes. GO/KEGG enrichment analyses were performed. Cox regression built and validated a risk model; a nomogram was developed with clinical data. Cell Miner analyzed drug sensitivity.
Results: High M2 infiltration correlated with poorer prognosis. WGCNA generated 18 modules, identifying the turquoise module and 160 core genes. Enrichment analyses clarified their functional pathways. A validated 3-gene (BCHE, CHRDL1, CNTN1) risk model and a nomogram were established. High-risk patients showed higher sensitivity to 8 drugs.
Conclusion: M2 infiltration is a poor prognostic marker for GC. The 3-gene model and BCHE (as a drug marker) contribute to GC prognosis prediction and precision therapy.
Keywords
Gastric Cancer; Tumor-Associated Macrophage(TAM); M2 Macrophage; Weighted Gene Co-Expression Network; Prognostic Model
Gastric Cancer articles; Tumor-Associated Macrophage?TAM) articles; M2 Macrophage articles; Weighted Gene Co-Expression Network articles; Prognostic Model articles.
Article Details
Introduction
Gastric cancer (GC) is one of the most prevalent malignant tumors worldwide, ranking fifth in terms of global incidence and third among the leading causes of cancer-related deaths [1, 2]. Due to the insidious nature of early-stage symptoms, most patients are diagnosed at an advanced stage of the disease, which results in a median survival time of less than 12 months for GC patients [3, 4]. In recent years, treatment strategies for GC have been increasingly diversified; the combined application of multiple approaches, such as neoadjuvant chemoradiotherapy, molecular targeted therapy, and immunotherapy, has provided more treatment options for patients [5]. Among these strategies, immunotherapy, particularly treatment with immune checkpoint inhibitors (ICIs), has become an important therapeutic regimen for patients with advanced GC [6]. Notably, the tumor microenvironment (TME) plays a crucial role in GC progression and treatment response [7], and tumor-associated macrophages (TAMs)—as the most abundant innate immune cells in the immune microenvironment—have currently emerged as a research hotspot and key target in the field of immunotherapy [8].
Tumor-associated macrophages (TAMs) are highly heterogeneous and mainly polarize into two functional phenotypes, the classically activated (M1) and the alternatively activated (M2) states, in gastric cancer [9], exerting distinct biological effects on the growth of gastric cancer cells. M1-type TAMs secrete cytokines such as interleukin-12 (IL-12), interleukin-23 (IL-23), tumor necrosis factor-α (TNF-α), and C-X-C motif chemokine ligand 10 (CXCL10). These cytokines enable M1-type TAMs to phagocytose and kill bacteria, present antigens, and recruit inflammatory cells to tumor cells, thereby participating in the immune response to eliminate tumor cells [10,11]. In contrast, M2 polarization is induced by interleukin-4 (IL-4) and interleukin-10 (IL-10) secreted by CD4+ T lymphocytes and regulatory T cells, which activate the signal transducer and activator of transcription 6 (STAT6) signaling pathway and stimulate the production of arginase-1. M2-type TAMs can be further subdivided into four subtypes: M2a, M2b, M2c, and M2d. Unlike M1-type TAMs, M2-type TAMs mainly suppress inflammatory responses and promote tumor initiation and progression [12, 13]. This study aimed to identify potential biomarkers and therapeutic targets associated with M2-type macrophages in gastric cancer using weighted gene co-expression network analysis (WGCNA) [14], so as to facilitate the early clinical diagnosis and treatment optimization of gastric cancer. Additionally, it constructed a prognostic model related to M2-type macrophages in gastric cancer and screened for drugs sensitive to key genes. This study not only provides important molecular markers for the prognostic evaluation of gastric cancer patients but also offers a new theoretical basis for revealing the mechanisms underlying the occurrence and development of gastric cancer.
Methods and Materials
Implementation of Data Preprocessing, Immune Infiltration, and Survival Analysis
To conduct this study, we first obtained the data of 381 stomach adenocarcinoma (STAD) samples from the TCGA database. Subsequently, the CIBERSORT immune infiltration analysis algorithm was applied to these samples to calculate the infiltration proportions of 22 types of immune cells. Among the numerous immune cells, M2-type macrophages were selected as the main research object in this study. To explore its relationship with prognosis, the 381 STAD sample data were divided into a high-infiltration group and a low-infiltration group of M2-type macrophages according to the optimal cutoff value (survival cutoff =0.1453127) of the immune infiltration percentage of M2-type macrophages. The high-infiltration group contained 83 samples, and the low - infiltration group contained 298 samples. Meanwhile, the Kaplan-Meier curve analysis method was used to perform survival analysis on the divided high and low infiltration groups, so as to evaluate the prognostic differences between the two groups.
Construction of Weighted Gene Co-expression Network (WGCNA) for Identifying Key Gene Modules Related to M2 Macrophages
Using differentially expressed genes (DEGs) between high and low M2-type macrophage infiltration groups, a standardized sample gene expression matrix was constructed, and STAD samples were systematically clustered by average gene expression levels with extremely abnormal samples excluded to reduce interference; via the R WGCNA package, soft thresholding powers (1–20) were calculated, scale-free topology fit index plots (correlating fit index with soft threshold) and mean connectivity plots (showing connectivity trends) were generated, and the optimal soft threshold (fit index > 0.8, high average connectivity) was selected; with this optimal threshold and a module merge cut height of 0.25, the gene co-expression network was divided into co-expressed modules using the dynamic tree cut algorithm, followed by hierarchical clustering of modules, visualization of intra-module gene correlation and inter-module association, and generation of a gene clustering tree to present module division results.
Correlation Analysis of Co-Expressed Modules to Verify Division Accuracy
To verify 18 co-expressed modules’ accuracy, systematic correlation analysis assessed inter-module relationships: a topological overlap adjacency heatmap (for module-specific DEGs screened by M2-type macrophage infiltration) was constructed, with axes representing 18 modules, topological overlap matrix (TOM) quantifying connectivity (higher values = stronger connectivity), and yellow brightness reflecting intra/inter-module differences; additionally, a module eigengene (derived from the first principal component of module gene PCA) adjacency heatmap was generated, with axes representing 18 modules, Pearson correlation coefficients quantifying associations, and a blue-red gradient (red = high positive correlation, blue = high negative correlation) identifying correlation strengths. Intra/inter-module connectivity (from the topological overlap heatmap) and correlation (from the eigengene heatmap) were cross-validated to judge module division independence and accuracy.
STAD Sample Data Preprocessing and Key Gene Module Selection Methods
Data preprocessing of STAD samples was performed based on CIBERSORT and Kaplan-Meier curves. To select key gene modules associated with promoting M2-type macrophage polarization, first, the correlation coefficients between module eigenvectors and clinical traits as well as the module significance P-values were calculated, and modules meeting the criteria of P < 0.05 and satisfying the required correlation coefficients were screened out; then, the Gene Significance (GS) and Module Membership (MM) of each gene in the selected module were calculated, and the correlation between MM and GS was analyzed by visualizing the MM vs GS plots.
GO and KEGG Enrichment Analysis of DEGs
For the 160 DEGs obtained through intersection screening, bioinformatics analysis tools were used to conduct Gene Ontology (GO) functional enrichment analysis and Kyoto Encyclopedia of Genes and Genomes (KEGG) pathway enrichment analysis, respectively. During the analysis, "adjust P < 0.05" was adopted as the statistical significance criterion to screen out the significantly enriched functional terms in the GO analysis and the significantly enriched signaling pathways in the KEGG analysis, to clarify the biological functions and pathway associations involved in the target genes.
Construction and Validation of Risk Prediction Model via Univariate Cox Regression and LASSO-COX Regression
Univariate Cox regression was performed on core genes to screen out prognosis-related genes. Then, LASSO-COX regression was used to construct a 3-gene risk prediction model. Correlation analysis was conducted between the M2 macrophage phenotypes (CD68, CD74, CD163) and the genes in the model. In the internal and external validation cohorts (GSE34942, GSE84433), the median risk score of the training cohort was used as the optimal cut-off value to divide gastric cancer patients in the training cohort, GSE34942, and GSE84433 into high-risk and low-risk groups. The model was validated through scatter plots, risk heatmaps, and Kaplan-Meier survival analysis.
Nomogram for Predicting Survival Rate of Gastric Cancer Patients Based on Risk Score and Clinical Traits
Using the "rms" package in R software, a nomogram was constructed by combining risk scores with clinical traits including age, gender, grade, and stage. By calculating patients' clinical traits and risk scores, accurate prediction of 1-year, 2-year, and 3-year survival rates of gastric cancer patients was achieved, so as to evaluate the accuracy of the model in predicting the survival rate of gastric cancer patients.
Analyzing BCHE Gene Expression and Antitumor Drug Sensitivity in Gastric Cancer Patients Based on CellMiner Database
Using the CellMiner database, gastric cancer patients were divided into high-risk and low-risk groups based on BCHE, a key gene in the model. Drug sensitivity analysis of the two groups was conducted separately for 8 antitumor drugs, including dabrafenib, dacarbazine, idebenone, narcotine, okadaic acid, PLX-4720, tipifarnib, and vemurafenib. Scatter plots and violin plots were drawn to display the correlation between BCHE gene expression and the drug activity z-scores of each drug, as well as the inter-group differences in drug sensitivity. This approach was used to clarify the sensitivity of high-risk patients to these drugs.
Results
Association Between M2 Macrophage Infiltration Level and Prognosis in STAD Patients
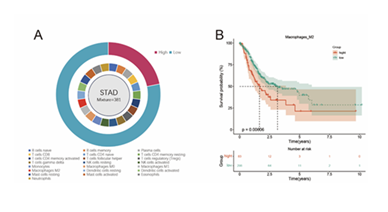
After performing CIBERSORT immune infiltration calculation on 381 STAD samples obtained from the TCGA database, the infiltration proportions of 22 immune cell types were successfully derived. Taking M2-type macrophages as the core research object, the samples were divided into a high-infiltration group (83 cases) and a low-infiltration group (298 cases) based on the optimal cutoff value (survival cutoff = 0.1453127) of their immune infiltration percentage, and this grouping result is presented in (Figure 1A). Further Kaplan-Meier curve analysis of these two groups showed that patients in the M2 macrophage high-infiltration group had worse prognosis than those in the low-infiltration group, with a statistically significant difference (p = 0.00006), and the survival analysis result
is shown in (Figure 1B).
Figure 1: Data Preprocessing A: The infiltration proportions of 22 types of immune cells in STAD samples were calculated by CIBERSORT, and the M2-type macrophage infiltration was divided into high and low groups. B: The Kaplan-Meier curve shows that the high M2 macrophage infiltration group has a poor prognosis.
Identification Results of Key M2-type Macrophage-Related Gene Modules
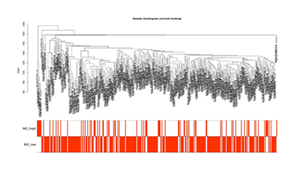
After excluding extreme samples through cluster analysis, the clustering tree of STAD samples showed a clear structure, with the M2-type macrophage high-infiltration group and low-infiltration group displaying a significant aggregation trend (Figure 2). Meanwhile, the correlation heatmap revealed distinct expression signature clusters between the two groups, confirming the existence of systematic differences in their gene expression profiles and laying a reliable foundation for subsequent co-expression module analysis.
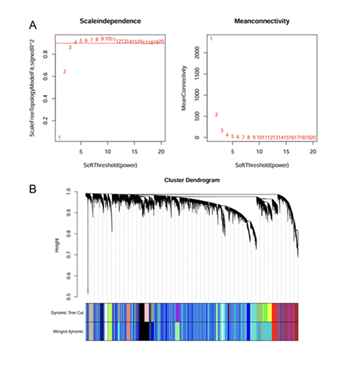
Results from the scale-free topology plot and average connectivity plot (Figure3A) indicated that when the soft threshold was set to 4, the scale-free fitting index reached 0.85 (> 0.8), which met the core requirement for constructing a scale-free network. Additionally, the average connectivity was relatively high (> 100), enabling effective retention of gene association information. These two indicators collectively verified the rationality of this soft threshold and provided key parameter support for building a robust gene co-expression network. After partitioning via the dynamic tree cutting algorithm, the gene clustering tree clearly presented the hierarchical relationships and clustering boundaries among modules (Figure 3B). The results showed that genes within each module had relatively high co-expression correlation (intramodular correlation coefficient > 0.7), while there were significant differences in expression patterns between different modules. Among these modules, three modules (blue, brown, and cyan-green) accounted for more than 60% of the total genes and exhibited potential associations with M2-type macrophage infiltration, suggesting that these modules may contain key gene sets that regulate M2-type macrophage function.
Verification Results of Co-Expressed Module Division Accuracy
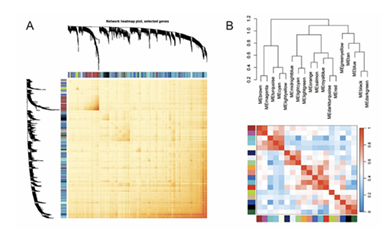
The accuracy of the division of 18 co-expressed modules can be verified through module correlation analysis. Among the results, the horizontal and vertical axes of the topological overlap adjacency heatmap (Figure 4A) both correspond to the 18 co-expressed modules, and the brightness of yellow in the heatmap directly reflects the connectivity between modules; the non-diagonal positions corresponding to different modules show pale yellow or even nearly transparent colors. This visual difference indicates that the gene connectivity within the same module is strong, while the connectivity between different modules is extremely weak, proving that the 18 co-expressed modules have high scale independence. The horizontal and vertical axes of the eigengene adjacency heatmap (Figure 4B) also correspond to the 18 modules, and a blue-red gradient color is used to represent the correlation between modules; the diagonal positions (corresponding to the same module) show the deepest red, and the color intensity gradually decreases from the diagonal to the non-diagonal positions, with most non-diagonal areas appearing light blue or nearly white. This indicates that the correlation of eigengenes within the same module is extremely high, further reflecting the strong co-expression relationship of genes within the module, while the correlation of eigengenes between different modules is extremely low, and the gene expression patterns between modules are significantly different. In conclusion, the 18 co-expressed modules not only have strong internal connectivity and high gene correlation but also weak connectivity and low correlation between modules; they are highly independent overall with no obvious overlap in expression characteristics, and the module division results have high accuracy.
Analysis of 22 Immune Cell Infiltration Proportions in STAD Samples and Association Between M2-type Macrophage Infiltration and Prognosis
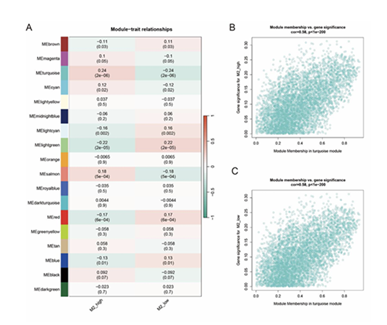
Pearson correlation coefficients and P-values between module eigengenes and clinical traits were calculated, and a module-trait correlation heatmap was generated (Figure 5A). Each cell in the heatmap displays the correlation coefficient (decimal value) and P-value (decimal value in parentheses), with red and green indicating positive and negative correlations, respectively, and the color intensity reflecting the strength of the correlation Based on the criteria of P < 0.05 and correlation coefficient, the turquoise module was identified as the key module most relevant to promoting M2-type macrophage polarization in gastric cancer. Further, GS and MM were computed for each gene within the turquoise module, followed by the generation of MM vs GS scatter plots (Figures 5B and 5C) . The plots, which present MM on the x-axis and GS on the y-axis along with the corresponding correlation coefficient and P-value, demonstrated a high correlation between MM and GS in the turquoise module.
GO and KEGG Enrichment Analysis Results of DEGs
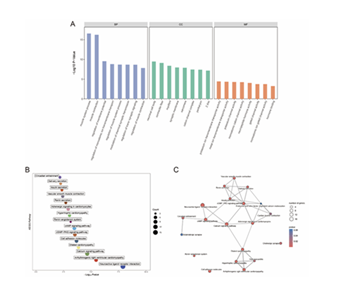
GO enrichment analysis revealed that the 160 DEGs (DEGs) were mainly enriched in the following terms across three dimensions: in the biological process dimension, they were primarily enriched in muscle system process, muscle contraction, regulation of membrane potential, regulation of monoatomic ion transmembrane transport, and regulation of muscle system process; in the molecular function dimension, they were concentrated in potassium ion transmembrane transporter activity, metal ion transmembrane transporter activity, and potassium channel activity; in the cellular component dimension, neuronal cell body was the most significantly enriched term (Figure 6A). For KEGG pathway enrichment analysis, it showed that Neuroactive ligand-receptor interaction, Arrhythmogenic right ventricular cardiomyopathy, Calcium signaling pathway, Dilated cardiomyopathy, and Cell adhesion molecules pathways were significantly associated with the core genes (Figures 6B, C).
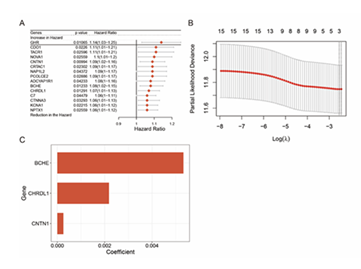
A: GO Enrichment Analysis Shows significantly enriched terms of DEGs in Biological Process (BP), Cellular Component (CC), and Molecular Function (MF) B: KEGG Enrichment Analysis Displays significantly enriched KEGG pathways of DEGs C: KEGG Enrichment Network Diagram Presents associations among enriched KEGG pathways of DEGs. First, 15 prognosis-related genes were screened from core genes via univariate Cox regression, with a forest plot generated (Figure 7A). Subsequently, a 3-gene risk prediction model was constructed using LASSO-COX regression coefficients, and its score was calculated as: (0.00532386812724696 × BCHE expression) + (0.00218294683707532 × CHRDL1 expression) + (0.000255751973354694 × CNTN1 expression) (Figures 7B, C).
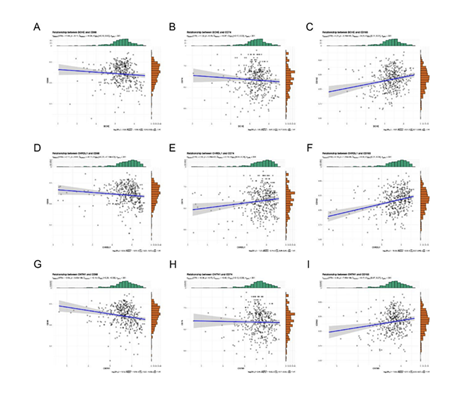
A: GO Enrichment Analysis Displays significantly enriched terms of DEGs in BP, CC, and MF.B: KEGG Enrichment Bubble PlotShows significantly enriched KEGG pathways. C: KEGG Enrichment Network Diagram Presents pathway associations. Meanwhile, correlation analysis between the 3 model genes and established M2 macrophage phenotypes (CD68, CD74, CD163) showed that BCHE, CHRDL1, and CNTN1 had a significant positive correlation with CD68, CD74, and CD163 (Figure 8).
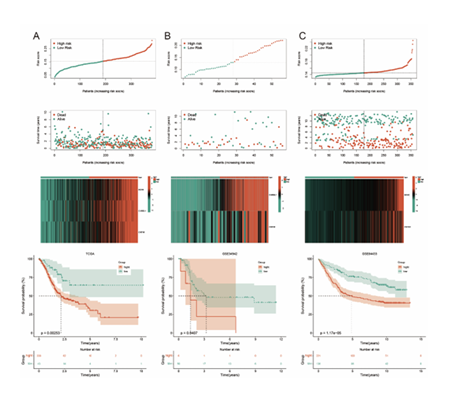
The same analysis was conducted in internal and external validation cohorts (GSE34942, GSE84433). Using the aforementioned formula, risk scores of all samples were calculated; with the median risk score of the training cohort as the optimal cut-off value, gastric cancer patients in the training cohort, GSE34942, and GSE84433 were divided into high-risk and low-risk groups. Red and blue were used in Figures 9A-C to distinguish the two groups for intuitive comparison. Scatter plots (Figures 9D-F) showed the relationship between risk scores and patients’ survival status in the three cohorts, showing a positive correlation between risk scores and deceased patients. Risk heatmaps (Figures 9G-I) analyzed the expression of the 3 model genes, confirming BCHE, CHRDL1, and CNTN1 as high-risk genes. Kaplan-Meier survival analysis of the two groups in the three cohorts generated survival curves, which showed significantly poorer prognosis in the high-risk group (P < 0.05).
Figure 9: Validation of survival curves, survival status scatter plots, gene expression heatmaps, and Kaplan-Meier curves for high- and low-risk groups in internal and external validation sets. A-C:respectively illustrate the risk score distributions, survival statuses, gene expression profiles, and Kaplan-Meier survival analyses for different datasets, demonstrating the prognostic value of the risk model.
Research Results of Nomogram for Gastric Cancer Patient Survival Rate Prediction
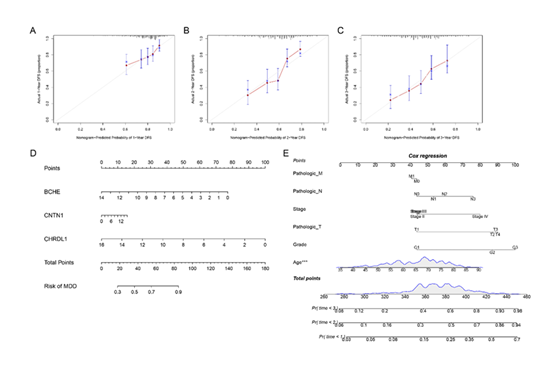
The research results showed that the nomogram constructed using the "rms" package in R software, which integrates risk scores with clinical traits such as age, gender, grade, and stage, exhibited good predictive accuracy for the 1-year, 2-year, and 3-year survival rates of gastric cancer patients. As can be seen from the precise nomograms in Figures 10A-C, the fitting degree between the actual survival rate and the predicted probability of the nomogram was relatively high, indicating a good consistency between the model's predicted values and the actual values. The nomograms in Figures 10D-E clearly showed the association between the scores corresponding to each indicator (expression levels of BCHE, CNTN1, CHRDL1, and clinical traits such as age, pathological stage, and grade), the total score, and the survival probability. By calculating the patients' clinical traits and risk scores, the 1-year, 2-year, and 3-year survival rates of patients could be predicted intuitively, which further verified the reliability of this model in predicting the survival rate of gastric cancer patients.
A-C: Calibration plots showing the agreement between predicted and actual 1-year, 2-year, and 3-year survival probabilities. D: Nomogram integrating BCHE, CNTN1, and CHRDL1 to predict patient survival risk. E: Cox regression-based nomogram incorporating pathological and clinical factors to predict survival outcomes with risk stratification.
Antitumor Drug Sensitivity Analysis in Gastric Cancer Patients with High/Low BCHE Gene Expression Risk Based on CellMiner Database
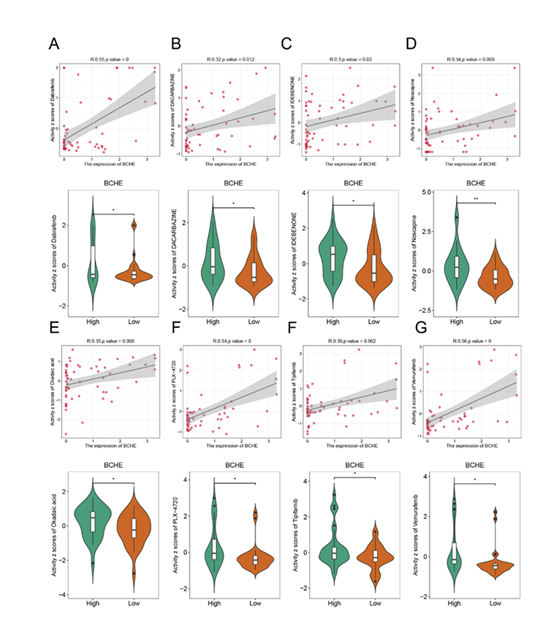
The research results showed that through the prediction and analysis of effective antitumor drugs for gastric cancer patients with high/low risk of BCHE (a key gene in the model) using the CellMiner database, the high-risk group exhibited significantly higher sensitivity to 8 drugs (dabrafenib, dacarbazine, idebenone, narcotine, okadaic acid, PLX-4720, tipifarnib, and vemurafenib) compared with the low-risk group. As observed in the scatter plots and violin plots in (Figure 11), BCHE gene expression showed a significant positive correlation with the drug activity z-scores of these 8 drugs (e.g., R=0.55, p=0 for dabrafenib; R=0.32, p=0.012 for dacarbazine). Additionally, the median drug activity z-score of the high-risk group (BCHE high-expression group) was significantly higher than that of the low-risk group (BCHE low-expression group), with a significant statistical difference (*p<0.05, **p<0.01). This result indicates that high-risk gastric cancer patients are more sensitive to the aforementioned 8 antitumor drugs, providing a potential basis for the selection of individualized drug therapy for these patients.
Figure 11: Prediction of effective antitumor drugs for high- and low-risk gastric cancer patients based on the key gene BCHE via the CellMiner database. The drugs involved in the figures are Dacarbazine (Figure A and Figure B, the same drug with different labels), Irinotecan (Figure C), Nocodazole (Figure D), Oxalic acid (Figure E, presumed to be an oxalic acid-containing drug or related metabolite), PLX-4720 (a BRAF inhibitor, Figure F), Trametinib (Figure G), and Vemurafenib (Figure H).
Discussion
The research successfully identified core genes associated with M2-type macrophage polarization in gastric cancer using Weighted Gene Co-expression Network Analysis (WGCNA), providing key insights into the regulatory mechanisms of the gastric cancer immune microenvironment. Initially, 381 STAD samples from the TCGA database were analyzed, and samples were divided into high and low M2- typemacrophage infiltration groups based on the optimal cutoff value of M2-type macrophage infiltration ratio (0.1453127). It was confirmed that patients in the high-infiltration group had significantly poorer prognosis, clarifying the pro-tumor role of M2-type macrophages in gastric cancer progression and laying a phenotypic foundation for subsequent gene screening. After constructing 18 gene co-expression modules via WGCNA, the turquoise module was further identified as the key module most relevant to M2-type macrophage polarization. Finally, 160 core genes were obtained through the intersection of DEGs. GO/KEGG enrichment analysis revealed that these genes were enriched in pathways such as muscle system regulation, ion transport, and neuroactive ligand-receptor interaction, offering new insights into the molecular mechanisms regulating M2 macrophage polarization. The constructed 3-gene (BCHE, CHRDL1, CNTN1) prognostic model and the nomogram combining clinical traits demonstrate significant clinical translational value. Validated in both the internal training set and external validation sets (GSE34942, GSE84433), this model effectively distinguishes between high-risk and low-risk gastric cancer patients, with the high-risk group showing poorer prognosis. Notably, existing literature has identified butyrylcholinesterase (BCHE) as a potential therapeutic target for GC [15].
Meanwhile, these three genes exhibit a significant positive correlation with classic phenotypic markers of M2-type macrophages (CD68, CD74, CD163) [16], directly linking their function to the regulation of M2-type macrophage polarization . Additionally, analysis using the CellMiner database indicated that high-risk patients with high BCHE expression were more sensitive to 8 drugs, including dabrafenib and vemurafenib. This not only provides a quantitative tool for prognostic assessment in gastric cancer patients but also offers potential basis for precise drug selection. Notably, this study has certain limitations that should be addressed in future research. On one hand, all data were obtained from public databases, leading to incomplete clinical information for some samples. Moreover, there is a lack of in vitro and in vivo experiments to verify the direct regulatory effect of core genes on M2-type macrophage polarization, leaving the core mechanism only at the level of bioinformatics correlation. On the other hand, drug sensitivity analysis was based on tumor cell line data, without considering the influence of patient-derived primary tumor cells and other cells in the tumor microenvironment, so the clinical applicability of the results requires further verification. In the future, cell experiments (such as core gene knockdown/overexpression), animal models, and prospective clinical sample testing can be used to further verify the function of core genes and the practicality of the model, promoting the translation of results into clinical practice.
Conclusions
This study found high M2 macrophage infiltration in gastric cancer correlates with poor patient prognosis. Via Weighted Gene Co-expression Network Analysis (WGCNA), 18 gene co-expression modules were screened, with the turquoise module identified as key. Combined with gastric cancer differential genes, 160 core genes promoting M2 polarization were obtained, enriched in muscle-related functions and pathways like neuroactive ligand-receptor interaction. The 3-gene (BCHE, CHRDL1, CNTN1) risk model effectively predicts prognosis; the nomogram integrating clinical traits accurately assesses 1-, 2-, and 3-year survival rates. Additionally, high-risk patients with high BCHE expression are more sensitive to 8 anti-tumor drugs, providing a reference for gastric cancer prognostic evaluation and precision treatment.
Declarations of Conflict of interest
No conflicts of interest are declared by the authors.
Funding
This study was supported by the funding from the National Health Commission Science and Technology Development Research Center, Major Program for Four Major Chronic Diseases (2023ZD0501500)
Consent for publication
All authors consented to the publication. No identifying images or other personal or clinical details of participants are presented that compromise anonymity.
Author Contributions
Zidong Zhao (first author) and Dandan Zhao (co-first author) were responsible for data analysis and manuscript writing. Yu Tan participated in data analysis and manuscript revision. Satoshi Endo and Yanwen Liu (corresponding authors) designed the research project, revised the manuscript, and gave final approval. All authors have read and approved the final manuscript.
References
- Smyth EC, et al. Gastric cancer. Lancet 396 (2020): 635-648.
- Sung H, et al. Global Cancer Statistics 2020: GLOBOCAN Estimates of Incidence and Mortality Worldwide for 36 Cancers in 185 Countries. CA: A Cancer Journal for Clinicians 71(2021): 209-249.
- Maconi G, G Manes, GB Porro. Role of symptoms in diagnosis and outcome of gastric cancer. World J Gastroenterol 14(2008): 1149-1155.
- Zhang XY, PY Zhang. Gastric cancer: somatic genetics as a guide to therapy. J Med Genet 54(2017): 305-312.
- Arafat Hossain M. A comprehensive review of immune checkpoint inhibitors for cancer treatment. Int Immunopharmacol 143(2024): 113-365.
- Johnson DB, et al. Immune-checkpoint inhibitors: long-term implications of toxicity. Nat Rev Clin Oncol 19 (2022): 254-267.
- Zhang L, et al., Tumor microenvironment-responsive NanoShield for precision photodynamic and photothermal synergistic cancer therapy with mitigated skin phototoxicity. Biomaterials 327 (2025): 123-740.
- Zhao X, et al. TAMs-derived exosomes promote breast cancer progression by regulating the IRF9/IFI6 axis. Breast Cancer (2025).
- Pan Y, et al. Tumor-Associated Macrophages in Tumor Immunity. Front Immunol 11 (2020): 583-584.
- Wang YN, et al. Vinblastine resets tumor-associated macrophages toward M1 phenotype and promotes antitumor immune response. J Immunother Cancer 11 (2023).
- Gunassekaran GR, et al. M1 macrophage exosomes engineered to foster M1 polarization and target the IL-4 receptor inhibit tumor growth by reprogramming tumor-associated macrophages into M1-like macrophages. Biomaterials 278 (2021): 121-137.
- Zhang A, et al. Lactate-induced M2 polarization of tumor-associated macrophages promotes the invasion of pituitary adenoma by secreting CCL17. Theranostics 11 (2021): 3839-3852.
- Bui I, B Bonavida. Polarization of M2 Tumor-Associated Macrophages (TAMs) in Cancer Immunotherapy. Crit Rev Oncog 29 (2024): 75-95.
- Liu W, et al. [Weighted gene co-expression network analysis in biomedicine research]. Sheng Wu Gong Cheng Xue Bao 33 (2017): 791-1801.
- Wang S, et al. Progressions of the correlation between lipid metabolism and immune infiltration characteristics in gastric cancer and identification of BCHE as a potential biomarker. Front Immunol 15 (2024): 1327-1565.
- Mantovani A, et al. Macrophage polarization: tumor-associated macrophages as a paradigm for polarized M2 mononuclear phagocytes. Trends Immunol 23 (2002): 549-555.

