Mathur Swati1*, Purohit Abhilasha2, Mathur Ritu3
1Department of Food Science and Nutrition, Maharshi Dayanand Saraswati University, Ajmer, India
2Junior Dietician, JIET Medical College Hospital, Jodhpur, India
*Corresponding author: Mathur Swati, Department of Food Science and Nutrition, Maharshi Dayanand Saraswati University, Ajmer, Rajasthan
Received: 08 July 2026; Accepted: 20 July 2026; Published: 30 July 2026
DOI: 10.26502/jfsnr.2642-110000194
ShareTeff is a nutrient dense grain traditionally consumed in Ethiopia. This study was an attempt to assess the acceptability of commonly consumed food products made with Teff flour. Teff flour was added to four commonly consumed food products—Bread, Crackers, Idli (a fermented steamed dish of South India), and Granola balls—at 30% and 40% levels. A panel of 30 members conducted a sensory evaluation, rating the products on a 5-point hedonic scale based on Taste, Texture, Colour, Aroma, and Appearance.
Data from the selected panelists were then compiled to calculate mean scores and standard deviation. Food products were classified as 'highly acceptable', 'acceptable', or 'not acceptable' based on data analysis. The F-value and P-value were calculated using analysis of variance (ANOVA) to determine the significant differences in the characteristics of all food product variations.
Most sensory characteristics rated Teff flour incorporation as acceptable to highly acceptable. Idli products also had positive sensory qualities, with the 30% Teff incorporation receiving the highest ratings. Statistical analysis revealed significant differences in texture, taste, and appearance between standard and Teff-incorporated products, but only minor differences between 30% and 40% Teff formulations, indicating that moderate levels of Teff flour can be used effectively.
Nutritious, Teff Flour, Sensory Evaluation, Food Products, Hedonic Scale, Acceptance
Nutritious articles; Teff Flour articles; Sensory Evaluation articles; Food Products articles; Hedonic Scale articles; Acceptance articles
Introduction
Teff is a warm-season cereal and the world's smallest grain. It is one of the underutilized crops with the potential to improve food security and crop diversity. It is nutritious and well adapted to the growing conditions in Ethiopia, but little has been invested to expand its potential to the domestic or international markets [1].
Teff is part of the Poaceae family. Its nutritional profile reveals several benefits, making it an important ingredient in foods and beverages around the world. The term "Teff" is thought to be derived from the Amharic word "Teffa," which means "lost," in reference to the grain's small size and ease of dropping and losing. It is known as the world's smallest grain. Teff grains can be ivory, light tan to deep brown, or dark reddish brown, purple, depending on the variety. Teff has a mild, nutty, and slightly molasses-like sweetness [2-4].
Teff is a versatile, nutrient-dense alternative to Wheat and Barley. Its distinct combination of low-glycemic carbohydrates, high-quality proteins, and essential micronutrients particularly Iron and Calcium addresses critical nutritional deficiencies. The grain's resistance to processing and naturally high phytochemical content make it a strong candidate for the development of functional foods to treat diabetes and iron deficiency anaemia.
Teff has the following nutritional advantages:
(1) Gluten-free: Teff grain is nutritious and naturally gluten-free, unlike other cereals such as Wheat, Barley, Rye. The increasing demand of consumers for gluten-free items has emerged to a need for the production of raw gluten-free grains. Hence, Teff flour is gluten-free flour that provides a best option for people with celiac disease and other gluten-related allergies [5].
(2) Low Glycemic index: In comparison to wheat, Teff has lower glycemic index (GI value: 74) [6], hence is suitable for Diabetic patients. Low Glycemic index reduces the release of blood glucose levels.
(3) Source of Dietary Fiber: In addition, Teff grain is considered to be a rich source of dietary fibre (5.12g/100g) compared to other cereals, due to a high bran content [7].
(4) Phytochemicals: Teff also contains beneficial phytochemicals, such as polyphenols and phytates, which contribute to its antioxidant and health promoting properties [8].
Consumers can benefit from using it in breads, pancakes, pastas, and snacks, incorporating Teff flour into food products since it promotes improved general health, especially for those who suffer from nutritional deficiencies like Osteoporosis and Anaemia [9,10].
Objectives of the study
- Value addition and enhancing the nutrient content of commonly consumed foods by incorporation of Teff flour.
- Sensory Evaluation of the food products developed by incorporation of Teff flour
Methodology
Phase 1 – Experimental work:
1.1. Selection of food items commonly and regularly consumed by people, to which Teff flour can be added.
1.2. Development of a standard recipe for the food product.
1.3. Development of value added, nutrient rich food products with incorporation of Teff flour at 30% and 40% levels in the standard recipes.
Phase 2 – Sensory evaluation of the standard food product as well as value added food products with 30% and 40% incorporation of Teff flour by a selected Panel of 30 members
2.1 Selection of panel members by Sensitivity Threshold Test
2.2 Sensory evaluation of the food products by panel members using a 5 point Hedonic scale
Phase 3 - Statistical analysis of the collected data- This was done using One way Analysis of Variance, and students t test. Other than this mean, standard deviation and percentages were also calculated.
Phase 1 – Experimental work: To create nutrient-dense versions of everyday staples, Ethiopian Teff flour was incorporated at 30% and 40% levels into four key products: Bread, Crackers, Idli, and Granola balls. These items were selected for their widespread popularity and the fact that fermentation which is essential for bread and idli helps unlock Teff's nutrients by reducing anti-nutritional factors. To ensure these "value-added" products remain consistent in quality, quantity, and taste, each was developed using a standardized recipe, a proven formula designed to yield the same high-quality results every time they were prepared.
For the ease of Sensory evaluation of food products by panel members, coding of food products was done as follows.
|
S.No. |
Code of food product |
Type of food product |
|
1 |
B1 |
Standard Bread |
|
2 |
B2 |
Bread with 30% incorporation of Teff Flour |
|
3 |
B3 |
Bread with 40% incorporation of Teff Flour |
|
4 |
C1 |
Standard Crackers |
|
5 |
C2 |
Crackers with 30% incorporation of Teff Flour |
|
6 |
C3 |
Crackers with 40% incorporation of Teff Flour |
|
7 |
I1 |
Standard Idli |
|
8 |
I2 |
Idli prepared with 30% incorporation of Teff Flour |
|
9 |
I3 |
Idli prepared with 40% incorporation of Teff Flour |
|
10 |
G1 |
Standard Granola bar |
|
11 |
G2 |
Granola bar with 30% incorporation of Teff Flour |
|
12 |
G3 |
Granola bar with 40% incorporation of Teff Flour |
Phase 2: Sensory evaluation of the standard food product as well as value added food products with 30% and 40% incorporation of Teff flour by a selected Panel of 30 members
To ensure objective results, a qualified panel of 30 members was curated through a Sensitivity Threshold Test, where candidates successfully ranked seven sugar-water dilutions by sweetness. This rigorous selection process guaranteed that the Teff-enriched products were evaluated by individuals with high sensory acuity.
- Single-Product Testing: To prevent sensory fatigue, products were served individually with dedicated scorecards.
- 5-Point Hedonic Scale: Panelists rated their experience from 1 (dislike extremely) to 5 (like extremely).
- Key Attributes: Evaluations focused on Taste, Appearance, Texture, Aroma, Colour, and Overall Acceptability.
Phase 3: Statistical analysis of the collected data
In the final phase, sensory data from the panelists was compiled to calculate mean scores and standard deviations, allowing the products to be categorized by their level of acceptability. To ensure scientific rigor, ANOVA (Analysis of Variance) was used to identify significant differences across all product variations, while t-tests provided direct, pairwise comparisons between the standard recipe and the 30% and 40% Teff-incorporated versions. This statistical framework confirms whether the nutritional "value-added" changes significantly impacted the overall quality and consumer preference.
Results and Discussion
Mean acceptability scores of the bread were as follows-
|
S. no. |
Characteristic |
B1 (Mean ± Std. Dev.) |
B2 (Mean ± Std. Dev.) |
B3 (Mean ± Std. Dev.) |
F value |
P-value |
|
1 |
Aroma |
4.03±1.08 |
3.63±0.87 |
3.76±1.09 |
1.160NS |
P>0.05 |
|
2 |
Colour |
4.76±0.42 |
4.16±0.97 |
4.43±0.84 |
4.300NS |
P>0.05 |
|
3 |
Texture |
4.5±0.72 |
3.8±0.95 |
3.7±1.07 |
6.474* |
P<0.05 |
|
4 |
Taste |
4.46±0.79 |
3.83±0.90 |
3.6±1.11 |
6.832* |
P< 0.05 |
|
5 |
Appearance |
4.7±0.69 |
3.96±0.87 |
4.23±0.67 |
7.102* |
P< 0.05 |
* Significant at 5%.
Table 1: Mean scores ± Standard deviation for sensory evaluation of bread.
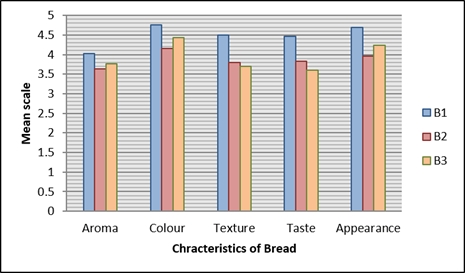
Figure 1: Comparison of mean scores for sensory evaluation of bread B1, B2 and B3.
The 5-point hedonic evaluation showed that while all samples (B1–B3) were Acceptable for aroma and taste, B1 was Highly Acceptable in colour, texture, and appearance. Significant differences (P < 0.05) were found in texture, taste, and appearance, though aroma and colour remained statistically similar (P > 0.05). Additionally, t-tests confirmed significant variations when comparing the standard bread to the 30% and 40% Teff-incorporated samples.
A comparison of B1 and B2
A significant difference was observed in colour, texture, taste, and appearance but the aroma did not differ significantly when the scores were compared of B1 and B2.
|
S. no. |
Characteristic |
t-Value |
P-value |
|
1 |
Aroma |
1.550NS |
P>0.05 |
|
2 |
Colour |
3.056* |
P<0.05 |
|
3 |
Texture |
3.175* |
P<0.05 |
|
4 |
Taste |
2.967* |
P<0.05 |
|
5 |
Appearance |
3.693* |
P<0.05 |
Table 2: Comparison of B1 and B2.
A comparison of B2 and B3
All the characteristics aroma, colour, taste, texture and appearance did not differ significantly when the scores were compared of B2 and B3.
|
S. no. |
Characteristic |
t-Value |
P-value |
|
1 |
Aroma |
-0.515NS |
P>0.05 |
|
2 |
Colour |
-1.118NS |
P>0.05 |
|
3 |
Texture |
0.377NS |
P>0.05 |
|
4 |
Taste |
0.879NS |
P>0.05 |
|
5 |
Appearance |
-1.305NS |
P>0.05 |
Table 3: Comparison of B2 and B3.
A comparison of B1 and B3
A significant difference was observed in texture, taste, and appearance but the aroma and colour did not differ significantly when the scores were compared of B3 and B1.
|
S. no. |
Characteristic |
t-Value |
P-value |
|
1 |
Aroma |
0.938NS |
P>0.05 |
|
2 |
Colour |
1.902NS |
P>0.05 |
|
3 |
Texture |
3.344* |
P<0.05 |
|
4 |
Taste |
3.522* |
P<0.05 |
|
5 |
Appearance |
2.617* |
P<0.05 |
Table 4: Comparison of B1 and B3.
Crackers
Mean acceptability scores of the cracker are as follows-
|
S. no. |
Characteristic |
C1 (Mean ± Std. Dev.) |
C2 (Mean ± Std. Dev.) |
C3 (Mean ± Std. Dev.) |
F value |
P-value |
|
1 |
Aroma |
4.7±0.53 |
4.5±0.68 |
4.43±0.72 |
1.352NS |
P>0.05 |
|
2 |
Colour |
4.9±0.30 |
4.63±0.48 |
4.53±0.62 |
4.437* |
P<0.05 |
|
3 |
Texture |
4.8±0.40 |
4.87±0.34 |
4.8±0.40 |
0.296NS |
P>0.05 |
|
4 |
Taste |
4.73±0.44 |
4.37±0.71 |
4.4±0.76 |
2.821NS |
P>0.05 |
|
5 |
Appearance |
4.77±0.42 |
4.73±0.44 |
4.66±0.47 |
0.058NS |
P>0.05 |
(* Significant at 5%)
Table 5: Mean scores ± Standard deviation for sensory evaluation of Cracker.
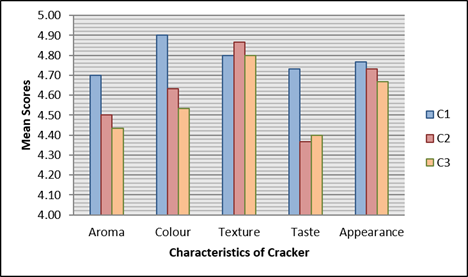
Figure 2: Comparison of mean scores for sensory evaluation of cracker C1, C2 and C3.
Based on the 5-point hedonic scale, crackers C1 and C3 were Highly Acceptable (HA) in aroma, while C2 was Acceptable (A). All samples (C1–C3) achieved HA ratings for colour, texture, and appearance; however, only C1 was HA in taste, with others rated Acceptable. Significant differences (P < 0.05) were found only in colour, as aroma, taste, texture, and appearance showed no significant variation (P > 0.05). Finally, t-tests confirmed the differences between the standard and Teff-incorporated crackers (30% and 40%).
A comparison of C1 and C2
A significant difference was observed in colour and taste but the aroma, texture and appearance did not differ significantly when the scores were compared of C1 and C2.
|
S. no. |
Characteristic |
t-Value |
P-value |
|
1 |
Aroma |
1.263NS |
P>0.05 |
|
2 |
Colour |
2.530* |
P<0.05 |
|
3 |
Texture |
-0.684NS |
P>0.05 |
|
4 |
Taste |
2.369* |
P<0.05 |
|
5 |
Appearance |
0.293NS |
P>0.05 |
Table 6: Comparison of C1 and C2 crackers.
A comparison of C2 and C3
All the characteristics aroma, colour, texture, taste and appearance did not differ significantly when the scores were compared of C2 and C3.
|
S. no. |
Characteristic |
t-Value |
P-value |
|
1 |
Aroma |
0.366NS |
P>0.05 |
|
2 |
Colour |
0.687NS |
P>0.05 |
|
3 |
Texture |
0.684NS |
P>0.05 |
|
4 |
Taste |
-0.173NS |
P>0.05 |
|
5 |
Appearance |
0.555NS |
P>0.05 |
Table 7: Comparison of C2 and C3 crackers.
A comparison of C1 and C3
A significant difference was observed in colour, taste and appearance but the aroma and texture did not differ significantly when the scores were compared of C3 and C1.
|
S. no. |
Characteristic |
t-Value |
P-value |
|
1 |
Aroma |
1.167NS |
P>0.05 |
|
2 |
Colour |
2.873* |
P<0.05 |
|
3 |
Texture |
0.000NS |
P>0.05 |
|
4 |
Taste |
2.047* |
P<0.05 |
|
5 |
Appearance |
-0.850* |
P<0.05 |
Table 8: Comparison of C1 and C3 crackers.
Idli
Mean acceptability scores of the Idli are as follows-
|
S. no. |
Characteristic |
I 1 (Mean ± Std. Dev.) |
I 2 (Mean ± Std. Dev.) |
I 3 (Mean ± Std. Dev.) |
F value |
P-value |
|
1 |
Aroma |
3.97±0.75 |
4.43±0.76 |
4.20±0.79 |
2.674NS |
P>0.05 |
|
2 |
Colour |
4.56±0.72 |
4.53±0.62 |
4.13±0.92 |
2.902NS |
P>0.05 |
|
3 |
Texture |
3.96±0.84 |
4.63±0.48 |
4.03±0.91 |
6.652* |
P<0.05 |
|
4 |
Taste |
4.30±0.86 |
4.66±0.54 |
4.26±0.77 |
2.633NS |
P>0.05 |
|
5 |
Appearance |
4.33±0.70 |
4.53±0.72 |
4.50±0.62 |
0.72NS |
P>0.05 |
(* Significant at 5%)
Table 9: Mean scores ± Standard deviation for sensory evaluation of Idli
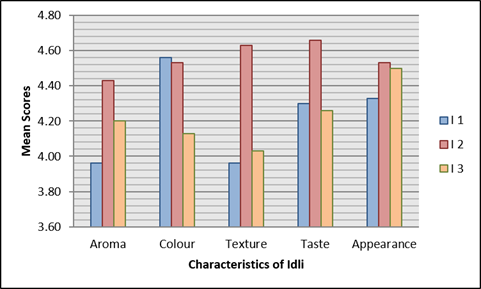
Figure 3: Comparison of mean scores for sensory evaluation of Idli I 1, I 2 and I 3.
On a 5-point hedonic scale, all idli samples (I1–I3) were rated Acceptable (A) for aroma. Sample I2 achieved Highly Acceptable (HA) ratings for colour, texture, taste, and appearance, while I3 was HA only in appearance. Statistically, a significant difference (P < 0.05) was found only in texture; no significant variation (P > 0.05) existed for aroma, colour, taste, or appearance. Finally, t-tests compared the standard idli against the 30% and 40% Teff-incorporated variations to determine significant differences between the levels.
A comparison of I 1 and I 2
A significant difference was observed in aroma, texture and taste but the colour and appearance did not differ significantly when the scores were compared of I1 and I2.
|
S. no. |
Characteristic |
t-Value |
P-value |
|
1 |
Aroma |
-2.349* |
P<0.05 |
|
2 |
Colour |
0.190NS |
P>0.05 |
|
3 |
Texture |
-3.721* |
P<0.05 |
|
4 |
Taste |
-1.943* |
P<0.05 |
|
5 |
Appearance |
-1.075NS |
P>0.05 |
Table 10: Comparison of I 1 and I 2 idli.
A comparison of I2 and I3
A significant difference was observed in colour and taste but the aroma, texture and appearance did not differ significantly when the scores were compared of I2 and I3.
|
S. no. |
Characteristic |
t-Value |
P-value |
|
1 |
Aroma |
1.144NS |
P>0.05 |
|
2 |
Colour |
1.941* |
P<0.05 |
|
3 |
Texture |
3.132NS |
P>0.05 |
|
4 |
Taste |
2.290* |
P<0.05 |
|
5 |
Appearance |
0.189NS |
P>0.05 |
Table 11: Comparison of I2 and I3 idli.
A comparison of I 1 and I 3
A significant difference was observed in colour but the aroma, texture, taste and appearance did not differ significantly when the scores were compared of I3 and I1.
|
S. no. |
Characteristic |
t-Value |
P-value |
|
1 |
Aroma |
1.151NS |
P>0.05 |
|
2 |
Colour |
-2.000* |
P<0.05 |
|
3 |
Texture |
0.290NS |
P>0.05 |
|
4 |
Taste |
-0.155NS |
P>0.05 |
|
5 |
Appearance |
0.961NS |
P>0.05 |
Table 12: Comparison of I 1 and I 3 idli.
Granola Ball
Mean acceptability scores of the Granola ball are as follows-
|
S. no. |
Characteristic |
G1 (Mean ± Std. Dev.) |
G2 (Mean ± Std. Dev.) |
G3 (Mean ± Std. Dev.) |
F value |
P-value |
|
1 |
Aroma |
4.37±0.60 |
4.70±0.53 |
4.30±0.59 |
4.054* |
P<0.05 |
|
2 |
Colour |
4.73±0.44 |
4.97±0.18 |
4.90±0.30 |
3.955* |
P<0.05 |
|
3 |
Texture |
4.77±0.56 |
4.77±0.62 |
4.30±0.82 |
4.617* |
P<0.05 |
|
4 |
Taste |
4.67±0.65 |
4.87±0.34 |
4.50±0.85 |
2.337NS |
P>0.05 |
|
5 |
Appearance |
4.77±0.50 |
4.83±0.45 |
4.67±0.54 |
0.827NS |
P>0.05 |
(* Significant at 5%)
Table 13: Mean scores ± Standard deviation for sensory evaluation of Granola Ball.
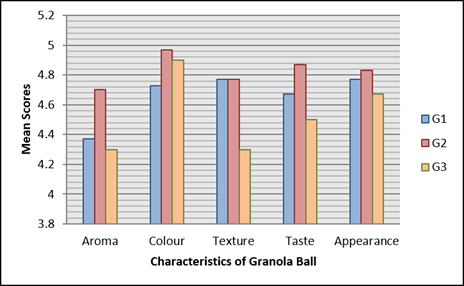
Figure 4: Comparison of mean scores for sensory evaluation of Granola ball G1, G2 and G3.
Based on the 5-point hedonic scale, G2 and G1 were rated Highly Acceptable (HA) across almost all attributes, though G1’s aroma was rated Acceptable (A). G3 achieved HA ratings for colour, taste, and appearance. Statistical analysis showed significant differences (P < 0.05) only in aroma, texture, and colour, while taste and appearance remained consistent (P > 0.05). Finally, t-tests were used to compare the standard granola balls against the 30% and 40% Teff-incorporated variations.
A comparison of G1 and G2
A significant difference was observed in aroma and colour but the texture, taste and appearance did not differ significantly when the scores were compared of G1 and G2.
|
S. no. |
Characteristic |
t-Value |
P-value |
|
1 |
Aroma |
-2.240* |
P<0.05 |
|
2 |
Colour |
-2.633* |
P<0.05 |
|
3 |
Texture |
0.000NS |
P>0.05 |
|
4 |
Taste |
-1.469NS |
P>0.05 |
|
5 |
Appearance |
-0.535NS |
P>0.05 |
Table 14: Comparison of G1 and G2 granola ball.
A comparison of G2 and G3
A significant difference was observed in aroma, texture and taste but the colour and appearance did not differ significantly when the scores were compared of G2 and G3.
|
S. no. |
Characteristic |
t-Value |
P-value |
|
1 |
Aroma |
2.736* |
P<0.05 |
|
2 |
Colour |
1.027NS |
P>0.05 |
|
3 |
Texture |
2.446* |
P<0.05 |
|
4 |
Taste |
2.164* |
P<0.05 |
|
5 |
Appearance |
1.276NS |
P>0.05 |
Table 15: Comparison of G2 and G3 granola ball.
A comparison of G1 and G3: A significant difference was observed only in texture but the aroma, colour, taste and appearance did not differ significantly when the scores were compared of G3 and G1.
|
S. no. |
Characteristic |
t-Value |
P-value |
|
1 |
Aroma |
-0.426NS |
P>0.05 |
|
2 |
Colour |
1.680NS |
P>0.05 |
|
3 |
Texture |
-2.527* |
P<0.05 |
|
4 |
Taste |
-0.841NS |
P>0.05 |
|
5 |
Appearance |
-0.737NS |
P>0.05 |
Table 16: Comparison of G1 and G3 granola ball.
Conclusion
This study investigated the nutritional enhancement and sensory appeal of incorporating Teff flour into everyday food products like bread, crackers, idli, and granola balls. By replacing a portion of standard ingredients with 30% and 40% Teff flour, researchers sought to improve the dietary profile of these items without sacrificing consumer enjoyment. Sensory panels evaluated the variations using a 5-point hedonic scale, focusing on key attributes such as taste, texture, aroma, and colour. Statistical analyses, including ANOVA and t-tests, were employed to compare the variations and determine the significance of the results.
The findings demonstrated that Teff-enriched products were largely rated as "acceptable" or "highly acceptable." Specifically, the 30% Teff bread and 40% Teff crackers stood out for their high sensory scores, although some significant differences in texture and appearance were noted compared to standard versions. The study highlights Teff’s historical success in Ethiopia—where its consumption correlates with lower rates of Anaemia, Diabetes, and Celiac disease—and suggests that its global adoption could be a powerful tool in combating malnutrition and enhancing food security.
In conclusion, Teff flour is a versatile, nutrient-dense ingredient that can be successfully integrated into modern diets to boost iron and calcium intake. While challenges in processing and global awareness remain, its adaptability to various climates and diverse food applications positions it as a potential "superfood." To fully realize Teff's potential on a global scale, future research should focus on optimizing processing techniques and expanding consumer acceptance, ultimately bridging the gap between this traditional Ethiopian staple and sustainable global nutrition.
Conflicts of interest: None
Funding agency: No funding was received
References
- Tadele E, Hibistu T. Empirical review on the use dynamics and economics of teff in Ethiopia Agri & Food Secur 40 (2021): 1-13.
- Melak-Hail Mengesha. Chemical composition of teff (Eragrostis tef) compared with that of wheat, barley and grain sorghum. Economic Botany 20 (1966): 268 273.
- Tadesse Ebba. Teff (Eragrostis tef): the cultivation, usage and some of the known diseases and insect pests. Part I. Debre Zeit Agricultural Experiment Station. Addis Ababa University, College of Agriculture, Dire Dawa, Ethiopia (1969).
- Costanza SH, Dewet JMJ, Harlan JR. Literature review and numerical taxonomy of eragrostis tef (tef). Economic botany 33 (1979): 413-424.
- Gebremariam MM, Zarnkow M, Becker T. Teff (Eragrostis tef) as a raw material for malting, brewing and manufacturing of gluten-free foods and beverages: A review J Food Sci Technol.
- Wolter A, Hager AS, Zannini E, et al. In vitro starch digestibility and predicted glycaemic indexes of buckwheat, oat, quinoa, sorghum, teff and commercial gluten-free bread. Journal of Cereal Science 58 (2013): 431-433.
- Yilmaz HO, Arslan M. Teff: Nutritional Compounds and Effects on Human Health Acta Scientific Medical Sciences 2 (2018).
- Baye K. Teff: nutrient composition and health benefits. International Food Policy Research Institute, Ethiopian Development Research Institute 1-17.
- Nascimento K, Paes S, Oliveira I, et al. Teff: Suitability for Different Food Applications and as a Raw Material of Gluten-free, a Literature Review. Journal of Food and Nutrition Research 6 (2018): 74-81.
- Seyfu Ketema. Tef. Eragrostis tef (Zucc.) Trotter. Promoting the conservation and use of underutilized and neglected crops. 12. Institute of Plant Genetics and Crop Plant Research, Gatersleben/ International Plant Genetic Resources Institute, Rome, Italy 12 (1977): 7-10.