Sherif ElSirgany1, Hesham Badawi2, Zakaria El-Khayat3, Mamdouh Bibers1, Manal Hamdy2, Ahmed Hamdy2, Sameh Salama1, Rehab Lotfy2, Mahmoud Alalfy1*
1 Department of Reproductive health and family planning, National Research Centre, Giza, Egypt
2 Department of Obstetrics & Gynecology, Cairo University, Giza, Egypt
3 Department of Medical Biochemistry Research, National Research Centre, Giza, Egypt
*Corresponding Author: Mahmoud Alalfy, Department of Reproductive Health Research, Researcher, National Research Centre, El-Buhouth Street, Dokki, PO: 12622, Giza, Egypt
Received: 11 November 2019; Accepted: 14 November 2019; Published: 02 December 2019
Objective: Fetuin-A is a glycoprotein which is present in circulation that might be linked to insulin resistance and polycystic ovary syndrome (PCOS). The aim of our study was to investigate the changes in Fetuin-A levels as a possible marker in patients with PCOS.
Methods: In this study we included a total of 80 women. Group A;40 women with PCOS represented this study group, while another 40 women with regular cycles and no symptoms of hyperandrogenemia represented the controls(Group B). Fetuin-A level was measured in both groups to compare the level of this hormone.
Results: Our results showed that Fetuin A concentration in the PCOS group was elevated than the control group (mean ± SD: 521 ± 7.1 vs 505 ± 50.5 ng/ml respectively) and the difference was statistically significant. Conclusions: Fetuin A level could be proposed as a screening test for PCOS with a cutoff value of 515 ng/ ml, the sensitivity and specificity were one hundred % and forty five %, respectively.
Fetuin-A; Polycystic ovary syndrome; Insulin resistance; HOMA IR; Fasting insulin
1. Introduction
Polycystic ovary syndrome (PCOS) (Stein Leventhal Syndrome) is one of the endocrine problems of women in childbearing period .The prevalence of PCOS varies between 6.5% to 8% using biochemical and/or clinical evidence [1, 2] however, based on ultrasound, the prevalence may reach 20% or more [3]. According to Rotterdam criteria in 2003 [11], PCOScould be diagnosed in the existence of any 2 of the following: anovulation , clinical or biochemical hyperandrogenism, an ultrasound finding of polycystic ovaries (Figure 1).
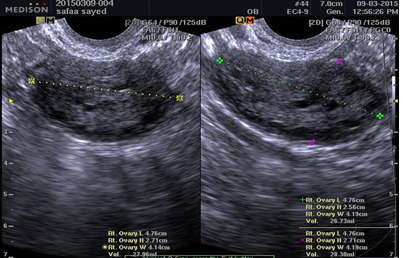
Figure 1: U/S image of polycystic ovarian syndrome.
Adding to infertility problems, women with PCOS are subjected to increased possibility for insulin resistance (IR) and in turn an increased risk for type 2 diabetes mellitus [4]. Insulin resistance can be determined by measuring insulin sensitivity either by direct infusion of IV glucose and/or insulin or indirect assessment using surrogate markers (such as fasting glucose and insulin, Homeostatic model assessment (HOMA-IR), QUICKIE mathematical models derived from oral glucose tolerance test [OGTT]). All shown to produce equivalent results [5]. The advantages of the indirect assessments are that they are less complex to perform and correlate reasonably well with the results of the more invasive direct measures. Fetuin-A is a glycoprotein derived from the liver that can suppress insulin action through insulin receptor autophosphorylation in the muscle and in the liver, thereby inhibiting insulin signaling and introducing insulin resistance in vitro [5]. It is thought that mice with Fetuin-A-deficiency are protected against obesity and insulin resistance associated with aging [7]. Different studies revealed that elevated levels of circulating Fetuin-A may be associated with insulin resistance in humans [8, 9, 10]. The exact relation between serum fetuin-A level and PCOS is conflicting in different studies. In this study, we are trying to confirm or negate this correlation.
2. Patients and Methods
In our study, we recruited 80 women who attended in Kasr Al Ainy Teaching Hospital and the National Research Centre, outpatient gynecology and infertility clinics. The ethical committee of the National Research Center endorsed their approval for the study. Forty women with PCOS represented our study group. Diagnosis of PCOS was based on Rotterdam criteria 2003) [11]. A fasting venous blood sample was collected from every woman. However, due to the erratic nature of their cycles, we were not able to standardize the day of sample collection for this group. The control group included forty women with regular menstruation and do not have any symptoms of hyperandrogenemia i.e. hirsutism, acne. Fasting venous blood samples were collected in their early follicular phase; between days 2-5 of their cycles. Women with any of the following criteria have been excluded from the study; chronic disease, i.e. diabetes, liver failure, thyroid disease, hypertension, coronary artery disease and liver or kidney disease, also if the received any hormonal therapy within the last 3 months. For all women who participated in the study the following have been measured; body mass index (BMI), fasting plasma glucose (FPG), fasting Insulin, LH, follicle stimulating hormone (FSH), free testosterone level and transvaginal ultrasound was done. Venous fasting blood samples (8ml) were collected from an antecubital vein in evacuated tubes without anticoagulant in the morning after fasting 13 hours (Vacuette, Greiner Bio-One, Austria) and were allowed to clot for 30 min and centrifuged at 3,000 rpm for 10 min at room temperature. Serum Fetuin-A level was determined by using INS-EASIA Kit R&D, USA according to the method described by Axelsson, et al., 2008. It is a commercially available enzyme-linked immunosorbent assay (ELISA) kit in accordance with the supplier’s instructions (Biovendor Laboratory, Modrice, Czech Republic). We used the Ferriman–Gallwey score system for evaluation of the hirsutism [11].
Insulin resistance was assessed using both fasting insulin levels and Homeostasis model assessment (HOMA) calculation: fasting blood sugar (mg/dl) x fasting insulin (µIU/ml) /405 [12]. Trans-vaginal ultrasound was performed using Medisone X8 ultrasound machine with a vaginal probe 7.5 MHZ. Data were statistically described in terms of mean ± standard deviation (± SD), median and range when appropriate. Comparison of numerical variables between the study groups was done using the Student t test for independent samples. Correlation between various variables was done using Pearson moment correlation equation for linear relation in normally distributed variables and Spearman rank correlation equation for non-normal variables/non-linear monotonic relation. Accuracy was represented using the terms sensitivity, and specificity. Receiver operator characteristic (ROC) analysis was used to determine the optimum cutoff value fetuin-A in diagnosing cases. P values less than 0.05 was considered statistically significant. All statistical calculations were done using computer program SPSS (Statistical Package for the Social Science; SPSS Inc., Chicago, IL, USA) release 15 for Microsoft Windows (2006).
3. Results
After analyzing our findings, we compared the demographic data, hormonal parameters and serum Fetuin-A levels between the study and control groups [Table 1]. According to our findings, the mean age of women with PCOS (31.35 ± 4.85) was less than the controls (33.2 ± 5.43), while the mean BMI was higher in the PCOS group (SD 27.04 ± 5.74). However, these differences did not show a statistical significance (p>0.005).
On comparing the LH and free testosterone levels, it was noticed that their mean levels were higher in the PCOS group than the control group(6.25 ± 2.99, 1.7 ± 0.84 versus 4.3 ± 1.7,1 ± 0.22), respectively. This difference showed to have a statistically significant value (p<0.005). The same significant difference between the two groups was found on comparing the fasting insulin, fasting glucose level and HOMA value. Their mean levels were higher in the PCOS group compared to the controls (86.2 ± 15.9,26.7 ± 6.04,5.5 ± 1.44 versus 75.5 ± 7.9,11.4 ± 2.8,2.24 ± 1.13), respectively (p<0.005). On the other hand, FSH level in PCOS group was shown to be lower than control group (5.35 ± 1.6 versus 6.5 ± 1.05), respectively (p <0.005). Our main hormone of interest,Fetuin A was found significantly higher in the PCOS group than the controls with a mean level of 521 ± 7.1 versus 505 ± 50.5 ng/ml, respectively (p<0.005).. This finding may explain our suggestion of measuring Fetuin level as a possible marker for cases with PCOS. On correlating Fetuin A level to other hormonal parameters, we found out that there was a positive correlation between Fetuin A level and LH, free testosterone and Fasting Glucose level in the PCOS group, though not statistically significant (p>0.005). This positive correlation was also shown between Fetuin A level and both Fasting Insulin and HOMA value in the same group, but with a statistically significant value (p<0.005). On the contrast, there was no correlation between FSH level and Fetuin A level in the PCOS group [Table 2]. We calculated the best cutoff value for Fetuin-A, and was found to be 515 ng/ml, with sensitivity100% and specificity 45% [graph 1].
|
Parameters |
Group B Control group (mean ± SD) |
Group A PCOS (mean ± SD) |
p value |
|
Age (years) |
33.2 ± 5.43 |
31.35 ± 4.85 |
NS |
|
BMI (kg/m2) |
24.26 ± 3.97 |
27.04 ± 5.74 |
NS |
|
LH (mIU/mL) |
4.3 ± 1.7 |
6.25 ± 2.99 |
<0.05 |
|
FSH (mIU/mL) |
6.5 ± 1.05 |
5.35 ± 1.6 |
<0.05 |
|
Free Testosterone (pg/mL) |
1 ± 0.22 |
1.7 ± 0.84 |
<0.05 |
|
FPG (mg/dL) |
75.5 ± 7.9 |
86.2 ± 15.9 |
<0.05 |
|
Fasting Insulin (IU/mL) |
11.4 ± 2.8 |
26.7 ± 6.04 |
<0.05 |
|
HOMA-IR |
2.24 ± 1.13 |
5.5 ± 1.44 |
<0.05 |
|
Fetuin-A (ng/mL) |
505 ± 50.5 |
521 ± 7.1 |
P* value significant at < 0.05 level
Table 1: Demographic and hormonal parameters and Fetuin-A levels.
|
Correlation between Fetuin A & FSH |
Correlation between Fetuin A & LH |
Correlation between Fetuin A &Free Testosterone |
Correlation between Fetuin A &FBS |
Correlation between Fetuin A &fasting insulin |
Correlation between Fetuin A & HOMA |
||||||
|
r |
P value |
r |
P value |
r |
P value |
r |
P value |
r |
P value |
r |
P value |
|
-.223 |
.167 |
.217 |
.178 |
.160 |
.324 |
.208 |
.199 |
.470 |
.002* |
.474 |
.002* |
P* value significant at < 0.05 level
Table 2: Correlation between Fetuin A and FSH, LH, Free testosterone, fasting blood sugar, fasting insulin and HOMA value in PCO group.
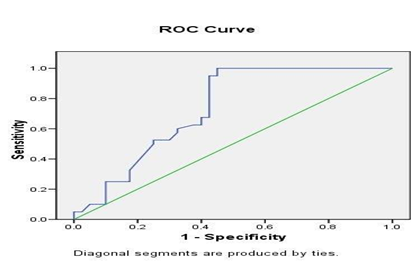
Graph 1: Cut off level of Fetuin A. ROC, Receiver Operating Curve.
4. Discussion
Rotterdam criteria, 2003 [11] is the most widely accepted criteria for diagnosis of PCOS. However, for diagnosis, we need the presence of any two of the following: clinical or biochemical hyperandrogenism , anovulation, PCO by ultrasound. In this study, we tried to investigate a single marker to screen for PCOS without the need for additional transvaginal ultrasound. We thought that Fetuin-A could be our target point of study as it is a glycoprotein derived from the liver that can suppress insulin action through insulin receptor autophosphorylation in the muscle and in the liver, thereby inhibiting insulin signaling and introducing insulin resistance. Insulin resistance is known to be present concomitantly in many cases with PCOS. According to our findings, Fetuin A level was found to be significantly higher in women with PCOS compared to controls rendering it as a possible suggested marker for PCOS. In addition, we correlated Fetuin A level to other hormones that usually measured in cases with PCOS especially those seeking fertility. Our results revealed that Fetuin-A level was not correlated with FSH in PCOS group, but correlated to LH, testosterone, fasting Glucose level. Nevertheless, this correlation was not significant. However, this correlation showed a statistical significance to fasting insulin levels and HOMAIR levels in PCOS group. In the literature, we found few studies correlating Fetuin A to PCOS. In 2012, Aghilla M, et al. [13] studied eighty-three women with PCOS and thirty-nine as controls. They used Rotterdam criteria for diagnosing PCOS. The aim of their study to determine levels of Fetuin-Ain PCOSwomen and to investigate the effect of metformin on circulating levels and hepatocyte production of Fetuin-A. They found that Fetuin-A levels were higher in PCOS women compared to controls. In addition, they found correlations between Fetuin-A level and insulin resistance in PCOS.
Another work done by Enli Y , et al. [14] studied twenty-two patients with PCOS and twenty-one controls women to detect serum Fetuin-A levels and ascertain whether serum Fetuin-A level is associated with resistance to insulin, in females with PCO. They concluded that Serum Fetuin-A level was associated with insulin resistance in ladies with PCOS. In addition, RemziAbali, et al. [15] studied, They found that fetuin-A concentrations were increased in euglycemic patients with PCOS. The previous studies came in accordance with the results of our work. However, a study done by GulhanI, et al. [16] showed a contradicting results to ours. In their study, they included 88 women (forty-four women with PCOS and forty-four healthy women as controls). Their results revealed that Fetuin-A levels did not differ signi?cantly between both groups and no correlations were found between Fetuin-A levels and insulin resistance in both groups. Due to paucity of data on Fetuin A hormone we could not find any evidence that it its level is changing throughout the menstrual cycle so we measured it only once in the early follicular phase in the controls between days 2–5 of their cycles. However, due to the erratic nature of the cycles in the PCOS group, we were not able to standardize the day of sample collection for this group. We did not find a similar study that has been done in Egypt on Fetuin A level and its possible relation to PCOS. We believe that this would be of great importance as the nature of the syndrome may differ according to ethnicity. However, we have some limitations in our study as due to the small cohort of study we were not able to divide women into two stria; lean and obese according to their BMI.
5. Conclusion
From this study, we found that FetuinA level was higher in the PCOS group compared to the controls. With a cutoff value of 515 ng/ ml, the sensitivity and specificity were 100% and 45 %, respectively. In addition, there was a positive correlation between Fetuin A level and both Fasting Insulin and HOMA value. Hereby, we may propose Fetuin A as a useful marker for PCOS with high sensitivity but low specificity. Nevertheless, our findings should be taken prudently and with caution, as the sample size was limited and we did not follow the Fetuin A throughout the cycle as no evidence showed it is changing. However, future and larger studies may show different results.
Disclosure statement
No potential conflict of interest was reported by the authors.
ORCID
Mahmoud Alalfy http://orcid.org/0000-0002-8429-6376
Author Contributions
The team of authors participated in this study in its aspects with:
- Substantial contributions to the conception or design of the work; or the acquisition, analysis, or interpretation of data for the work.
- Drafting the work or revising it critically for important intellectual content.
- Final approval of the version to be published.
- Agreement to be accountable for all aspects of the work in that question related to the accuracy or integrity of any part of the work are appropriately investigated and resolved.
References
- Asuncion M, Calvo RM, San Millan JL, Sancho J, Avila S, Escobar-Morreale HF. A prospective study of the prevalence of the polycystic ovary syndrome in unselected Caucasian women from Spain. J ClinEndocrinolMetab 85 (2000): 2434-2438.
- Azziz R, Woods KS, Reyna R, Key TJ, Knochenhauer ES, Yildiz BO. The prevalence and features of the polycystic ovary syndrome in an unselected population. J ClinEndocrinolMetab 89 (2004): 2745-2749.
- Michelmore K, Ong K, Mason S, Bennett S, Perry L, Vessey M. Clinical features in women with polycystic ovaries: relationships to insulin sensitivity, insulin gene VNTR and birth weight. ClinEndocrinol (Oxf) 55 (2001): 439-446.
- Dale William Stovall, Amelia Purser Bailey, Lisa M Pastore. Assessment of Insulin Resistance and Impaired Glucose Tolerance in Lean Women with Polycystic Ovary Syndrome. J Womens Health (Larchmt) 20 (2011): 37-43.
- Preethi BL, jaisri G, Prasanna Kumar M, Sharma R. Assessment of insulin resistance in normoglycemic young adults. Human Physiology 37 (2011): 105-112.
- Mathews ST, Chellam N, Srinivas PR, Cintron VJ, Leon MA,Goustin AS, et al. Alpha2-hsg, a specific inhibitor of insulin receptor autophosphorylation, interacts with the insulin receptor. Mol Cell Endocrinol; 164 (2000): 87-98.
- Mathews ST, Singh GP, Ranalletta M, Cintron VJ, Qiang X, Goustin AS, et al. Improved insulin sensitivity and resistance to weight gain in mice null for the ahsg gene. Diabetes 51 (2002): 2450-2458.
- Ishibashi A, Ikeda Y, Ohguro T, Kumon Y, Yamanaka S, Takata H, et al. Serum Fetuin-A is an independent marker of insulin resistance in Japanese men. J AtherosclerThromb 17 (2010): 925-933.
- Ou HY, Yang YC, Wu HT, Wu JS, Lu FH, Chang CJ. Serum Fetuin-A concentrations are elevated in subjects with impaired glucose tolerance and newly diagnosed type 2 diabetes. ClinEndocrinol (Oxf) 75 (2011): 450-455.
- Lorant DP, Grujicic M, Hoebaus C, Brix JM, Hoellerl F, Schernthaner G, et al. Fetuin-A levels are increased in patients with type 2 diabetes and peripheral arterial disease. Diabet Care 34 (2010): 156-161.
- Rotterdam ESHRE/ASRM-Sponsored PCOS Consensus Workshop Group. Revised 2003 consensus on diagnostic criteria and long-term health risks related to polycystic ovary syndrome. FertilSteril 81 (2004): 19-25.
- Matthews DR, Hosker JP, Rudenski AS, Naylor BA, Treacher DF, Turner RC. Homeostasis model assessment: insulin resistance and beta-cell function from fasting plasma glucose and insulin concentrations in man. Diabetologia 28 (1985): 412-419.
- AghillaMohamed, Adya Raghu, Tan Bee, LehnertHendrik, AshaweshKhaled, RandevaHarpal. The HepatokineFetuin-A is increased in PCOS women. Association with metabolic syndrome and regulation by metformin. Endocrine Abstracts 28 (2012): 167.
- Enli Y, Fenkci SM, Fenkci V, Oztekin O. Serum Fetuin-A levels, insulin resistance and oxidative stress in women with polycystic ovary syndrome. GynecolEndocrinol (2013).
- RemziAbali, CemCelik, NicelTasdemir, SavasGuzel, SerefAlpsoy, AytacYuksel, et al. The serum protein α2-Heremans-Schmid glycoprotein/fetuin-a concentration and carotid intima-media thickness in women with polycystic ovary syndrome. European Journal of Obstetrics & Gynecology and Reproductive Biology 169 (2013): 45-49.
- Gulhan I, Bozkaya G, Oztekin D, Uyar I, Kebapcilar A, Pamuk B. Serum Fetuin-A levels in women with polycystic ovary syndrome. Arch Gynecol Obstet. 286 (2012): 1473-1476.