Michael N. Megafu1*, Justin M. Hajicek1, Travis H. Rushton1, Chase B. Barnwell1, Keaton A. Taber1, Bailey C. Hasken1, Anthony Vicini1, Robert L. Parisien2
1A.T. Still University Kirksville College of Osteopathic Medicine, Kirksville, MO, USA
2Ichan School of Medicine, Department of Orthopedic Surgery, New York, NY, USA
*Corresponding Author: Michael Megafu, A.T. Still University Kirksville College of Osteopathic Medicine, Kirksville, MO, USA.
Received: 06 December 2023; Accepted: 22 December 2023; Published: 28 December 2023
Background: Randomized controlled trials (RCTs) play a significant role in guiding treatment decisions and addressing concerns surrounding ASI management. The importance of data derived from RCTs is often evaluated by the use of a P value. The purpose of this study was to analyze the statistical stability of RCTs evaluating the surgical management of anterior shoulder instability using arthroscopic Bankart repair (ABR) vs. open Bankart repair (OBR) and calculate the fragility index (FI) and fragility quotient (FQ).
Methods: Using PRISMA (Preferred Reporting Items for Systematic Reviews and Meta-Analyses) guidelines, PubMed, Embase, and MEDLINE were queried for RCTs examining ASI literature reporting dichotomous outcomes from 2000 to 2023. The FI is defined as the number of outcome reversals required to alter statistical significance for any outcome. The FQ was determined by dividing the FI by the sample size of each study. The interquartile range (IQR) was calculated for each outcome.
Results: Out of 103 total studies, an overall FI, incorporating all 99 outcomes across 18 RCTs was 4 (IQR 2-7) and the overall FQ was 0.073 (IQR 0.060-0.100). Of the 18 RCTs, 12 RCTs (66.7%) reported an LTF greater than or equal to the overall FI of 4.
Conclusions: The statistical findings in ASI management are fragile and should be interpreted with caution. We recommend standardized reporting of P values with FI and FQ metrics to allow effective interpretation of ASI literature.
Bankart repair; Anterior shoulder instability; Fragility index; Statistical fragility
Level of Evidence: I
Introduction
Anterior Shoulder Instability (ASI) is a frequently encountered issue in clinical practice with a reported incidence ranging from 8 to 25 per 100,00 person-years and affecting 2% of the general population [1,2]. Since the articular surface of the glenohumeral joint faces the anteroinferior side and the anterior joint capsule is weaker, ASI is the most common joint instability, contributing to 90% of total instability [3]. Despite the prevalence of ASI, there are several controversies regarding the management of ASI, especially concerning high-performance athletes, those experiencing recurrent instability, and individuals with significant glenohumeral bone loss and other related abnormalities [4,5]. Although conservative management can be used for ASI treatment, especially first-time shoulder dislocation, there is a lack of consensus among the best choice of action between operative and nonoperative management. However, surgical management has emerged as the optimal treatment with modalities like Arthroscopic Bankart Repair (ABR), open Bankart Repair (OBR), or the Latarjet procedure [6]. In recent years, with the development of arthroscopic instruments and surgical techniques, ABR has become the main method of treatment for most shoulder dislocations, achieving an equivalent or better reconstruction, and significantly fewer complications than OBR [3,7,8]. Despite these management options, the selection of these techniques for optimal management is guided by evidence-based medicine.
Randomized controlled trials (RCTs) play a significant role in guiding treatment decisions and addressing concerns surrounding ASI management. The importance of data derived from RCTs is often evaluated by the use of a P value. The P value is selected with an arbitrary alpha threshold, usually 0.05, with little consideration of a variety of factors, such as sample size, effect size, data spread, loss to follow-up (LTF), and lack of concern for the clinical significance of a statistically significant difference [9]. To address these limitations, Feinstein et al. implemented the fragility index (FI) as a tool to evaluate the statistical robustness of RCTs which is calculated as the number of outcome event reversals necessary to convert an outcome event from significant to nonsignificant or vice-versa [10]. In 2014, Walsh et al. utilized the FI to evaluate RCTs and were the first to report this tool [11]. The inclusion of the FI can enhance the information portrayed by P values but exists independent of sample size and is similarly limited. Ahmed et al. [12] introduced the fragility quotient (FQ) to address the sample size independence that the FI has; the FQ is calculated by dividing the fragility index by the sample size and represents the percentage of reversals required to alter statistical significance [10,12]. By incorporating the FI and FQ alongside the P value, a more comprehensive interpretation of the study can be achieved, improving the understanding and insight into the study’s robustness.
The purpose of this study was to analyze the statistical stability of RCTs evaluating the surgical management of ASI with ABR or OBR and calculate the FI and FQ. This study also explores a subgroup analysis and calculates the proportion of outcome events where the FI was less than the number of patients lost to follow-up. The primary hypothesis suggests that the findings of these studies will be vulnerable to a small number of outcome event reversals. The secondary hypothesis is that statistically significant findings will exemplify significant statistical fragility.
2. Methods
2.1 Search Strategy
This systematic review followed the Preferred Reporting Items for Systematic Reviews and Meta-Analyses (PRISMA) guidelines (Figure 1). The goal of the search was to identify articles examining ASI comparing ABR to OBR. Relevant literature searches were performed via PubMed, Embase, and MEDLINE databases from 2000 to 2023 using the following search terms: ((anterior shoulder instability OR glenohumeral instability) AND (Bankart repair)). No filters were applied to maximize our search strategy.
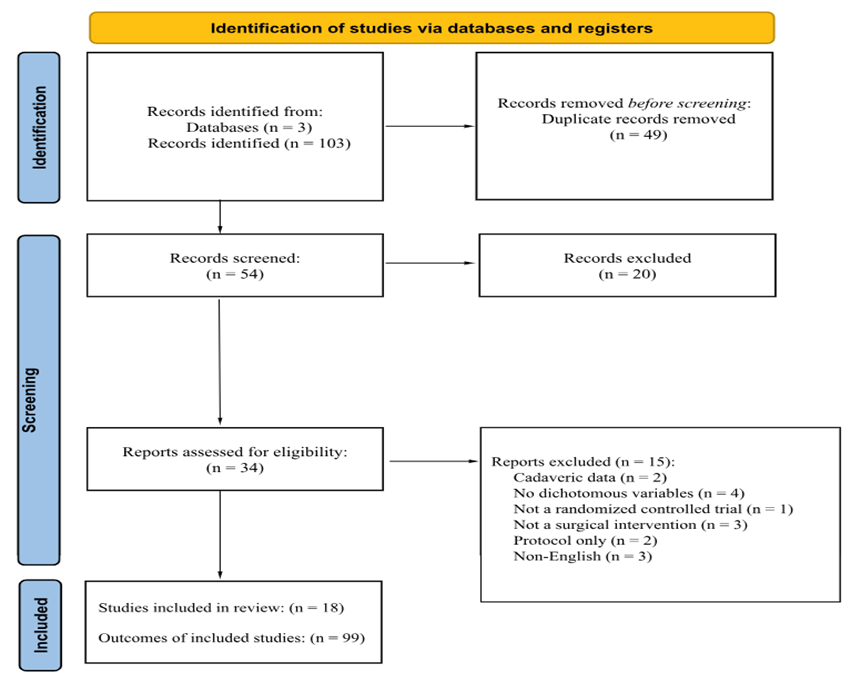
Figure 1: Study identification diagram.
2.2 Inclusion and Exclusion Criteria
Three independent authors (JMH, THR, CBB) screened each search result to determine if it met the inclusion and exclusion criteria. Each article was then examined, and studies were included if they met the following criteria: (1) RCT; (2) published in the English language; (3) surgical intervention comparing patients utilizing ABR or OBR in 1:1 treatment allocation; (4) dichotomous outcomes; and (5) published in a peer-reviewed journal. The studies were excluded if the following criteria were met: (1) studies utilized no OBR and ABR comparison; (2) more than two treatment groups; (3) did not utilize a surgical intervention; (4) cadaveric, in vitro, animal studies; (5) used population databases, national registries or cross-sectional data; and (6) reported non-dichotomous outcomes.
2.3 Risk of Bias Assessment
Two authors (KAT, BCH) independently evaluated each study, and the Bias assessment was performed utilizing the revised Cochrane Risk of Bias tool for evaluating bias in randomized trials.13 Five domains were utilized to assess bias risk: risk of bias arising from the randomization process (domain 1), risk of bias due to deviations from the intended interventions (domain 2), risk of bias due to missing outcome data (domain 3), risk of bias in the measurement of the outcome (domain 4), risk of bias in the selection of reported result (domain 5), and overall risk bias. A series of Cochrane signaling questions were applied to each article and a score was provided via the Cochrane algorithm, with each category scored as having a risk of bias that was low, high, or unclear. Any conflicts or issues were resolved by a review of the article and another author (AV) made the final decision. The Risk of Bias assessment can be seen in Table 1.
|
Domain 1: Risk of Bias Arising from Randomization Process |
Domain 2: Risk of bias due to deviations from the intended interventions |
Domain 3: Risk of Bias Due to Missing Outcome Data |
Domain 4: Risk of bias in measurement of the outcome |
Domain 5: Risk of bias in selection of the reported result |
Overall Risk of Bias |
|
|
MacDonald et al. [1] |
Low Risk |
Low Risk |
Low Risk |
Low Risk |
Low Risk |
Low Risk |
|
Minkus et al. [34] |
Low Risk |
Low Risk |
Low Risk |
Unclear |
Unclear |
Low Risk |
|
Pougès et al. [35] |
Low Risk |
Low Risk |
Low Risk |
Low Risk |
Low Risk |
Low Risk |
|
Bottoni et al. [36] |
Low Risk |
Low Risk |
Low Risk |
Low Risk |
Low Risk |
Low Risk |
|
Moroder et al. [37] |
Low Risk |
Low Risk |
Low Risk |
Unclear |
Low Risk |
Low Risk |
|
Mohtadi et al. [38] |
Low Risk |
Low Risk |
Low Risk |
Low Risk |
Low Risk |
Low Risk |
|
Archetti Netto et al. [39] |
Low Risk |
Low Risk |
Low Risk |
Unclear |
Low Risk |
Low Risk |
|
Bottoni et al. [40] |
Low Risk |
Low Risk |
Low Risk |
Low Risk |
Low Risk |
Low Risk |
|
Monteiro et al. [41] |
Low Risk |
Unclear |
Low Risk |
Low Risk |
Low Risk |
Low Risk |
|
Yapp et al. [42] |
Low Risk |
Low Risk |
Low Risk |
Unclear |
Low Risk |
Low Risk |
|
Robinson et al. [43] |
Low Risk |
Low Risk |
Low Risk |
Low Risk |
Low Risk |
Low Risk |
|
Jakobsen et al. [44] |
Low Risk |
Low Risk |
Low Risk |
Low Risk |
Low Risk |
Low Risk |
|
Hiemstra et al. [45] |
Low Risk |
Low Risk |
Low Risk |
Low Risk |
Low Risk |
Low Risk |
|
Tan et al. [46] |
Low Risk |
Low Risk |
Low Risk |
Low Risk |
Low Risk |
Low Risk |
|
Kirkley et al. [47] |
Low Risk |
Low Risk |
Low Risk |
Low Risk |
Low Risk |
Low Risk |
|
Rhee et al. [48] |
Low Risk |
Low Risk |
Low Risk |
Low Risk |
Low Risk |
Low Risk |
|
Sperber et al. [49] |
Unclear |
Low Risk |
Low Risk |
Low Risk |
Low Risk |
Low Risk |
|
Bottoni et al. [50] |
Unclear |
Low Risk |
Low Risk |
Low Risk |
Low Risk |
Low Risk |
Table 1: Bias assessment using the Revised Cochrane risk-of-bias tool for randomized trials.
2.4 Data Analysis
Multiple data points were recorded for each dichotomous outcome in a study: first author, PMID, journal title, year of publication, RCT, primary or secondary outcome measure, intervention, loss to follow-up, and P value. Outcomes were considered primary if they were explicitly stated as such or if they were reported within the abstract unless otherwise specified; all other outcomes were considered secondary. The reported P value was verified for accuracy using the 2-tailed Fisher exact test. Fragility analysis was performed by manipulating the reported outcome until a significant reversal was achieved. A P value of less than 0.05 was considered statistically significant. For outcomes with a P value of less than 0.05 number of events required to raise the above significance was determined and for studies where outcomes with a P value above 0.05 number of events required to lower the P value below 0.05 was calculated. The number of events needed to reverse the outcome was considered as the fragility index (FI) for the outcome (Table 2).
|
Outcome A |
Outcome B |
P Value |
|
|
Scenario 1 |
|||
|
Treatment A |
6 |
33 |
|
|
Treatment B |
15 |
40 |
0.041 |
|
Scenario 2 |
|||
|
Treatment A |
7 |
32 |
|
|
Treatment B |
15 |
40 |
0.078 |
Table 2: Demonstration of Reversal Significance with a Fragility of 1.
This was applied to each outcome event identified in the search and a median FI was calculated. The fragility quotient (FQ) of each outcome was calculated by dividing FI by the total sample size of each study and the median FQ was calculated. Interquartile ranges (IQR) ranges for both FI and FQ were calculated. The IQR was the difference between the 75th and the 25th percentiles. Fragility analysis was performed on the following subgroups: (1) primary versus secondary outcomes, (2) complications, radiographic findings, and reoperations/revisions, (3) significant vs non-significant outcomes (4) outcomes for which the FI was less than the number of patients lost to follow-up versus outcomes which the FI was greater than the number of patients lost to follow-up and (5) studies published from 2000-2008, 2009- 2013, 2014-2018, and 2019-2023 (Table 3).
|
Characteristic |
Outcome Events |
Fragility Index (IQR) |
Fragility Quotient (IQR) |
|
All trials |
99 |
4 (2-7) |
0.073 (0.060-0.100) |
|
Outcome type |
|||
|
Primary |
64 |
3 (2-5) |
0.058 (0.041-0.079) |
|
Secondary |
35 |
5 (3-6) |
0.041 (0.033-0.096) |
|
Complications |
50 |
3 (2.5-5) |
0.067 (0.045-0.073) |
|
Radiographic Findings |
25 |
5 (4-6) |
0.047 (0.030-0.060) |
|
Revisions/Reoperations |
20 |
5 (3-8) |
0.048 (0.037-0.071) |
|
Outcome significanceb |
|||
|
P < 0.05 |
48 |
2 (1-4) |
0.071 (0.060-0.103) |
|
P > 0.05 |
51 |
5 (4-7) |
0.076 (0.060-0.099) |
|
Comparing outcome FI to LTFc |
|||
|
FI < LTF |
68 |
5 (4-8) |
0.046 (0.032-0.059) |
|
FI > LTF |
31 |
7 (5-9) |
0.071 (0.060-0.099) |
|
Year of publication |
|||
|
2000 – 2008 |
14 |
4 (2-6) |
0.070 (0.058-0.097) |
|
2009 – 2013 |
20 |
8 (5-9.5) |
0.051 (0.035-0.064) |
|
2014 – 2018 |
23 |
6 (4-8) |
0.059 (0.041-0.077) |
|
2019 – 2023 |
42 |
5 (4-6) |
0.045 (0.030-0.091) |
|
aFI, fragility index; IQR, interquartile range; LTF, lost to follow-up. |
|||
Table 3: Overall Fragility Data and Subgroups Analysisa
3. Results
The initial search resulted in a total of 103 studies screened and produced 49 duplicated studies. The remaining 54 studies were screened using the exclusion criteria. Our inclusion criteria were then applied to the remaining 34 studies for eligibility. Overall, 18 RCTs met the inclusion criteria and were included in the analysis (Figure 1). The overall FI, incorporating all 99 outcomes across 18 RCTs was 4 (IQR 2-7) and the overall FQ was 0.073 (IQR 0.060-0.100), indicating a reversal of 6 outcomes can change the significance of an RCT. Of the 18 RCTs, 12 RCTs (66.7%) reported an LTF greater than or equal to the overall FI of 4. There were a total of 99 outcome events with 48 significant (p < 0.05) outcomes and 51 with nonsignificant (p > 0.05) outcomes. For the 48 outcomes that were reported as significant, the median number of events required to change significance was 2 (IQR 1-4) (Table 3). The FQ for significant outcomes was 0.071 (IQR 0.060-0.103). For the 51 outcomes that were reported as nonsignificant, the number of events required to change significance was 5 (IQR 4-7). The FQ for nonsignificant outcomes was 0.076 (IQR 0.060-0.099). Of the 99 total outcomes, 64 (64.6%) were primary and 35 (35.4%) were secondary. The FI for primary and secondary outcomes were 3 (IQR 2-5) and 5 (IQR 3-6), respectively. The associated FQ for primary and secondary outcomes had values of 0.058 (IQR 0.041-0.079) and 0.041 (IQR 0.033-0.096), respectively. For the 68 outcomes where FI < LTF, the median FI was found to be 5 (IQR 4-8). For the 31 outcomes where FI > LTF, the median FI was found to be 7 (IQR 5-9). The associated median FQs for outcomes that had an FI < LTF and FI > LTF were 0.046 (IQR 0.032-0.059) and 0.071 (IQR 0.060-0.099), respectively. Fragility subanalysis per year of publication identified a FI of 4 (IQR 2-6) from 2000 to 2008, a FI of 8 (IQR 5-9.5) from 2009 to 2013, a FI of 6 (IQR 4-8) from 2014 to 2018 and a FI of 5 (IQR 4-6), demonstrating decreasing statistical stability over the 22 years (Table 3).
4. Discussion
In the current assessment of RCTs examining ASI utilizing ABR versus OBR, the overall median FI was 4 and the associated median FQ was 0.073. An FI of 4 indicates that reversing just 4 patient outcome events would be enough to alter the significance of the results. Considering the sample size, an FQ of 0.073 means that, on average, approximately 7 out of 100 patients would need to experience a different outcome to change the significance across the 99 total outcomes. Out of the 99 total outcomes in this study, 66.7% (12) presented a loss to follow-up value greater than or equal to the overall FI, suggesting that maintaining complete follow-up could have potentially reversed the significance. When examining statistically significant findings, an FI of 4 was found, indicating fragility in the ASI literature evaluating OBR vs ABR. This low median FI and FQ demonstrate that the ASI literature may be more fragile than previously recognized. Therefore, this study contributes to the increasing body of evidence supporting the inclusion of FI and FQ in RCTs that inform clinical decision-making.
Our study focused on evaluating ASI management with OBR vs. ABR and revealed that the FI of significant and nonsignificant outcomes was only 2 and 5 respectively. This demonstrates that statistically significant results in the ASI literature are more fragile than nonsignificant findings [13]. These findings align with previous studies in the orthopedic literature that have examined significance and fragility [14-32]. When considering the broader orthopedic subspecialties and various pathologies, the median FI for significant outcomes ranged from 2.5 to 4, with an overall median FI of 4. These pathologies included shoulder arthroplasty [30], hip arthroplasty [31], hip arthroscopy [28], orbital fractures [16,31], patellofemoral instability [21], femur fractures [17,21], Achilles tendon rupture [22,23], radius fractures [18], rotator cuff repairs [22], biceps tendon repairs [14] and fibula fractures [15,18]. The subspecialties covered spine surgery [32], shoulder and sports medicine [20,26], and trauma [29]. This poses a risk in interpreting statistically significant results as they guide clinical decision-making. Hence, the fragility index across the orthopedic literature consistently reflects the findings of this study, indicating potential fragility in RCTs guiding clinical decisions related to ASI.
This study is the first to analyze fragility across the literature on ASI management using OBR vs. ABR with subgroup analysis by outcome type and has several strengths that support its findings. The study strictly focused on RCTs, which helps minimize bias and confounding factors often present in non-RCTs. It followed the PRISMA guidelines to ensure the inclusion of outcomes from ASI RCTs such as radiographic findings, complications, revisions/reoperations, and significant and nonsignificant P values. This approach enhances the robustness and validity of the findings, making the application of the FI and FQ more generalizable. Additionally, a comprehensive two-directional fragility analysis was employed, calculating the FI for the ASI literature over the past two decades.
The primary goal of conducting evidence-based medicine research is to enhance our knowledge base and the quality of clinical care. Information on specific treatment regimens and patient outcomes enables physicians to engage in shared decision-making using objective data. For these significant findings to guide appropriate clinical management, they must be accessible and understandable. While statistical methods like P value analysis have provided some interpretation, they do not account for effect size, loss to follow-up data, or sample size, and are influenced by study designs [26]. Consequently, statistical findings can be fragile and lead to unintentional type I (alpha) errors. Therefore, relying solely on P values is inadequate; it should be supplemented by considering effect size, study design, and methodological integrity when interpreting evidence. The American Academy of Orthopedic Surgeons (AAOS) considers an FI of 2 as "strong evidence" supporting reported findings [33]. However, analyses throughout the orthopedic literature consistently demonstrate fragility, with many authors reporting similar fragile FI and FQ values as the overall median FI of 5 in this study [14-32]. As this research area is novel, there are currently no established thresholds for optimal FI and FQ in studies. Introducing additional statistical tools such as the minimal clinically important difference (MCID), substantial clinical benefit (SCB), maximal outcome improvement (MOI), and patient-acceptable symptomatic state (PASS) could potentially bridge these data points and provide recommended FI and FQ thresholds for statistically significant outcomes. By incorporating such tools and adopting recommended FI and FQ values, the process of conducting RCTs in other orthopedic subspecialties can be standardized, and clinicians can gain a more comprehensive overview of the data. However, implementing these recommendations and standardizations will require time. Therefore, at present, including FI and FQ in the analysis of fragility in RCTs can serve as a solid foundation for providing clinicians with a more accurate and comprehensive understanding of the trial significance and reported significant outcomes.
Our fragility analysis was limited as this review was centered on ASI management comparing OBR and ABR. Additionally, the FI and FQ metrics are only able to be utilized for dichotomous, categorical outcomes. While the RCTs reported continuous outcomes such as clinical scores, these outcomes were not able to be included in fragility analysis if they were not dichotomous and categorical. Lastly, there have not been any standardized FI and FQ thresholds established to assess the stability of outcomes reported in comparative trials. Establishing such thresholds for the FI and FQ indices will allow for an improved assessment of the robustness of study findings.
5. Conclusion
Our systematic review demonstrates that the statistical findings reported across RCTs in the ASI literature are fragile and should be interpreted with caution. The reversal of just 2 statistically significant events, 5 non-significant events, or simply maintaining postoperative follow-up in 66.7% of outcomes is sufficient to alter the statistical significance of study findings from the RCTs included in our analysis. Therefore, we recommend the standardized reporting of P values with FI and FQ metrics to ensure that clinicians can effectively evaluate the statistical stability of study findings and ensure evidence-based surgical decision-making.
Conflicting interests: RLP reports a relationship with the American Orthopaedic Society for Sports Medicine that includes: board membership. RLP reports a relationship with the American Orthopaedic Society for Sports Medicine that includes: non-financial support. RLP reports a relationship with the Arthroscopy Association of North America that includes: non-financial support. RLP reports a relationship with The Society of Military Orthopaedic Surgeons that includes: non-financial support. RLP reports a relationship with the Journal of Cartilage & Joint Preservation that includes: non-financial support. RLP reports a relationship with Arthroscopy that includes: board membership. RLP reports a relationship with Arthroscopy, Sports Medicine, and Rehabilitation that includes: board membership. RLP reports a relationship with the Journal of Sport Rehabilitation that includes: board membership. RLP reports a relationship with Arthrex Inc. that includes: funding grants.
Funding:
This research received no specific grant from any funding agency in the public, commercial, or not-for-profit sectors.
Informed consent: Not applicable
Ethical approval: Not applicable
Guarantor: Not applicable
Contributorship: MNM and RLP researched literature and conceived the study. JMH, THR, CBB, KAT, BCH, and AV were involved in protocol development, gaining ethical approval, patient recruitment, and data analysis. MNM wrote the first draft of the manuscript. All authors reviewed and edited the manuscript and approved the final version of the manuscript.
Acknowledgments:
None
References
- MacDonald P, McRae S, Old J, et al. Arthroscopic Bankart repair with and without arthroscopic infraspinatus remplissage in anterior shoulder instability with a Hill-Sachs defect: a randomized controlled trial. J Shoulder Elbow Surg 30 (2021): 1288-1298.
- Nordqvist A, Petersson CJ. Incidence and causes of shoulder girdle injuries in an urban population. J Shoulder Elbow Surg 4 (1995): 107-112.
- Zhang M, Yang Z, Zhang B, et al. Treatment of anterior shoulder instability: a bibliometric analysis. J Orthop Surg Res 17 (2022): 23.
- Owens BD, Agel J, Mountcastle SB, et al. Incidence of glenohumeral instability in collegiate athletics. Am J Sports Med 37 (2009): 1750-1754.
- Zacchilli MA, Owens BD. Epidemiology of shoulder dislocations presenting to emergency departments in the United States. J Bone Joint Surg Am 92 (2010): 542-549.
- Hurley ET, Matache BA, Wong I, et al. Anterior Shoulder Instability Part I-Diagnosis, Nonoperative Management, and Bankart Repair-An International Consensus Statement. Arthroscopy 38 (2022): 214-223.e7.
- Chen L, Xu Z, Peng J, et al. Effectiveness and safety of arthroscopic versus open Bankart repair for recurrent anterior shoulder dislocation: a meta-analysis of clinical trial data. Arch Orthop Trauma Surg 135 (2015): 529-538.
- Adam M, Attia AK, Alhammoud A, et al. Arthroscopic Bankart repair for the acute anterior shoulder dislocation: systematic review and meta-analysis. Int Orthop 42 (2018): 2413-2422.
- Infanger D, Schmidt-Trucksäss A. P value functions: An underused method to present research results and to promote quantitative reasoning. Stat Med 38 (2019): 4189-4197.
- Feinstein AR. The unit fragility index: an additional appraisal of ‘statistical significance’ for a contrast of two proportions. J Clin Epidemiol 43 (1990): 201-209.
- Walsh M, Srinathan SK, McAuley DF, et al. The statistical significance of randomized controlled trial results is frequently fragile: a case for a Fragility Index. J Clin Epidemiol 67 (2014): 622-628.
- Ahmed W, Fowler RA, McCredie VA. Does Sample Size Matter When Interpreting the Fragility Index? Critical care medicine 44 (2016): e1142-e1143.
- Sterne JAC, Savovic J, Page MJ, et al. RoB 2: a revised tool for assessing risk of bias in randomised trials. BMJ 366 (2019): l4898.
- Megafu MN, Mian HS, Hassan MM, et al. The Fragility of Statistical Findings in Distal Biceps Tendon Repairs: a Systematic Review of Randomized Controlled Trials. J Shoulder Elbow Surg. Epub ahead of print (2023).
- Mian H, Megafu M, Megafu E, et al. The statistical fragility of the distal fibula fracture literature: A systematic review of randomized controlled trials. Injury. Epub ahead of print (2023).
- Megafu MN, Megafu EC, Nguyen JT, et al. The Statistical Fragility of Orbital Fractures: A Systematic Review of Randomized Controlled Trials. J Oral Maxillofac Surg 81 (2023): 752-758.
- Megafu M, Mian H, Megafu E, et al. The fragility of statistical significance in distal femur fractures: systematic review of randomized controlled trials. Eur J Orthop Surg Traumatol. Epub ahead of print (2022).
- Megafu M, Megafu E. The Fragility of Statistical Findings in Distal Radius Fractures: A Systematic Review of Randomized Controlled Trials. Injury 53 (2022): 3352-3356.
- Fackler NP, Karasavvidis T, Ehlers CB, et al. The Statistical Fragility of Operative vs Nonoperative Management for Achilles Tendon Rupture: A Systematic Review of Comparative Studies. Foot Ankle Int 43 (2022): 1331-1339.
- Parisien RL, Trofa DP, Cronin PK, et al. Comparative Studies in the Shoulder Literature Lack Statistical Robustness: A Fragility Analysis. Sports Med Arthrosc Rehabil Ther Technol 3 (2021): e1899-e1904.
- Constant M, Trofa DP, Saltzman BM, et al. The Fragility of Statistical Significance in Patellofemoral Instability Research: A Systematic Review. Am J Sports Med 50 (2022): 3714-3718.
- Fackler NP, Ehlers CB, Callan KT, et al. Statistical Fragility of Single-Row Versus Double-Row Anchoring for Rotator Cuff Repair: A Systematic Review of Comparative Studies. Orthop J Sports Med 10 (2022): 23259671221093391.
- Parisien RL, Danford NC, Jarin IJ, et al. The Fragility of Statistical Findings in Achilles Tendon Injury Research: A Systematic Review. J Am Acad Orthop Surg Glob Res Rev 5. Epub ahead of print 2 September (2021).
- Parisien RL, Constant M, Saltzman BM, et al. The Fragility of Statistical Significance in Cartilage Restoration of the Knee: A Systematic Review of Randomized Controlled Trials. Cartilage 13 (2021): 147S-155S.
- Parisien RL, Ehlers C, Cusano A, et al. The Statistical Fragility of Platelet-Rich Plasma in Rotator Cuff Surgery: A Systematic Review and Meta-analysis. Am J Sports Med 49 (2021): 3437-3442.
- Parisien RL, Trofa DP, Dashe J, et al. Statistical Fragility and the Role of P Values in the Sports Medicine Literature. J Am Acad Orthop Surg 27 (2019): e324-e329.
- Cordero JK, Lawrence KW, Brown AN, et al. The Fragility of Tourniquet Use in Total Knee Arthroplasty: A Systematic Review of Randomized Controlled Trials. J Arthroplasty 38 (2023): 1177-1183.
- Parisien RL, Trofa DP, O’Connor M, et al. The Fragility of Significance in the Hip Arthroscopy Literature: A Systematic Review. JB JS Open Access; 6. Epub ahead of print (2021).
- Parisien RL, Dashe J, Cronin PK, et al. Statistical Significance in Trauma Research: Too Unstable to Trust? J Orthop Trauma 33 (2019): e466-e470.
- McCormick KL, Tedesco LJ, Swindell HW, et al. Statistical fragility of randomized clinical trials in shoulder arthroplasty. J Shoulder Elbow Surg 30 (2021): 1787-1793.
- Go CC, Maldonado DR, Go BC, et al. The Fragility Index of Total Hip Arthroplasty Randomized Control Trials: A Systematic Review. J Am Acad Orthop Surg 30 (2022): e741-e750.
- Evaniew N, Files C, Smith C, et al. The fragility of statistically significant findings from randomized trials in spine surgery: a systematic survey. Spine J 15 (2015): 2188-2197.
- Checketts JX, Scott JT, Meyer C, et al. The Robustness of Trials That Guide Evidence-Based Orthopaedic Surgery. JBJS 100 (2018): e85.
- Minkus M, Königshausen M, Pauly S, et al. Immobilization in External Rotation and Abduction Versus Arthroscopic Stabilization After First-Time Anterior Shoulder Dislocation: A Multicenter Randomized Controlled Trial. Am J Sports Med 49 (2021): 857-865.
- Pougès C, Hardy A, Vervoort T, et al. Arthroscopic Bankart Repair Versus Immobilization for First Episode of Anterior Shoulder Dislocation Before the Age of 25: A Randomized Controlled Trial. Am J Sports Med 49 (2021): 1166-1174.
- Bottoni CR, Smith EL, Berkowitz MJ, et al. Arthroscopic versus open shoulder stabilization for recurrent anterior instability: a prospective randomized clinical trial. Am J Sports Med 34 (2006): 1730-1737.
- Moroder P, Schulz E, Wierer G, et al. Neer Award 2019: Latarjet procedure vs. iliac crest bone graft transfer for treatment of anterior shoulder instability with glenoid bone loss: a prospective randomized trial. J Shoulder Elbow Surg 28 (2019): 1298-1307.
- Mohtadi NGH, Chan DS, Hollinshead RM, et al. A randomized clinical trial comparing open and arthroscopic stabilization for recurrent traumatic anterior shoulder instability: two-year follow-up with disease-specific quality-of-life outcomes. J Bone Joint Surg Am 96 (2014): 353-360.
- Archetti Netto N, Tamaoki MJS, Lenza M, et al. Treatment of Bankart lesions in traumatic anterior instability of the shoulder: a randomized controlled trial comparing arthroscopy and open techniques. Arthroscopy 28 (2012): 900-908.
- Bottoni CR, Johnson JD, Zhou L, et al. Arthroscopic Versus Open Anterior Shoulder Stabilization: A Prospective Randomized Clinical Trial With 15-Year Follow-up With an Assessment of the Glenoid Being ‘On-Track’ and ‘Off-Track’ as a Predictor of Failure. Am J Sports Med 49 (2021): 1999-2005.
- Monteiro GC, Ejnisman B, Andreoli CV, et al. Absorbable versus nonabsorbable sutures for the arthroscopic treatment of anterior shoulder instability in athletes: a prospective randomized study. Arthroscopy 24 (2008): 697-703.
- Yapp LZ, Nicholson JA, Robinson CM. Primary Arthroscopic Stabilization for a First-Time Anterior Dislocation of the Shoulder: Long-Term Follow-up of a Randomized, Double-Blinded Trial. J Bone Joint Surg Am 102 (2020): 460-467.
- Robinson CM, Jenkins PJ, White TO, et al. Primary arthroscopic stabilization for a first-time anterior dislocation of the shoulder. A randomized, double-blind trial. J Bone Joint Surg Am 90 (2008): 708-721.
- Jakobsen BW, Johannsen HV, Suder P, et al. Primary repair versus conservative treatment of first-time traumatic anterior dislocation of the shoulder: a randomized study with 10-year follow-up. Arthroscopy 23 (2007): 118-123.
- Hiemstra LA, Sasyniuk TM, Mohtadi NGH, et al. Shoulder strength after open versus arthroscopic stabilization. Am J Sports Med 36 (2008): 861-867.
- Tan CK, Guisasola I, Machani B, et al. Arthroscopic stabilization of the shoulder: a prospective randomized study of absorbable versus nonabsorbable suture anchors. Arthroscopy 22 (2006): 716-720.
- Kirkley A, Werstine R, Ratjek A, et al. Prospective randomized clinical trial comparing the effectiveness of immediate arthroscopic stabilization versus immobilization and rehabilitation in first traumatic anterior dislocations of the shoulder: long-term evaluation. Arthroscopy 21 (2005): 55-63.
- Rhee YG, Lim CT, Cho NS. Muscle strength after anterior shoulder stabilization: arthroscopic versus open Bankart repair. Am J Sports Med 35 (2007): 1859-1864.
- Sperber A, Hamberg P, Karlsson J, et al. Comparison of an arthroscopic and an open procedure for posttraumatic instability of the shoulder: a prospective, randomized multicenter study. J Shoulder Elbow Surg 10 (2001): 105-108.
- Bottoni CR, Wilckens JH, DeBerardino TM, et al. A prospective, randomized evaluation of arthroscopic stabilization versus nonoperative treatment in patients with acute, traumatic, first-time shoulder dislocations. Am J Sports Med 30 (2002): 576-580.