Sunny Kumar¹, FNU Riya², Gauhar Hamid³, Bushra Ghafar⁴, FNU Payal⁵, Nisha Kumari³, FNU Gyaneshwari³, Adil Mushtaq⁶, Rubab Faisal⁷, Mandeep Kumar⁸, Rahul Rai³, Suneel Arwani⁹, Mohammad Jawwad², Hira Riaz¹⁰
¹Wright Center for Graduate Medical Education, Scranton, Pennsylvania, United States
²Dow University of Health Sciences, Karachi, Pakistan
³Liaquat University of Medical and Health Sciences, Jamshoro, Pakistan
⁴Quaid-e-Azam Medical College, Bahawalpur, Pakistan
⁵Ghulam Muhammad Mahar Medical College, Sukkur, Pakistan
⁶Akhtar Saeed Medical & Dental College, Lahore, Pakistan
⁷Islam Medical and Dental College, Sialkot, Pakistan
⁸Jinnah Medical and Dental College (JMDC), Karachi, Pakistan
⁹University of Mississippi Medical Center, Jackson, Mississippi, United States
¹⁰Kabul Medical University, Kabul, Afghanistan
*Corresponding Author: Hira Riaz, Kabul Medical University, Kabul, Afghanistan
Received: 26 June 2026; Accepted: 03 July 2026; Published: 15 July 2026
Background: Accurate staging of liver fibrosis is essential to prevent progression to cirrhosis and hepatocellular carcinoma. Vibration-Controlled Transient Elastography (VCTE), a form of Shear Wave Elastography (SWE), has significantly advanced the non-invasive assessment of liver stiffness. FibroScan® (Echosens, Paris, France) is the reference commercial VCTE platform with multiple validated probe configurations. FibroTouch® (Wuxi Hisky Medical Technologies Co., Ltd., Wuxi, China) has emerged as an alternative system; however, its comparative diagnostic performance across liver disease etiologies, and its practical differences from FibroScan in terms
of probes, calibration requirements, and cost, remain incompletely evaluated.
Objective: To systematically evaluate and compare the diagnostic accuracy of FibroScan and FibroTouch for detecting significant fibrosis (F2), advanced fibrosis (F3), and cirrhosis (F4) in patients with chronic liver diseases of multiple etiologies, and to contextualize differences in clinical applicability, probe availability, maintenance requirements, and cost.
Methods: A systematic review and diagnostic accuracy meta-analysis was conducted following comprehensive searches of PubMed, Scopus, and Web of Science from database inception to January 1, 2026. Studies reporting sensitivity, specificity, and/or area under the receiver operating characteristic curve (AUROC) for fibrosis staging were included. Study quality was assessed using the QUADAS-2 tool. Pooled sensitivity, specificity, and AUROC values were calculated using a random-effects model. Summary receiver operating
characteristic (SROC) curves and subgroup analyses according to liver disease etiology were performed. This study was registered in PROSPERO (CRD420251135490).
Results: A total of 41 studies involving 7,597 patients were included, comprising 9 studies evaluating FibroTouch (1,563 patients) and 32 studies evaluating FibroScan (6,034 patients). For detection of significant fibrosis (F2), pooled AUROC values were 0.81 for FibroTouch and 0.91 for FibroScan. For advanced fibrosis (F3), AUROC values were 0.92 and 0.94, respectively. For cirrhosis (F4), AUROC values were 0.89 for FibroTouch and 0.96 for FibroScan. Across fibrosis stages and disease etiologies, FibroScan demonstrated consistently higher pooled sensitivity and specificity.
Conclusion: FibroScan demonstrates superior and more consistent diagnostic accuracy compared with FibroTouch across fibrosis stages and chronic liver disease etiologies. When combined with its broader probe range, extensive validation, and the practical trade-off of mandatory annual probe calibration versus FibroTouch’s calibration-free operation, the choice between platforms should incorporate both performance data and institutional resource considerations.
Liver fibrosis, Vibration-Controlled Transient Elastography, VCTE, Shear Wave Elastography, FibroScan, FibroTouch, Diagnostic accuracy, MASLD
Liver fibrosis articles; Vibration-Controlled Transient Elastography articles; VCTE articles; Shear Wave Elastography articles; FibroScan articles; FibroTouch articles; Diagnostic accuracy articles; MASLD articles
Introduction
Liver fibrosis represents an intermediate stage in the progression of chronic liver diseases and poses a significant threat to global health due to its potential to advance to cirrhosis and hepatocellular carcinoma (HCC) [1]. Early detection is crucial because fibrosis remains partially reversible, highlighting the need for timely intervention to prevent complications and improve patient outcomes [2].
Historically, liver biopsy was regarded as the gold standard for diagnosing and staging fibrosis. However, its invasive nature, associated risks (bleeding, pain), and inherent limitations including sampling variability have driven the development of non-invasive diagnostic modalities [3]. Among these, Vibration-Controlled Transient Elastography (VCTE), a validated form of Shear Wave Elastography (SWE), has emerged as the leading non-invasive approach to liver stiffness measurement (LSM). The commercial implementation of VCTE by Echosens (Paris, France) under the trade name FibroScan® has gained the widest clinical adoption, supported by more than 6,000 peer-reviewed publications and over 250 international clinical guidelines [4]. FibroTouch® (Wuxi Hisky Medical Technologies Co., Ltd., Wuxi, China) is a more recently introduced commercial VCTE platform that has attracted increasing attention, particularly in Asian clinical settings, as a potentially lower-cost alternative [5,6].
Despite their shared underlying principle—transmitting low-frequency (50 Hz) shear waves through liver tissue and measuring propagation velocity as a surrogate for stiffness—these two platforms differ substantially in their probe configurations, calibration requirements, and associated costs. These practical considerations are as clinically relevant as raw diagnostic performance, yet they have not been systematically evaluated in prior comparative analyses. This systematic review and meta-analysis therefore aims both to compare the diagnostic accuracy of FibroScan and FibroTouch across fibrosis stages and disease etiologies, and to provide a structured assessment of the practical differences between the two platforms that are relevant to clinical decision-making [4].
Technical Background and Device Comparison
Noninvasive assessment of liver fibrosis has become a cornerstone in the management of chronic liver diseases, with vibration-controlled transient elastography (VCTE) emerging as one of the most widely adopted modalities within the broader framework of shear wave elastography (SWE). Among commercially available platforms, FibroScan (Echosens, Paris, France) has long been considered the reference standard for VCTE-based liver stiffness measurement, supported by extensive validation across diverse patient populations. More recently, FibroTouch has been introduced as a cost-accessible alternative that operates on a similar VCTE principle but incorporates distinct proprietary algorithms, probe configurations, and maintenance requirements.
Despite their shared technological foundation, important differences exist between these devices, including probe availability, measurement reproducibility, calibration requirements, and acquisition costs. FibroScan offers multiple probe options tailored to patient body habitus, whereas FibroTouch utilizes a single-probe design, potentially limiting its applicability in certain populations. Furthermore, while FibroScan requires regular manufacturer calibration with associated maintenance costs, FibroTouch adopts a different operational model without mandatory scheduled calibration. Preliminary comparative studies suggest good correlation in liver stiffness measurements between the two devices but raise concerns regarding systematic differences and variability.
Notably, while diagnostic accuracy and technical performance of VCTE devices have been explored, there remains a significant gap in the literature regarding comprehensive cost comparisons and real-world economic implications of these platforms. In particular, the absence of standardized evaluations incorporating acquisition costs, maintenance expenses, and long-term operational considerations limits evidence-based decision-making, especially in resource-constrained settings. Addressing this gap is essential to contextualize device selection beyond technical performance and to inform cost-effective implementation of noninvasive fibrosis assessment strategies.
3. Methods
3.1 Search Strategy
A comprehensive literature search was conducted across PubMed, Scopus, and Web of Science from database inception to January 1, 2026. The search combined controlled vocabulary and free-text keywords including: “liver fibrosis,” “hepatic fibrosis,” “cirrhosis,” “metabolic dysfunction-associated steatotic liver disease,” “MASLD,” “hepatitis B,” “hepatitis C,” “alcoholic liver disease,” “FibroScan,” “FibroTouch,” “transient elastography,” “VCTE,” “shear wave elastography,” “diagnostic accuracy,” “sensitivity,” “specificity,” and “AUROC.” Boolean operators (AND/OR) were applied. Filters were applied for human studies, English-language articles, and original diagnostic accuracy studies. Duplicate records were removed prior to screening. Detailed search strategy is provided in table 1.
|
Database |
Search String |
Search results |
|
PubMed |
("Liver Fibrosis"[Mesh] OR "hepatic fibrosis" OR "liver cirrhosis"[Mesh] OR "NAFLD" OR "non-alcoholic fatty liver disease" OR "Hepatitis B"[Mesh] OR "Hepatitis C"[Mesh] OR "alcoholic liver disease") AND ("Fibroscan" OR "transient elastography" OR "Fibrotouch" OR "elastography") AND ("Sensitivity and Specificity"[Mesh] OR "diagnostic accuracy" OR "AUROC" OR "ROC curve" OR "predictive value" OR "likelihood ratio") |
2029 |
|
Scopus |
TITLE-ABS-KEY("liver fibrosis" OR "hepatic fibrosis" OR "cirrhosis" OR "NAFLD" OR "non-alcoholic fatty liver" OR "hepatitis B" OR "hepatitis C" OR "alcoholic liver disease") AND TITLE-ABS-KEY("Fibroscan" OR "Fibrotouch" OR "transient elastography" OR "elastography") AND TITLE-ABS-KEY("diagnostic accuracy" OR "sensitivity" OR "specificity" OR "AUROC" OR "ROC curve" OR "diagnostic performance") |
1034 |
|
Web of Science |
TS=("liver fibrosis" OR "hepatic fibrosis" OR "cirrhosis" OR "non-alcoholic fatty liver" OR "NAFLD" OR "hepatitis B" OR "hepatitis C" OR "alcoholic liver disease") AND TS=("Fibroscan" OR "Fibrotouch" OR "transient elastography" OR "elastography") AND TS=("diagnostic accuracy" OR "sensitivity" OR "specificity" OR "AUROC" OR "ROC curve") |
1560 |
Table 4: Search strategy
3.2 Study Selection and Inclusion Criteria
Studies were eligible if they evaluated the diagnostic accuracy of FibroTouch or FibroScan in detecting liver fibrosis stages in patients with chronic liver diseases, including hepatitis B, hepatitis C, alcoholic liver disease, and metabolic dysfunction-associated steatotic liver disease (MASLD, formerly NAFLD). Only studies reporting sensitivity, specificity, and/or AUROC for fibrosis stages F2 (significant fibrosis), F3 (advanced fibrosis), or F4 (cirrhosis), with liver biopsy as the reference standard, were included. Exclusion criteria included studies without sufficient extractable data, unclear methodologies, or non-comparable techniques. This meta-analysis is registered in PROSPERO: CRD420251135490.
3.3 Data Extraction and Quality Assessment
Data were extracted independently by two reviewers using a standardized form, capturing sensitivity, specificity, AUROC, diagnostic odds ratios (DOR), and likelihood ratios. Discrepancies were resolved by consensus or a third reviewer. Methodological quality was assessed using the QUADAS-2 tool, evaluating four domains: patient selection, index test, reference standard, and flow and timing. Results are summarized in figure S14.
3.4 Statistical Analysis
A random-effects model was employed to calculate pooled sensitivity, specificity, and AUROC values. Subgroup analyses were conducted by fibrosis stage and liver disease etiology. SROC curves were generated to provide a comprehensive visual representation of diagnostic accuracy. All analyses were performed in STATA version 17, with results reported with 95% confidence intervals (CIs).
4. Results
4.1 Study selection
A total of 4,623 records were identified through systematic database searches. After removing 2,234 duplicates, 2,389 records were screened by title and abstract. Of these, 1,346 were excluded for not meeting eligibility criteria, leaving 1,043 for full-text review. Following detailed evaluation, 1,002 were excluded due to ineligible study design, population, insufficient data, or non-relevance. Ultimately, 41 studies met the inclusion criteria and were included in the systematic review and meta-analysis. The study selection process is illustrated in the PRISMA flow diagram (Figure 1).
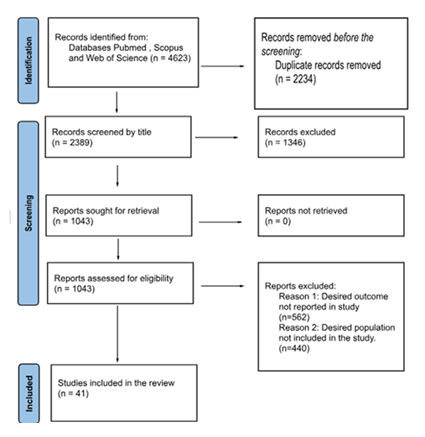
Figure 1: Prisma Flow diagram.
4.2 Study characteristics
This meta-analysis incorporated data from 41 studies encompassing 7,597 patients. Among these, 9 studies assessed FibroTouch (1,563 patients) and 32 studies evaluated FibroScan (6,034 patients). Studies represented diverse patient populations with viral hepatitis, alcoholic liver disease, and MASLD. Most studies were of high methodological quality with low to moderate risk of bias. Characteristics are shown in table 2.
|
Fibrotouch |
Fibroscan |
|||||||
|
Fibrosis stage |
studies |
SE (95%Cl) |
SP(95%Cl) |
AUROC(95%Cl) |
studies |
SE(95%Cl) |
SP(95%Cl) |
AUROC (95%Cl) |
|
F2(Significant) |
8 |
0.78 (0.68 -0.85) |
0.72 (0.6-0.81) |
0.81 [0.78 - 0.85] |
32 |
0.86 (0.82-0.89) |
0.82 (0.74-0.88) |
0.91 (0.88-0.93) |
|
F3(Advanced) |
8 |
0.85 (0.75-0.92 ) |
0.77 (0.73-0.61) |
0.92 [0.89 - 0.94] |
24 |
0.88 (0.82-0.92) |
0.89 (0.85-0.92) |
0.94 (0.92-0.96) |
|
F4(Cirrhosis) |
9 |
0.84 (0.78-0.88) |
0.84 (0.77-0.89) |
0.89 [0.86 - 0.92] |
29 |
0.91 (0.83-0.96) |
0.91 (0.87-0.84) |
0,96 (0.94-0.98) |
Table 2: Pooled Sensitivity, Specificity and Area under receiver operating curve(AUROC) of Fibrotouch and Fibroscan by Fibrosis Stage; F2, F3 and F4.
4.3 Diagnostic Accuracy
4.3.1 Significant Fibrosis (F2): FibroTouch demonstrated a pooled sensitivity of 0.78 (95% CI: 0.68-0.85) and specificity of 0.72 (95% CI: 0.60-0.81) (Figure S2), with an AUROC of 0.81 (95% CI: 0.78-0.85) (Figure S8). FibroScan exhibited superior sensitivity (0.86, 95% CI: 0.82-0.89), specificity (0.82, 95% CI: 0.74-0.88) (Figure S1), and AUROC (0.91, 95% CI: 0.88-0.93) (Figure S7).
4.3.2 Advanced Fibrosis (F3): For advanced fibrosis, FibroTouch showed sensitivity of 0.85 (95% CI: 0.75-0.92), specificity of 0.77 (95% CI: 0.73-0.81) (Figure S4), and AUROC of 0.92 (95% CI: 0.89-0.94) (Figure S10). FibroScan outperformed with sensitivity of 0.88 (95% CI: 0.82-0.92), specificity of 0.89 (95% CI: 0.85-0.92) (Figure S3), and AUROC of 0.94 (95% CI: 0.92-0.96) (Figure S9).
4.3.3 Cirrhosis (F4): For cirrhosis, FibroTouch achieved sensitivity of 0.84 (95% CI: 0.78-0.88) and specificity of 0.84 (95% CI: 0.77-0.89) (Figure S6), with AUROC of 0.89 (95% CI: 0.86-0.92) (Figure S12). FibroScan reported higher sensitivity (0.91, 95% CI: 0.83-0.96), specificity (0.91, 95% CI: 0.87-0.94) (Figure S5), and AUROC (0.96, 95% CI: 0.94-0.98) (Figure S11). Results are summarized in table 3.
|
Subgroup |
Fibrosis stage |
Sensitivity (95% Confidence interval) |
Specitivity (95% Confidence interval) |
|
CHB |
F2 |
0.822 (0.891 0.891) |
0.892 (0.93 0.93) |
|
F3 |
0.912 (0.794 0.966) |
0.906 (0.737 0.971) |
|
|
F4 |
0.895 (0.822 0.941) |
0.882 (0.847 0.91) |
|
|
CHC |
F2 |
0.836 (0.726 0.908) |
0.707 (0.475 0.865) |
|
F4 |
0.943 (0.837-0.982) |
0.912 (0.872-0.940) |
|
|
CLD |
F1 |
0.852 (0.642-0.949) |
0.820 (0.565-0.942) |
|
F2 |
0.848 (0.792-0.891) |
0.796 (0.715-0.858) |
|
|
F3 |
0.863 (0.793-0.912) |
0.876 (0.827-0.913) |
|
|
F4 |
0.865 (0.747-0.933) |
0.878 (0.808-0.925) |
|
|
NAFLD |
F2 |
0.873 (0.738-0.943) |
0.952 (0.751-0.992) |
|
F3 |
0.900 (0.668-0.975) |
0.843 (0.752-0.905) |
Table 3: Table showing subgroup analysis according to the disease etioogy. F2, F3 and F4 represent the different stages of liver cirrhosis.
4.4 Subgroup Analysis by Disease Etiology:
Subgroup analyses confirmed FibroScan’s consistently strong performance across all etiological groups. Sensitivity and specificity were particularly high for advanced fibrosis and cirrhosis across all subgroups, with minor variability (notably lower specificity for F2 in the CHC subgroup). Results are provided in table 4 and supplementary figures S13-S45.
4.4.1 Chronic Hepatitis B (CHB): For F2, pooled sensitivity and specificity were 0.822 (95% CI: 0.891-0.891) (Figure S14) and 0.892 (95% CI: 0.93-0.93) (Figure S15), respectively. For F3, sensitivity was 0.912 (95% CI: 0.794-0.966) (Figure S17) and specificity 0.906 (95% CI: 0.737-0.971) (Figure S18). For F4, sensitivity was 0.895 (95% CI: 0.822-0.941) and specificity 0.882 (95% CI: 0.847-0.91). HSROC curves are shown in Figures S13, S16, and S19.
4.4.2 Chronic Hepatitis C (CHC): For F2, pooled sensitivity and specificity were 0.836 (95% CI: 0.726-0.908) and 0.707 (95% CI: 0.475-0.865), respectively. For F4, sensitivity was 0.943 (95% CI: 0.837-0.982) and specificity 0.912 (95% CI: 0.872-0.940). HSROC curves are in Figures S22 and S25.
4.4.3 Chronic Liver Disease (CLD): Across fibrosis stages F1-F4, sensitivities ranged from 0.848 to 0.865 and specificities from 0.796 to 0.878. HSROC curves are shown in Figures S28, S31, S34, and S37.
|
Author(s), Year |
Country |
Population |
Index Test |
Reference Standard |
Main Findings |
|
Carrión et al., 2006 |
Spain |
100 LT recipients with recurrent HCV |
TE |
Biopsy, HVPG |
TE >8.5 kPa predicted advanced fibrosis (AUROC 0.89); correlated with HVPG. |
|
Castéra et al., 2005 |
France |
183 patients with HCC |
TE, FT, APRI |
Biopsy (METAVIR) |
TE AUROC 0.83 for ≥F2, 0.90 for ≥F3, 0.95 for F4; better than APRI. |
|
Chang et al., 2016 |
Korea |
209 CHB patients |
MRE |
Biopsy |
Similar diagnostic performance across etiologies. |
|
Choi et al., 2013 |
Korea |
91 CLD patients |
MRE vs Gd-EOB MRI |
Biopsy |
MRE superior to Gd-EOB MRI for staging fibrosis. |
|
Coco et al., 2006 |
Italy |
153 CLD patients |
TE |
Biopsy |
TE values increased during ALT flares, may overestimate fibrosis. |
|
Corpechot et al., 2006 |
France |
202 patients (PBC, PSC) |
TE |
Biopsy, clinical |
TE correlated with biliary fibrosis (AUROC 0.92 for cirrhosis). |
|
de Lédinghen et al., 2006 |
France |
72 HIV/HCV coinfected patients |
TE |
Biopsy (METAVIR) |
TE accurately detected cirrhosis (AUROC 0.97), reliable in coinfection. |
|
Farmakis et al., 2019 |
USA |
69 CLD patients |
SWE |
Biopsy |
SWE correlated strongly with fibrosis stage (r=0.74). |
|
Foucher et al., 2006 |
France |
251 CLD patients |
TE (FibroScan) |
Biopsy (METAVIR) |
TE cutoff 14.6 kPa identified cirrhosis (AUROC 0.95). |
|
Fraquelli et al., 2007 |
Italy |
165 CLD patients |
TE |
Biopsy (Ishak) |
TE showed excellent reproducibility (ICC >0.98). |
|
Gómez-Domínguez et al., 2006 |
Spain |
128 CLD patients |
TE |
Biopsy (METAVIR) |
TE ≥12.5 kPa strongly predictive of cirrhosis (AUROC 0.96). |
|
Hashemi et al., 2016 |
Iran (Review) |
698 NAFLD patients |
TE |
Biopsy (pooled studies) |
Pooled AUROC ~0.85; TE less accurate in obese patients. |
|
Hudert et al., 2018 |
Germany |
66 obese adolescents with NAFLD |
US THE |
Biopsy |
AUROC 0.91 for fibrosis ≥F2. |
|
Hudert et al., 2019 |
Germany |
38 NAFLD patients |
TomoE |
Biopsy |
AUROC 0.95 for fibrosis ≥F2. |
|
Huwart et al., 2008 |
Belgium |
141 CLD patients |
MRE |
Biopsy (METAVIR) |
MRE AUROC 0.93 for ≥F2; more accurate than TE in subset. |
|
Jia et al., 2015 |
China |
618 CHB patients |
TE vs APRI, FT |
Biopsy |
TE outperformed serum markers (AUROC 0.82 for ≥F2, 0.91 for F4). |
|
Kim BH et al., 2011 |
Korea |
177 CLD patients |
MRE |
Biopsy |
MRE AUROC 0.96 for cirrhosis; good in CHB. |
|
Kim BK et al., 2012 |
Korea |
496 CHB patients |
TE, ELF, FT |
Biopsy |
ELF and TE both accurate; TE AUROC 0.88 for ≥F3. |
|
Lee et al., 2013 |
USA |
91 CLD patients |
TE + serum markers |
Biopsy |
TE AUROC 0.82 for ≥F3; better than serum markers alone. |
|
Nudo et al., 2008 |
USA |
39 CLD patients |
TE vs laparoscopic biopsy |
Biopsy |
Good correlation (r=0.73). |
|
Obara et al., 2008 |
Japan |
150 viral & non-viral CLD patients |
TE |
Biopsy |
TE detected ≥F2 fibrosis (AUROC 0.85). |
|
Rigamonti et al., 2008 |
Italy |
50 LT recipients with recurrent HCV |
TE |
Biopsy (METAVIR) |
TE predicted fibrosis progression; cutoff >7.5 kPa for ≥F2. |
|
Seo et al., 2015 |
Korea (Multicenter) |
1,073 CHB/HCV patients |
TE |
Biopsy |
TE cutoffs varied by etiology; AUROC ~0.85 for ≥F2. |
|
Shi et al., 2014 |
China/USA |
150 CHB patients |
MRE |
Biopsy |
Necroinflammation did not affect MRE stiffness. |
|
Xu et al., 2019 |
China |
406 CLD patients |
FibroTouch vs TE |
Biopsy |
Both accurate; FibroTouch slightly lower AUROC. |
|
Ganne-Carrié et al., 2006 |
France (multicenter) |
711 CLD patients |
TE (FibroScan) |
Biopsy |
Diagnostic accuracy for cirrhosis. |
|
Marcellin et al., 2009 |
France |
173 CHB patients |
TE |
Biopsy (METAVIR) |
Diagnostic performance for fibrosis stages. |
|
Nguyen-Khac et al., 2008 |
France |
221 Alcoholic liver disease patients |
TE |
Biopsy + serum markers (APRI, FT, etc.) |
Fibrosis detection compared with biopsy and serum scores. |
|
Oliveri et al., 2008 |
Italy |
202 HBV carriers (inactive/active) |
TE |
Biopsy |
ALT fluctuations influenced stiffness, fibrosis staging. |
|
Vergara et al., 2007 |
Spain |
201 HIV-HCV coinfected patients |
TE |
Biopsy |
Accuracy for fibrosis staging in coinfection. |
|
Ziol et al., 2005 |
France |
327 CHC patients |
TE |
Biopsy (METAVIR) |
Correlation between stiffness and fibrosis. |
|
Yoneda et al., 2007 |
Japan |
67 NAFLD patients |
TE |
Biopsy |
Usefulness of TE in NAFLD fibrosis assessment. |
|
Duan et al., 2020 |
China (multicenter) |
1,071 CHB pts |
New TE device (FibroTouch) |
Biopsy (METAVIR) |
Device showed high accuracy (AUROC 0.82 for ≥F2, 0.90 for ≥F3, 0.94 for F4). |
|
Liu et al., 2016 |
China |
126 CHB pts |
FibroTouch vs ARFI |
Biopsy |
FibroTouch correlated well with ARFI (r=0.73), AUROC 0.83 for ≥F3. |
|
Nan et al., 2019 |
China |
72 CHC pts |
Serum microRNA-1273g-3p |
Biopsy |
microRNA-1273g-3p distinguished significant fibrosis (AUROC 0.87), potential non-invasive biomarker. |
|
Peng et al., 2022 |
China |
342 CLD pts (various etiologies) |
FibroTouch, serum fibrosis indices |
Biopsy |
FibroTouch AUROC 0.86 for ≥F3; similar performance across etiologies. |
|
Qu et al., 2021 |
China |
432 NAFLD pts |
FibroTouch UAP + LSM |
Biopsy |
UAP predicted steatosis (AUROC 0.87 for ≥S2); LSM predicted fibrosis (AUROC 0.89 for ≥F2). |
|
Xu et al., 2019 |
China |
406 CLD pts |
FibroTouch vs FibroScan |
Biopsy |
Both accurate (AUROC ~0.85 for ≥F2), FibroScan slightly higher performance. |
|
Yang et al., 2018 |
China |
180 CHB pts |
Non-invasive indices (APRI, FIB-4, FibroTouch) |
Biopsy |
FibroTouch had better accuracy than APRI and FIB-4 (AUROC 0.82 vs 0.73-0.76). |
|
Yu et al., 2021 |
China |
268 MAFLD + T2DM pts |
FibroTouch |
Biopsy |
Accurate for both steatosis and fibrosis (AUROC 0.85 for ≥F2; UAP AUROC 0.88 for ≥S2). |
|
Zuo et al., 2022 |
China |
410 CLD pts |
FibroTouch vs 6 serological models |
Biopsy |
FibroTouch outperformed serum models (AUROC 0.88 vs 0.72-0.80). |
Table 1: Study characteristics of included studies. TE, transient elastography; MRE, magnetic resonance elastography; SWE, shear wave elastography; US THE, ultrasound time-harmonic elastography; TomoE, tomoelastography; FT, FibroTest; APRI, AST-to-platelet ratio index; ELF, enhanced liver fibrosis test; HVPG, hepatic venous pressure gradient; CHB, chronic hepatitis B; CHC, chronic hepatitis C; CLD, chronic liver disease; HCC, hepatocellular carcinoma; HBV, hepatitis B virus; HCV, hepatitis C virus; NAFLD, non-alcoholic fatty liver disease; PBC, primary biliary cholangitis; PSC, primary sclerosing cholangitis; LT, liver transplant.
4.4.4 Metabolic Dysfunction-Associated Steatotic Liver Disease (MASLD): In patients with MASLD (formerly NAFLD), for F2, FibroScan demonstrated sensitivity of 0.873 (95% CI: 0.738-0.943) and particularly high specificity of 0.952 (95% CI: 0.751-0.992) (Figures S41-S42). For F3, pooled sensitivity was 0.900 (95% CI: 0.668-0.975) and specificity 0.843 (95% CI: 0.752-0.905) (Figures S44-S45). HSROC curves are shown in Figures S40 and S43.
5. Discussion
The present meta-analysis demonstrates that FibroScan, the leading commercial implementation of Vibration-Controlled Transient Elastography (VCTE), consistently outperforms FibroTouch across all fibrosis stages and chronic liver disease etiologies in terms of pooled sensitivity, specificity, and AUROC. This finding is consistent with the mechanistic and technical differences between the two platforms described in section 2, and aligns with previous independent head-to-head comparisons [18].
The pathophysiology of liver cirrhosis, characterized by progressive extracellular matrix deposition, architectural disruption, and increased liver stiffness, underpins the rationale for VCTE-based diagnostics. Liver stiffness measured in kPa correlates not only with fibrosis stage but also with portal hypertension severity and risk of variceal bleeding and ascites, making it a critical biomarker for disease management. ¹⁰¹³¹⁴ Both FibroScan and FibroTouch leverage this physiology, but their differing measurement reproducibility, probe flexibility, and calibration standards affect their real-world utility.
The superior AUROC of FibroScan—especially for cirrhosis (0.96 vs. 0.89)—likely reflects the combination of its more refined and extensively validated algorithms, its broader probe options for optimizing measurements across body habitus, and the quality assurance provided by mandatory annual calibration. FibroTouch’s modestly lower but still clinically reasonable performance may partly reflect the limited number of included studies (9 vs. 32), its single-probe design that constrains applicability in obese patients, and the algorithmic uncertainty around its steatosis parameter described in phantom studies [18].
5.1 Practical Value, Probe Availability, Calibration Requirements, and Cost
Beyond raw diagnostic accuracy, the comparative practical value of FibroScan and FibroTouch deserves careful consideration as it directly influences device selection in clinical and resource-constrained settings.
FibroScan’s multi-probe architecture is a critical practical advantage. The current FibroScan device range (Mini+, Compact, and Expert models) supports three interchangeable probe configurations: M+, XL+, and S+ [4]. The M+ probe is appropriate for standard adults, while the XL+ probe is designed for patients with obesity or a skin-to-liver-capsule distance exceeding 25 mm, a population in whom the M+ probe generates unreliable measurements at a documented rate of up to 25-30% [7]. The S+ probe extends applicability to lean adults and pediatric patients with thoracic circumference below 75 cm. This multi-probe flexibility is indispensable in hepatology populations increasingly characterized by obesity and metabolic syndrome, and it also supports spleen stiffness measurement (SSM) on the Expert 630 model at 100 Hz, enabling non-invasive portal hypertension assessment [4]. FibroTouch, by contrast, is marketed with a single probe, which restricts its use in obese or lean patient subpopulations and may contribute to higher rates of unreliable measurements in these groups—a limitation that is not always apparent from aggregate AUROC data alone.
The calibration requirement is a second important practical differentiator. Echosens mandates annual probe calibration for all FibroScan probes as an essential maintenance service to guarantee measurement accuracy and regulatory compliance [4]. In the United States, annual maintenance contracts for FibroScan, inclusive of calibration, are estimated at $3,000-$12,000 depending on the device model and service tier, with full device acquisition costs ranging from approximately $60,000 to $125,000 [9]. This recurring cost must be budgeted as part of total cost of ownership. FibroTouch does not require scheduled annual probe calibration, which eliminates this expense and the associated logistical burden of coordinating annual manufacturer service visits. This distinction has real financial implications, particularly for smaller practices, point-of-care settings, or facilities in lower-income countries where service infrastructure may be limited. However, as noted in section 2.3, the trade-off is that the absence of mandated calibration leaves long-term measurement drift unverified, and independent data on FibroTouch’s measurement stability over time remain scarce.
From a cost-per-examination perspective, FibroScan per-test costs in the United States are estimated at $5-40 depending on patient volume, probe type, and facility overhead, with out-of-pocket patient charges reported between $200 and $1,500 depending on the clinical setting and insurance coverage [9]. FibroTouch examination costs are generally lower in markets where both devices are available, primarily due to lower device acquisition price and the absence of mandatory calibration fees; however, direct cost-effectiveness analyses comparing the two systems in real-world settings remain limited and represent an important gap in the literature.
In summary, FibroScan offers superior diagnostic performance, validated multi-probe flexibility, and the quality assurance of mandatory annual calibration at a higher total cost of ownership. FibroTouch offers a lower-cost, calibration-free alternative with acceptable diagnostic performance, but is constrained by its single-probe design, limited validation data, and concerns about measurement reproducibility. The choice between platforms should therefore be guided not only by AUROC data but by local patient demographics, available service infrastructure, and institutional budget frameworks.
5.2 Nomenclature: MASLD Replaces NAFLD
An important terminological update must be acknowledged throughout this manuscript. In June 2023, a global multisociety Delphi consensus process—convened under the auspices of the AASLD, EASL, and ALEH with input from 236 panellists across 56 countries—formally replaced the term non-alcoholic fatty liver disease (NAFLD) with metabolic dysfunction-associated steatotic liver disease (MASLD) [19]. Under this new framework, MASLD is defined by the presence of hepatic steatosis combined with at least one of five cardiometabolic risk factors. The term “fatty” was retired due to its stigmatizing connotations, and “steatotic” was adopted as the overarching descriptor for hepatic fat accumulation. Concurrently, non-alcoholic steatohepatitis (NASH) was renamed metabolic dysfunction-associated steatohepatitis (MASH) [19]. All references to NAFLD in this manuscript should therefore be interpreted as equivalent to MASLD under the current nomenclature. The studies included in the meta-analysis predating 2023 used the NAFLD terminology; their populations and inclusion criteria are consistent with the current MASLD definition.
5.3 Diagnostic Performance in Context
While the overall performance advantage of FibroScan is consistent, both devices demonstrated clinically useful diagnostic accuracy, particularly at higher fibrosis stages. The AUROC of 0.92-0.94 for FibroTouch at advanced fibrosis (F3) and 0.89 for cirrhosis (F4) indicates that it can reliably identify patients with the most clinically consequential disease burden. These data are particularly relevant for resource-limited settings where FibroTouch’s lower cost may be the determining factor in device availability. In such contexts, the incremental accuracy gain from FibroScan must be weighed against the substantially higher cost and infrastructure requirements.
FibroTouch’s diagnostic limitations are most pronounced at the significant fibrosis threshold (F2), where AUROC was 0.81 versus 0.91 for FibroScan. At this early stage, where therapeutic decisions may hinge on accurate staging, the performance gap is clinically meaningful and should discourage routine substitution of FibroTouch for FibroScan in settings where F2 detection is the primary screening objective.
The difference in measurement variability between the two devices, as quantified by Herrmann et al. (coefficient of variation 27.4% for FibroTouch vs. 11.1% for FibroScan), [18] is also relevant when VCTE is used for longitudinal monitoring of treatment response. Poor reproducibility may lead to apparent changes in LSM that reflect measurement noise rather than true fibrosis progression or regression, undermining the clinical value of serial assessments. This concern is particularly salient in the context of emerging fibrosis-reversing therapies for MASLD.
6. Technical Background and Device Comparison
6.1 Vibration-Controlled Transient Elastography and Its Place in Shear Wave Elastography
Shear Wave Elastography (SWE) is a broad category of ultrasound-based techniques that quantify tissue stiffness by measuring the speed of mechanically induced shear waves. VCTE is a specific and proprietary implementation of SWE in which a mechanical vibrator mounted on the probe transducer generates a single 50 Hz sinusoidal shear wave, which is then tracked by pulse-echo ultrasound to calculate LSM in kilopascals (kPa). VCTE differs from point SWE and 2D-SWE in that it does not require a standard B-mode ultrasound image for guidance; instead, the operator relies on probe positioning indicators. The measurement samples a cylindrical liver volume approximately 100 times larger than a needle biopsy, reducing sampling error [7]. Both FibroScan and FibroTouch operate on this VCTE principle and are CE-marked devices; however, they employ different proprietary algorithms and user interfaces.
6.2 Probe Configurations: A Key Practical Difference
One of the most clinically significant differences between the two platforms is probe availability. FibroScan offers three probe types: the M+ probe for standard adults, the XL+ probe for patients with obesity (skin-to-liver-capsule distance >25 mm or BMI >30 kg/m²), and the S+ probe (formerly the pediatric probe) for children or lean adults with a thoracic circumference below 75 cm [8]. The availability of the XL+ probe is particularly important because use of the standard M+ probe in obese patients is a well-documented source of measurement failure and unreliable results [7]. In direct contrast, FibroTouch is currently available with only a single probe configuration, which limits its applicability across the full spectrum of body habitus encountered in clinical practice. In a prospective head-to-head comparison, Herrmann et al. demonstrated that while LSM between the two devices correlated well (r = 0.91), FibroTouch showed a mean overestimation of liver stiffness of 3.1 kPa compared to FibroScan, and the coefficient of variation for repeated measurements was substantially worse for FibroTouch (27.4% vs. 11.1%), raising concerns about reproducibility in routine use [18].
6.3 Calibration Requirements and Maintenance Costs
FibroScan probes require mandatory annual calibration by the manufacturer (Echosens) to ensure measurement accuracy and maintain regulatory compliance. Echosens states explicitly that probe calibration is an essential maintenance service to guarantee the quality and reliability of measurements [4]. This annual calibration constitutes a recurring operational cost that must be factored into total cost of ownership. In the United States, FibroScan device purchase prices typically range from approximately $60,000 to $125,000 depending on the model (Mini+, Compact, or Expert), with annual maintenance contracts estimated at $3,000 to $12,000 per year, inclusive of calibration [9]. Per-examination costs, after accounting for device depreciation and overhead, are commonly estimated at $5-40 depending on patient volume and facility type [9].
FibroTouch, by contrast, does not require scheduled annual probe calibration, which eliminates this recurring cost and logistical burden. The device acquisition cost is generally lower than FibroScan, reflecting both its single-probe design and its positioning as a cost-accessible alternative, particularly in low- and middle-income country settings. However, it is important to note that the absence of mandatory calibration does not itself imply superior or equivalent reliability; rather, it represents a different maintenance paradigm whose implications for long-term measurement consistency have not been prospectively evaluated in multi-year studies.
An additional algorithmic concern with FibroTouch relates to its steatosis parameter, the Ultrasound Attenuation Parameter (UAP), which has been shown to depend directly on the body weight and height entered by the operator before each examination, rather than measuring true ultrasound attenuation independently. Phantom experiments confirmed that UAP values change in a linear fashion with entered BMI (UAP = 3.02 × BMI + 186), suggesting the parameter may not reflect genuine tissue attenuation in obese patients [18]. This represents a meaningful limitation when FibroTouch is used for concurrent steatosis assessment.
7. Strengths and Limitations
7.1 Strengths
This systematic review and meta-analysis includes 41 studies encompassing 7,597 patients across diverse liver disease etiologies, ensuring broad clinical generalizability. The use of QUADAS-2 for quality assessment, advanced statistical methods including SROC analysis, and stratified subgroup analyses by fibrosis stage and etiology provide methodological robustness. The review is also the first to systematically incorporate a structured comparison of practical parameters—probe configuration, calibration requirements, and cost—alongside diagnostic accuracy metrics.
7.2 Limitations
The most significant limitation is the marked asymmetry in the evidence base: 32 studies evaluated FibroScan versus only 9 for FibroTouch. This disparity substantially limits the statistical precision of FibroTouch estimates and may explain some of the between-device performance gap. The largely observational study designs introduce confounding and selection bias. Heterogeneity was high across several endpoints, reflecting differences in patient populations, operator experience, diagnostic thresholds, and study design. The absence of direct randomized head-to-head comparative trials prevents definitive conclusions about relative device performance under standardized conditions. Additionally, most FibroTouch studies were conducted in Asian populations, which may limit extrapolation to Western patient cohorts.
8. Conclusions
FibroScan demonstrates superior diagnostic accuracy for liver fibrosis staging across all grades and etiologies compared with FibroTouch, and remains the preferred VCTE platform for clinical practice. Its multi-probe design (M+, XL+, S+), extensive validation evidence base, and quality-assured annual calibration justify its higher cost in settings where diagnostic precision is paramount. FibroTouch represents a clinically acceptable and cost-effective alternative—particularly for advanced fibrosis and cirrhosis detection in resource-limited environments—but is constrained by its single-probe limitation, lower reproducibility, and limited validation data. Future research should prioritize prospective head-to-head trials with standardized protocols, long-term reproducibility data for FibroTouch, and formal cost-effectiveness analyses comparing both platforms across healthcare settings.
Declarations
Declaration of competing interest
The authors declare that they have no known competing financial interests or personal relationships that could have appeared to influence the work reported in this paper.
Financial disclosure
There were no financial interests in any of the procedures, devices, or products mentioned in this manuscript for any of the authors. No funding or grant was received for this study.
Ethical statement
This study is a meta-analysis of previously published studies and did not involve the direct collection of new data from human participants. Ethical approval and informed consent were not required. All included studies had obtained appropriate ethical approval from their respective institutional review boards.
IRB approval
No IRB approval was required for this manuscript as no human subjects were involved.
Data availability statement
The authors confirm that studies included in this research are publicly available on PubMed Central. Data supporting the findings are available within the article and Supplementary Material files.
Consent for publication
Not applicable. This study is a systematic review and meta-analysis of previously published data and does not involve individual patient data or identifiable human subjects.
References
- Hashemi SA, Alavian SM, Gholami-Fesharaki M. Assessment of transient elastography (FibroScan) for diagnosis of fibrosis in non-alcoholic fatty liver disease: A systematic review and meta-analysis. Caspian J Intern Med 7 (2016): 242-252.
- Friedrich-Rust M, Ong MF, Martens S, et al. Performance of transient elastography for the staging of liver fibrosis: A meta-analysis. Gastroenterology 134 (2008): 960-974.
- Talwalkar JA, Kurtz DM, Schoenleber SJ, et al. Ultrasound-based transient elastography for the detection of hepatic fibrosis: Systematic review and meta-analysis. Clin Gastroenterol Hepatol 5 (2007): 1214-1220.
- Echosens. FibroScan® device range and probe specifications.
- Abd El Rihim AY, Omar RF, Fathalah W, et al. Role of FibroScan and APRI in detection of liver fibrosis: A systematic review and meta-analysis. Arab J Gastroenterol 14 (2013): 44-50.
- Parkes J, Guha IN, Roderick P, et al. Performance of serum marker panels for liver fibrosis in chronic hepatitis C. J Hepatol 54 (2011): 655-662.
- Bota S, Herkner H, Sporea I, et al. Meta-analysis: ARFI elastography versus transient elastography for the evaluation of liver fibrosis. Liver Int 33 (2013): 1138-1147.
- Leise MD, Poterucha JJ, Talwalkar JA. Vibration-controlled transient elastography using FibroScan for assessing hepatic fibrosis. PMC.
- CostAnswers. Fibroscan Cost Guide for US Clinics.
- Tsochatzis EA, Gurusamy KS, Ntaoula S, et al. Elastography for the diagnosis of severity of fibrosis in chronic liver disease: A meta-analysis of diagnostic accuracy. J Hepatol 54 (2011): 650-659.
- Lin ZH, Xin YN, Dong QJ, et al. Performance of the aspartate aminotransferase-to-platelet ratio index for the staging of hepatitis C-related fibrosis: An updated meta-analysis. Hepatology 53 (2011): 726-736.
- Singh S, Venkatesh SK, Wang Z, et al. Diagnostic performance of magnetic resonance elastography in staging liver fibrosis: A systematic review and meta-analysis. Clin Gastroenterol Hepatol 14 (2016): 1430-1440.
- Kim D, Kim WR, Kim HJ, et al. Association between noninvasive fibrosis markers and mortality among adults with NAFLD in the United States. Hepatology 57 (2013): 1357-1365.
- Younossi ZM, Koenig AB, Abdelatif D, et al. Global epidemiology of nonalcoholic fatty liver disease—Meta-analytic assessment of prevalence, incidence, and outcomes. Hepatology 64 (2016): 73-84.
- Echosens. FibroScan® probe calibration.
- Poynard T, Perazzo H, Lebray P, et al. Prognostic value of liver fibrosis biomarkers: A meta-analysis. Gastroenterol Hepatol 7 (2011): 445-454.
- Bastard C, Audiere S, et al. Guided-VCTE: An Enhanced FibroScan Examination With Improved Guidance and Applicability. Ultrasound Med Biol 51 (2025): 628-637.
- Herrmann E, de Lédinghen V, Cassinotto C, et al. Prospective Comparison of Transient Elastography Using Two Different Devices: Performance of FibroScan and FibroTouch. PMC.
- Rinella ME, Lazarus JV, Ratziu V, et al. A multisociety Delphi consensus statement on new fatty liver disease nomenclature. Hepatology 78 (2023): 1966-1986.
- Eslam M, Sanyal AJ, George J, et al. From NAFLD to MASLD: Updated naming and diagnosis criteria for fatty liver disease. Front Endocrinol 15 (2024): 1347679.